StockCharts Messages – 12/10/12

- These messages are never edited from the original post.
MARKET MESSAGES
12/10/12 – MON
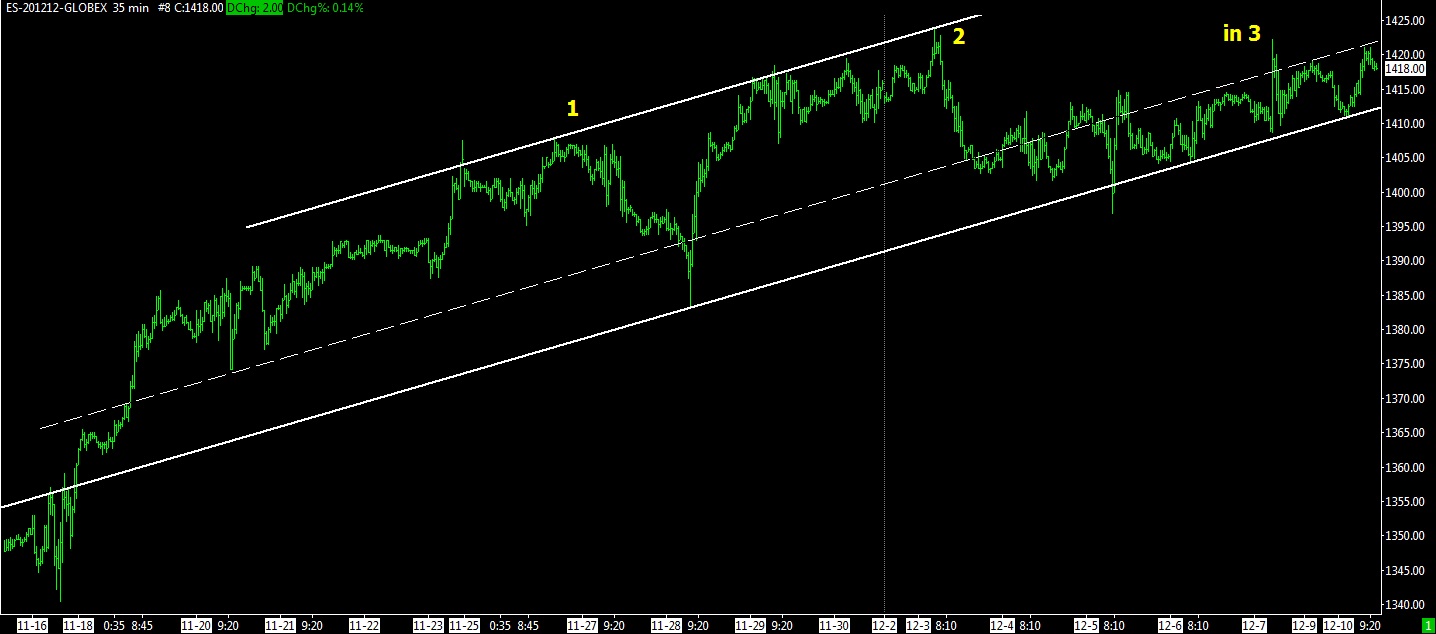
We have been in a consolidation pattern or rolling top for several days. It appears that we are in 3rd step up and we “should” better the prior high at 1425. If this is a rolling top, the new high would be minimal. See the dashed yellow lines for indications of a possible reversal point. A strong thrust through this line would indicate a breakout and the likelihood that we have been in a consolidation since December 3rd.

The white trend lines show that we are still in an uptrend, but it’s hugging the bottom line closely.
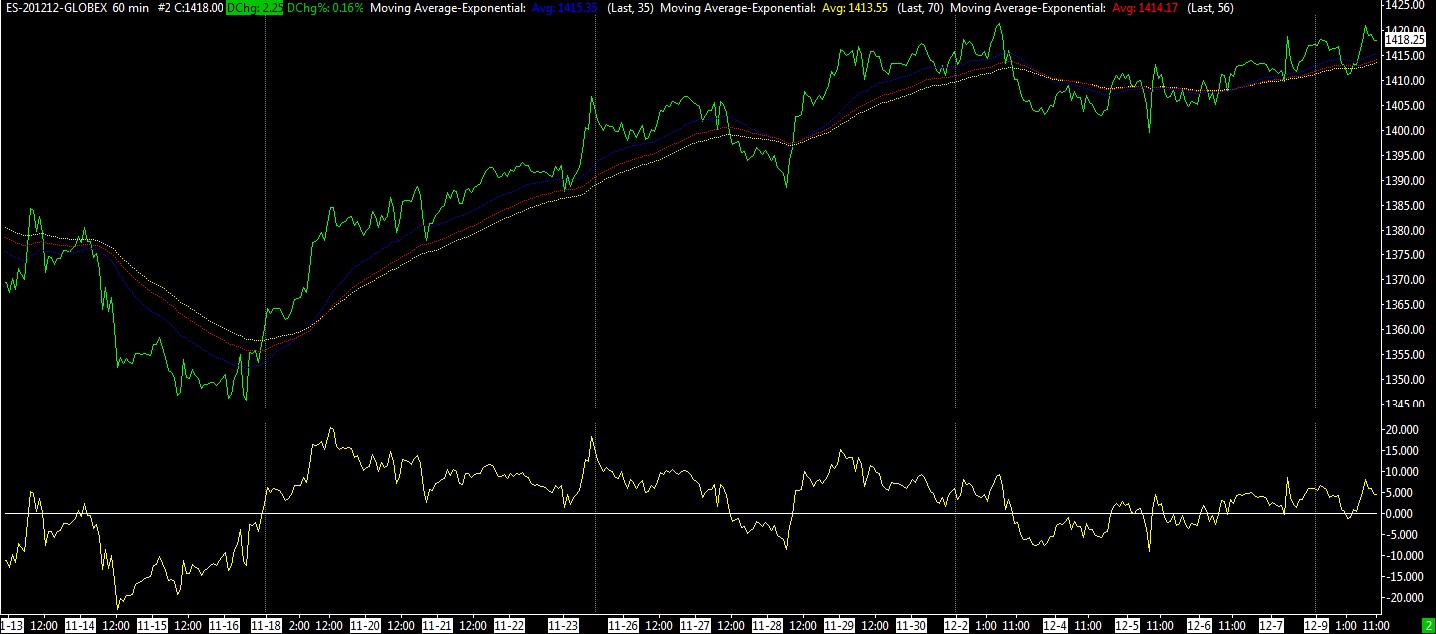
The chart below is the 5 day EMA trading system (see MY CHARTS chart #30.4 and notes below this chart). It’s a relatively good way to stay in the market for the broad moves. The lower line indicates the amount above or below the yellow EMA line. The upper yellow line is a 70 hour (10 day) EMA instead of the system’s indicated 5 day EMA (35 hour). Although it doesn’t get you in or out as quickly, it does have fewer whiplashes.
All Rights Reserved © ™
Explore posts in the same categories: UPDATE
Leave A Reply