2015 Tweets by Bob
 03/06/17 . . . by Bob Karrow
- My charts consist of all the items that Paul Desmond warned about in his paper, “The Warning Signs Of Major Market Tops”, which you can find at the following link
WAVE COUNTS
- If you aren’t familiar with my unorthodox wave counting method, there is a simple explanation at the beginning of the glossary. The glossary also contains lots of other details (explanations) that don’t appear in the blog.
TWEETS
- A lot of visitors to my blog are looking for information on T-Theory ®. The below link will take you to the index of all of Terry’s comments during the period Dec 2003 to June 2011. There are a considerable amount of charts and audio material from Terry Laundry in this section.
- If you are looking for the ability to make your own predictions using T-THEORY ®, I would highly recommend Terry’s Encyclopedia on T-THEORY ®
- Order the T Theory® Encyclopedia from Paula
EDSON GOULD
Dec 2015 – 107 TWEETS

Most of the world’s indexes are fractionally on the downside today pic.twitter.com/f9LEjJXsyj

Chart has 2 outcomes for 2nd step up: 3rd step up still to come Deeper correction ahead if 2nd step up is finished pic.twitter.com/0DEWNa7Waz

Worse than a double bottom could be heading our way too. pic.twitter.com/u6JU3Mm9lm

HAPPY NEW YEAR (in about 12.75 hours for me)
Transitional period appears to be taking place. This morning’s low could become a double bottom before rally begins pic.twitter.com/PJ0CHztQFK

The recent decline as seen in several indexes. I can count 5 steps down to this mornings low pic.twitter.com/sDTqSwVp4L

World markets stay on the downside moving into the US close pic.twitter.com/cs15tQWajz

Interesting lines, trade on color change or line penetration. I like line penetration as a signal generator pic.twipic.twitter.com/1BC8E4Y8RC


Market isn’t holding the support that it generated earlier today. Looks lower to me for a bit longer pic.twitter.com/Fx8pyAFpop

John Murphy CONSUMER STAPLES IS A DEC LEADER CYCLICALS AND INDUSTRIALS LAG BEHIND ROTATION FROM CYCLICALS TO STAPLES IS A SIGN OF CAUTION
One of the charts from my StockCharts public page, PAGE 2 CHART 1stockcharts.com/public/1169350… pic.twitter.com/pHP6nVWafk

Most of the world is on the downside today showing fractional declines except for the top 5 indexes pic.twitter.com/Oqjp87uxVJ

LONG TERM = BEAR Or short term with > loss tolerance SHORT TERM = HOLDING SHORT TERM BUY POSITION wp.me/p1DRwF-332


Minimal correction today. If tomorrow’s rally fails, I probably will leave the party. pic.twitter.com/tBXx3c0fT5

Looks like we may have completed 3 steps down. If so, the close should rally from here pic.twitter.com/Q1hb5lnJL1

Looks like most of the world is on the downside today. We’ll look at the close carefully. pic.twitter.com/57QFcobwdA

It makes me wonder why I’m still holding a short term buy position. As I said before, if Santa doesn’t show next week . . . I’m gone
Put Call ratio is on the edge of another sell signal pic.twitter.com/TcFvyDc8Aj

Half of another Dow Theory sell signal pic.twitter.com/Sr8zmjsLay

LONG TERM = BEAR Or short term with > loss tolerance SHORT TERM = HOLDING SHORT TERM BUY POSITION (WHY???) wp.me/p1DRwF-332
If Santa rally doesn’t appear next week, I will sell my short term buy position


Strong forces are at work if stocks go against the decade seasonality . . . or any seasonality tradition pic.twitter.com/MUSJxJ7jgx

Performance of years ending in a “5” are the strongest year of the decade. pic.twitter.com/0lQJYjtsrF

Bankruptcies among oil & gas companies have reached quarterly levels last seen in the Great Recession – Federal Reserve Bank of Dallas.
Bloomberg At least 9 U.S. oil company bankruptcies in 4th quarter More U.S. oil company bankruptcies may follow next year
Dana Lyons The U.S. stock market has not been lower for any year ending in a “5″ since 1875…that streak is in jeopardy.
Shorter term oscillators have just reached an overbought level, longer term oscillators are shy of overbought pic.twitter.com/Lm3fTs4Iti

McClellan oscillator has just reached the first overbought level. pic.twitter.com/YnuWG5pkBX

Has anyone Googled my birthdate in the bio section of my page (it ain’t my real birthday)? It’s a very famous pivotal date in WWII history
HAPPY HOLIDAYS TO ALL Isn’t that PC of me? When I was younger, we said Merry Christmas & my Jewish friends echoed back Happy Hanukah Bob
LONG TERM = BEAR Or short term with > loss tolerance SHORT TERM = HOLDING SHORT TERM BUY POSITION wp.me/p1DRwF-332
Possible we finished 3 steps up, but there may be subdivisions in steps. Tomorrow could give a clue to subdivisions pic.twitter.com/I85W25PUt1

1 small step up should complete 3 steps. Do we get 5 steps into the end of year, or a lump of coal for Christmas?? pic.twitter.com/SfINBw0247

Value Line Arithmetic & Geometric Indexes with trend channel lines (not on a log scale) pic.twitter.com/0gGpclQU1I


Warning: Star Wars Spoiler ! imgur.com/gallery/7xc3hatpic.twitter.com/qgKx0Mr3BN

The Fibonacci golden spiral signifying the end or the beginning??? Crazy times, that’s for sure. pic.twitter.com/oFsSx4qviV

End of Mike Burk comments
Conclusion The market is oversold giving us a perfect setup for the seasonally strong period that runs to the end of the year.
Typically I would be cautious as the improvement might be called going from worse to bad, but this is happening at a seasonal shift point.
The positives The overriding positive is Seasonality, but, for the past week there have been breadth non confirmations.
Huge Fri volume, positions were cleared prior to a vacation. This suggests extremely negative breadth of recent past was seasonal pattern
The sell off has lasted 1 day longer than average, but that coincided with the end of the week before Christmas. Nothing surprising.
The negatives On average the market sells off into middle-late Dec then rallies for rest of month on low volume.
4 trading days before Xmas, 3rd year Presidential Cycle, NASDAQ composite has not been down since 1967 & S&P500 has not been down since 1979
The good news: It looks like traders closed out positions Friday ahead of a 2 week vacation. Nearly 10 billion shares were traded on Friday
Hmmmm, no bounce at close. That ain’t good. Normally I see a bounce at the close on Friday declines (multi-day down) pic.twitter.com/TmDeULW9Aw


“If Santa fails to call the bears will roam on Broad and Wall” – Lucien Hooper
Look at the percentage decline seen in this order: large, mid, small & micro cap pic.twitter.com/HwJyiEOM85

This chart says the FED should be worried about inflation???? Ridiculous!!!! FED should be worried about deflation pic.twitter.com/EVPDlC2tb1

LONG TERM = BEAR Or short term with > loss tolerance SHORT TERM = BUYING @ END OF CURRENT CORRECTION wp.me/p1DRwF-332
Oil drilling defaults on junk bonds??? This article seems counter intuitive, but that’s just my gut feeling bloomberg.com/news/articles/…
Half of renewed Dow Theory sell signal today (Transports). Industrials have a long ways to go before new sell signal pic.twitter.com/PpmFFc51C7

Seasonality says decline should be finished soon. IF NOT & market continues against strong upward seasonality, THAT IS A VERY BAD INDICATION
LONG TERM = A SELLING BEAR Or short term with > loss tolerance SHORT TERM = BUYING @ END OF CURRENT CORRECTIONwp.me/p1DRwF-332
3rd step down correction is possibly underway. A new low is below Dec 13, Fibonacci lines are resistance guide pic.twipic.twitter.com/rI9NRma7Sy


There are 2 steps down since Nov peak, buying here is a short term whirl. Gotta be careful, watch for higher highs!! pic.twitter.com/phGacWl1mL

Pick your buy points carefully like during a correction that has seen at least 2 steps down.
This rally can be bought for a few days (???) Something different is possibly taking place on this rally. We’ll see???
LONG TERM = A SELLING BEAR Or short term & > loss tolerance SHORT TERM = SHORT TERM BUYING BULL wp.me/p1DRwF-332
ADX daily gave a buy signal on the recent bottom pic.twitter.com/GIomaHAbyw

@wekim77 Obviously looks like 2 steps down, but looking at the RUT, it looks like 1 step down & is complete, so ???? pic.twitter.com/JlVeY0P2BM

How Investors Ignored Risk of Junk-Bond Rout? They must have been living in outer space.
Barron’s published 2016 Outlook issue this weekend, & not one of top strategists it surveyed forecast that the S&P 500 would fall next year
Mike Burk Conclusion Upcoming seasonal strength is about the only visible positive.
Mike Burk The positives Market is oversold & due for bounce & late next week enter a seasonally strong period that lasts until end of year.
Mike Burk The negatives New lows finished the week at their highest levels in several months.
Mike Burk The good news is: Last 9 trading days of the year, which begin next Friday have been, on average, the strongest period of the year
Junk bond sentiment over the last year pic.twitter.com/VGQpegxMHx

Junk bond sentiment over the longer term pic.twitter.com/udyOQgEAD7


Longer term oscillator is oversold, only during Aug was this oscillator lower pic.twitter.com/Iblb6faqAi

LONG TERM = A SELLING BEAR Or short term & > loss tolerance SHORT TERM = @ NEW DOW THEORY SIGNAL, A SELLING BEARwp.me/p1DRwF-332

From Ned Davis Research Ignore Ned Davis Research at your own peril pic.twitter.com/8820YXg82D

WHAT???? It could happen again? Nobody told me that!!! History always repeats, only the details change. pic.twitter.com/3vhkyDhRvg

CARL ICAHN WARNS: I think the meltdown is only just beginning
Small & micro cap are near the limit of their envelopes, while SP500 has some wiggle room from its envelope limit pic.twipic.twipic.twitter.com/DeRU7FcRbj


What was the big mover in the stock market today??? One important word . . . deflation Commodity deflation has been underway since 2011
It was a 90% down day today. If so, we could rally for a few days next week. (StockCharts error on prior chart) pic.twitter.com/FZER3u5V67

Both 60 min and daily ADX are at or near oversold readings, which “should” generate a temporary buy signal. pic.twipic.twitter.com/CrN65JfwEL


We have lower lows. SP500 broke the low of Nov 16 today. Next we watch the late Sep and Aug lows for penetration. pic.twitter.com/1Rb3I50kk4

Dana Lyons with so many stocks already having broken down, it’s only a matter of time before leaders fail to support weight of the market
Fibonacci radial from May peak showing an upper limit rally line. We’ll see if it continues to hold back the rallies pic.twitter.com/mZKz3BFgw1

ES futures threatening to take out the Dec 3rd low pic.twitter.com/cE8auCF5DP

2009 – present wave count using an indicator for count instead of only price, indicates 1 more upside move possible pic.twitter.com/gVlNZMqWPT

The governor of the Bank of Canada just said the three most controversial words in central banking: “negative interest rates.”
High flyers haven’t broken down yet. I would “expect” them to show weakness before the final stage is over, but ??? pic.twitter.com/DFFmapneZe

High beta stocks are out performing the SPX on the downside. SPX will play catchup later pic.twitter.com/4JVaVNIw8U

Watching DJ Transports to possibly break prior low that yielded a Dow Theory sell signal. pic.twitter.com/h0f0Xdl5XN

Ditto oversold on the longer term oscillators pic.twitter.com/CXsz0EMuIE

Getting kinda oversold on short term oscillators pic.twitter.com/rhl0p7yR5P

2003 to 2007 wave count using an indicator for the count pic.twitter.com/FawmWxp9uu

Downtrend count since 5/15. Waiting to see break of 12/3 low & then 11/13 low, OR whether we break 11/3 high – ???? pic.twitter.com/vKgRhGTCFY

Gun stocks rally after Obama’s prime-time address Yippee ki-yay
Rare streak may point path to ‘severe bear market Hmmm, seeing lotsa comments that look like this. No one rings a bell at the top or bottom
The anti-euro, anti-immigrant party of Marine Le Pen led in 6 of 12 regions in mainland France Sunday, increasing its share to 28% from 11%
If we Significantly exceed Wed highs (???) count could have 2 more larger steps up with likely new highs in SP500 pic.twitter.com/Y1dOB9YqKx

Big rally Friday but the new highs had little power. pic.twitter.com/Rlvu0D5Q6N

Mike Burk Conclusion We have a combination of Seasonal strength with weak breadth.
Mike Burk The positives The breadth indicators are mostly weak, but, in about a week, Seasonality becomes very positive.
Mike Burk The negatives New lows finished the week at their highest levels in nearly a month.
Mike Burk The good news is: At the end of a very volatile week most of the major indices were up.
Nov 2015 – 200 TWEETS
Tweet #2 When the flow of money slows, the appetite for risk tends to decrease as well.
Tweet #1 When markets are flooded with liquidity, investors feel safer about investing in high-yielding assets, like “junk,” bonds, & stocks
See how wimpy the new highs are in comparison with earlier in the year. pic.twitter.com/Py0kNFgyQi

Value Line median stock price (geometric) compared to the average stock price (arithmetic) pic.twitter.com/TzWiiOtxhs

Long term wave count since 1974 to present pic.twitter.com/dpZZ0khhGE

Mike Burk The best December for the OTC was 1999 (+22.0%), the worst, 2002 (-9.7%).
Mike Burk During the 3rd year of the Presidential Cycle December has been up 62% time with an average gain of 4.6%.
Mike Burk Since 1963, over all years, the NASDAQ in December has been up 62% of the time with an average gain of 1.9%
Mike Burk The positives Because of the holiday, last week does not count for much, but, what did happen was good.
Mike Burk The negatives New lows decreased, new highs increased, a positive. SP500 & NASDAQ are 1.8% off their highs & new highs are lagging
Mike Burk The good news is: Last week the secondaries outperformed the blue chips
Advance decline line shows small & mid cap stocks have come alive recently, which is normal for this time of year pic.twipic.twitter.com/57rruxO2cp


RIP Richard Russell A great Dow Theory specialist who always got major trends correct I didn’t know that he had moved to N.C from La Jolla
LONG TERM = A SELLING BEAR Follow short term with greater loss tolerance SHORT TERM = A NEUTRAL BEAR wp.me/p1DRwF-332
John Murphy: THANKSIVING WEEK IS USUALLY GOOD FOR MARKET SO IS THE MONTH OF DECEMBER ESPECIALLY TRUE OF SMALLER STOCKS WHICH ARE TURNING UP
Forgot to mention the other day that junk bond sentiment can be the canary in the coal mine. With a peak in 2014, that’s a LONG lead time.
. . . Yawn
Junk bond sentiment has been poor for some time, meaning that investors aren’t buying junk bonds pic.twitter.com/WoiqypXuFl

Mike Burk Conclusion I think Weakness in breadth indicators means September low was not beginning of a new up leg, but a countertrend rally
Mike Burk The positives The breadth indicators have been weak, but Seasonality the remainder of the year is pretty strong.
Mike Burk OTC ADL was never strong as NYSE ADL, patterns are similar. OTC ADL peaked April & was weak in Sept rally pic.twitter.com/pyrapKAgte

Mike Burk Prices held up for months B4 catching up with downside ADL. NYSE ADL has also been failing with prices pic.twitter.com/7IuwpimFz6

Mike Burk OTC HL Ratio has been slightly stronger than NY HL Ratio, but also remained well into negative territory.
Mike Burk Secondaries underperformed blue chips & AD lines were flat. Strong rally in prices, NY HL Ratio is in deeply negative territory
Mike Burk The negatives Sensationally strong week for the major indices, NEW LOWS EXCEEDED NEW HIGHS EVERY DAY LAST WEEK on NYSE & NASDAQ.
Mike Burk The good news is: Last week the market had its best week in a while.
3 step decline underway, so far it is a minor move, waiting for end of down step to see quality of rally following pic.twitter.com/JghKoMesk8

Junk bonds (JNK) weekly chart showing wave count pic.twitter.com/axkPuoJR92

Valeant (VRX) could have made a successful bottom. Downtrend radial breaks should confirm the bottom. pic.twitter.com/z0BoKZUq8u

Alternative wave count #2 since 2009. This calls for another step up Trend channel breaks are the determining factor pic.twitter.com/pSYeQzt3ak

Alternative wave count #1 since 2009. This calls for another step up pic.twitter.com/Qvx2kGu8bO

This is the wave count since 2009 that makes me nervous. There are alternative step counts, next few tweets pic.twitter.com/2UbaBfCSQO

Clearly showing 2 steps up since the bottom on 11/13. One more to go. pic.twitter.com/8VR8S5HwZD

Stil in a small 3rd step up, waiting for conclusion to see what happens on decline pic.twitter.com/hiD9tUG3de


New highs are tepid for small, medium & large caps pic.twitter.com/Zxjy51Qkka

Equal weight SP500 ratio to normal SP500 is falling again pic.twitter.com/RwExrfVSlj

This is more like a normal step 2, spending time correcting advance. “Could” work off the oversold by going nowhere? pic.twitter.com/YhNbar1Nyz


If rally should quickly exceed prior rally peak, might indicate that market is in a 5 step rally?? completing 2 of 5 pic.twitter.com/l8HowSRMPz

A well organized 3 step down occurred during the night & completed a short time ago. Rally is underway from decline pic.twitter.com/xAFYgBzKcj

How the day went using my moving average lines, 15 min charts 13 time unit 21 time unit 34 time unit 55 time unit pic.twipic.twipic.twipic.twitter.com/rzaZLX4l6b


Another strong burst upward tomorrow would be a horse of different color. I would likely scratch my head vigorously pic.twitter.com/1neaZIVUrW

Market will close near its daily high Dow Ind near Fibonacci radial. Likely to consolidate tomorrow after line touch pic.twitter.com/5y8QO7ZP8b

When bad news turns out to be good news. Important how market reacts to bad news Fed Minutes: December Could Well Be Time for Rate Increase
John Murphy % OF NYSE STOCK OVER 200-DAY AVERAGE IS SAME AS IN NOVEMBER 2011 & THINGS TURNED OUT OK S&P 500 EQUAL WEIGHTED ETF LAGS BEHIND
John Murphy STOCK INDEXES TRY TO RECLAIM 200-DAY AVERAGES SMALL CAPS NEED TO SHOW MORE BOUNCE
About 50 more Dow points upward and price will be against a declining Fibonacci radial pic.twitter.com/zABokGl8Cq

Small cap (chart 1) and micro cap (chart 2) are still lagging behind the larger caps pic.twipic.twitter.com/i3QzyEios5


Without a correction, the 60 min ADX is heading towards a sell signal in not many days. We’ll see how that goes. pic.twitter.com/WYWoeIapdq

I missed an ADX buy signal that was given on Nov 13 pic.twitter.com/F9mNvq0dIK

FED minutes today at 11 AM PST or 2 PM EST. The minutes may have something about raising rates and could whip the market around for awhile
Following yellow Fibonacci radial upward, but gray radial is making ES futures hang around area of declining line pic.twitter.com/zNFKJXgxuw

We started up in step 2 after a minor decline pic.twitter.com/n1PM9QlzB9

FED minutes are released on Wed at 2 PM Watch what market does leading up to release Watch what happens 30 minutes after release
Cheap Saudi oil is hitting domestic fracking oil production hard. pic.twitter.com/4Nzd9dNkYi

OK with more rally, larger rally may mean number relabel Step 3 can be the entire decline, as if 1 & 2 didn’t exist pic.twitter.com/O3zEUR2ZJO

We certainly have broken cyan step 2 down, but that doesn’t preclude more rally. More rally could be topping steps pic.twitter.com/ojlKJPECQi

That could be a 4 & 5 step down. If not, then expect a larger decline than a minor blip. pic.twitter.com/tji1pbbKVW

Patience is usually learned thru mistakes. That was how I learned patience. pic.twitter.com/VfX5Zg5dE8

Small 3 step down, we’ll see if its going to be a larger step up?? pic.twitter.com/VfzO4zLOYN

LONG TERM = SELL OR follow short term with greater loss tolerance Short Term = NEUTRAL (conservative) wp.me/p1DRwF-332
We’ll see how big retracement is “if” it has begun. 38% or 50% would be reasonable if trend is up for longer period pic.twitter.com/hRhZSHw8rn

I know this was a tradable rally & sorry I missed it, but I am a bit conservative until major direction is resolved pic.twitter.com/wAuNQFTkML

Market was oversold & due for rally, but I still wonder if this rally will poop out & decline back to area of cyan 2 pic.twitter.com/osZmOBLeXA

Fibonacci radial from May peak & radial from recent bottom. Resistance radial at current high today & 200 day avg pic.twitter.com/yM2wTJpS6M

@wekim77 Sometimes can have strong step 2 up move, strong enough to go all the way back to old highs before back down, we’ll see???
Sunday’s reversal came at projection level (purple) and a Fibonacci retracement level of 38% pic.twitter.com/TtjxK0Jn8Z

LONG TERM = SELL OR follow short term with greater loss tolerance Short Term = NEUTRAL wp.me/p1DRwF-332
Is that it, do we have a good bottom? Not by my count. Should have 1 more step. But I could be missing something???? pic.twitter.com/mcfbtw309s

ES futures bottomed on the Sunday open & rallied. We’re in step 3 up & it has become more vertical, more to go pic.twitter.com/chfJ0jEtcC

Je suis Française #ParisAttacks
Ce soir je suis Française
The S&P 500 lost 1.1%, widening this week’s decline to 3.6% while the Nasdaq Composite (-1.5%) underperformed to end the week lower by 4.3%
Looking at Fibonacci retracement levels shows this is not an unusual decline, but it is probably spawning fear pic.twitter.com/L5zXV7DnRc

Step 2 down is obviously a waterfall event, which is usually reserved for a step 3 pic.twitter.com/NbHeEet6xD

ES futures (SP500) showing a probable step 2 down in progress. Fibonacci radial shows support at current levels. pic.twitter.com/fMQzFV4e5P

John Murphy Today CYCLICALS LOSE LEADERSHIP PLUNGING RETAILERS CAUTION SIGN FOR MARKET SMALL CAPS LOSE MORE GROUND VIX CLIMBS BACK OVER 20
Is there a relationship with Sotheby’s peaking before the market?? It was a coincident peak in 2007. pic.twitter.com/yrg1WcShBM

Today DecisionPoint Scoreboards from DecisionPoint Chart Gallery lit up with 4 new Short-Term Price Momentum Oscillator (PMO) SELL signals


This still remain an interesting chart, spacing is equidistant pic.twitter.com/FyK50axx4O

It looks like gold began its 3rd step down since peak in Jan 2015 Inflation/Deflation looks stabilized for awhile pic.twitter.com/g74cF4tBy2

Lower part of chart is a John Murphy favorite, but I haven’t heard him comment on this indicator in a long time pic.twitter.com/rcKgDVFqLi


All of the white background charts that I post are from my public StockCharts. stockcharts.com/public/1169350 Black backgrounds are Sierra Charts
New lows are rising significantly & new highs decline This is a problem Mike Burk has complained about for weeks pic.twitter.com/wmGkFNxps4

SPX new highs pooped out before small & mid caps did. see big divergence in last week of October for SPX new highs pic.twitter.com/LLMAVFb8tc

Equal weight SPX / Regular SPX ratio has been declining since late August. Only a few in SP500 are pulling the load pic.twitter.com/WrDUngZaRX

Put Call ratio gave a sell signal on Nov 1 pic.twitter.com/r8EJuYqlci

Dow Theory – major sell signal in Aug Minor divergence in Tran in early Nov Today Tran broke short term support pic.twitter.com/Fayn8SBct2

1st chart – small caps 2nd chart – mid caps Small & mid caps are falling hard including their advance decline lines pic.twipic.twitter.com/d4BVJ61vmC


1st chart – longer oscillators oversold 2nd chart – shorter oscillators oversold Summation index turned down @ +500 pic.twipic.twitter.com/UKqdfhgRZe


LONG TERM = SELL OR follow short term with greater loss tolerance Short Term = NEUTRAL/SELL wp.me/p1DRwF-332
No other index followed is very close to its limit envelope Possible count says finish current step down plus 1 more decline b4 bigger rally
NYA index is also close to its 60 minute limit envelope. Last time it was this close was on the late Sep bottom pic.twitter.com/JdzKxA3eUd

ES futures (SP500) is close to its 60 minute limit envelope. Last time it was this close was on the late Sep bottom pic.twipic.twipic.twitter.com/iRJ2sQTKwe


Upon that bright ray of sunshine, I’m going to lunch with friends “May the Force be with you”
Best Worst Case – Red III could bottom 25-30% below May peak Worst Case – We are in bear market aiming 3/2009 lows pic.twitter.com/bkkYgO7Hf8

If we are in red II down, we made important peak in May 2015. Red II & III could stop at substantially lower levels pic.twitter.com/1vpCECxJBW

Have to be alert is a possible red II down, below Aug Sept lows Otherwise We stop and rally into steps 4, 5 up pic.twitter.com/t4eqoC1REB

Only in step 2 down (cyan 2)? Purple line projections from early peak Grey lines are Fibonacci retracement lines pic.twitter.com/KzIxZV8U7Z

Status tweet is pinned to my profile page, you should keep track of my long term status tweet for any change. Short term is not a good gauge
“I haven’t spent enough time analyzing market” Shame On Me!!!! It took a reader (Michael) to poke me & wake me up to reality Thanks Michael
Make money while you sleep is the desired end result – I know it’s not possible, but I always try occasionally pic.twitter.com/uYCt05J5mR

I haven’t spent enough time analyzing market, because I’m working on automated buy/sell signal project – see chart pic.twitter.com/Mkwp2n08UB

Worst Case – RED step 2 is underway Best Case – YELLOW step 4 & 5 are still ahead pic.twitter.com/UMeSDnGDoZ

I’ve wandered off message & that is we MAY have made MAJOR peak in middle of May & decline is likely from that peak pic.twitter.com/3CIUE4rUNt

CLEARLY the correction following the recent peak has not finished, needs more time to digest rally since late Sept pic.twipic.twitter.com/q3WowsJoSq


Can’t see the forest for the trees My Bad Mistake – Short term & ignoring intermediate pic, should have called quick exit on QUICK flip buy
LONG TERM = SELL Follow short term with a greater loss tolerance Short Term = NEUTRAL/SELL wp.me/p1DRwF-332
This “could” be what’s happening short term, a lower 3 is about to occur pic.twitter.com/bYDkOLF8Uw

I don’t see the wave count differently here for ES or NASDAQ futures BUT DJ Ind do look different – next tweet pic.twipic.twitter.com/8pDpE3KPpd


I assume that every tweet reader has access to a live chart to keep current, but if not ES futures (free) investing.com/indices/us-spx…
Or the count could be going like this, if 3 step up & then goes below yellow 1 down, abandon long positions pic.twitter.com/KaEwaloJqW

Probably what’s happening, a small 3 step correction, if it breaks through the 7:50 am bottom, it’s more than small pic.twitter.com/4TFVXKCPFN

1st chart, NASDAQ futures show the steps, 2nd chart, ES futures is not as well defined, Follow the NASDAQ steps pic.twipic.twitter.com/UrqA1Y8b1l


Rally is underway with nice profits for those who anticipated early. pic.twitter.com/5wT9SBrM2T

DJ Ind futures & NASDAQ futures in step 5 down, a rally “should” come after this small 5th step down is finished pic.twipic.twitter.com/Ay3lfCGhi1


LONG TERM = SELL Follow short term with a greater loss tolerance Short Term = Buy quick flip Short decline fini? wp.me/p1DRwF-332
Rally coming, in step 5 down, but it doesn’t look finished. Need to see a rally above high that followed step 4. pic.twitter.com/i3cYMD3fRt

SPX Fibonacci radial showing resistance presently pic.twitter.com/p9SNFrnD8G

Short Term = Sell if comfortable No one is comfortable if you have loss, but mark yourself to the market EVERY DAY to keep reality in sight
3 step rally late today in ES futures, can’t tell if step 3 is finished (needs further decline), or if a 4, 5 needed pic.twitter.com/NPfLbRETw4

Next Fibonacci radial on each chart is approximately at the same price level. Could be a rally point? We’ll see? pic.twipic.twitter.com/eKPpdaxqsg


1st chart, Fibonacci radials from Aug bottom & Sep peak 2nd chart, Fibonacci radials from Aug bottom & Oct peak pic.twipic.twitter.com/KGWf61I2ML


LONG TERM = SELL Follow short term with a greater loss tolerance Short Term = Sell if comfortable Rally finished wp.me/p1DRwF-332
Should have decent decline if step 3 is finished, but sub-stepping could interfere with this count. Gotta wait & see pic.twitter.com/pZHbArSERn

NYA count leaves open possibility of step 2 & 3, which would be steps 4 & 5 in the SPX pic.twipic.twitter.com/xiS4B4zGlY


Different wave counts between SPX and NYA. This happens frequently and you have to judge how it plays longer term pic.twipic.twitter.com/D4gIDpF8S8


Chart labeled as yellow 4 down, but is it yellow 5 down? Cyan 3 isn’t yellow 1 down cuz needed cyan 3 up completed pic.twitter.com/8IYwa08EN8

Good projection that hit the target precisely, based on closing figures & then showing intraday figures hitting peak pic.twitter.com/rMJk9tcXbs

Not too much doubt that we broke the prior channel. Gotta take the ? marks from steps 4 and 5. Now what happens?? pic.twitter.com/Y5xKf16YC5

Mike Burk Conclusion New lows have been increasing, the AD lines have been weak and Seasonality is weak for the next 2 weeks.
Mike Burk The positives You have to go back to mid July to find more NASDAQ new highs than we had on Friday.
Mike Burk The NYSE ADL has been stronger than the OTC ADL, but it has also come up short for the past 2 weeks.
Mike Burk Ideally the Advance Decline Line should be running parallel to the SP 500 Index & DJ Industrials, instead the ADL lags far behind
Mike Burk The negatives: The advance – decline lines (ADL) have been persistently weak and new lows have remained high.
Mike Burk The good news is: Last week the secondaries outperformed the blue chips for the first time in quite a while.
Sunday evening trading in ES futures begins a new day. We’ll see what happens then. I’m going to work on the chores I’ve put off for so long
SPX (ES futures) didn’t do anything today to break the decline channel pic.twitter.com/D3DlAIfZFg


Valeant (VRX) Price Target Cut to $195 at Guggenheim after prior target of $300; Thesis Intact says Guggenheim
Valeant Pharma (VRX) May Be Seeing Real Institutional Buying
Valeant CEO Mike Pearson had pledged 1.3 million shares as collateral were sold 10/5 due to margins calls.
Reuters Bets on Valeant Pharmaceuticals left some hedge funds nursing heavy losses last month when the stock price tumbled nearly 50%
Russell top 1000 and Russell mid caps, both have looked a little sick recently pic.twipic.twitter.com/PfQWkOPRyw


Today the micro-caps did make a new recovery high, catch-up or late finish???? I’ll go with a late finish pic.twitter.com/kOdkYMKVpf

Putting the small caps in perspective since their bottom pic.twitter.com/mPdWlDAEPZ

Today the small caps want to challenge their recent high pic.twitter.com/vV2wA4XoNw

5 steps up since late Sept bottom in NYA, this chart indicates it’s very likely the decline has further to go pic.twitter.com/DCP4hi5M0g

ADX lines moving away from the extreme levels noted recently pic.twitter.com/6xe4nJv7zV

3 different price projections that have been fairly accurate, each has higher projection waiting for steps 4 & 5 up pic.twipic.twipic.twitter.com/IqQS8cQrhE


Waiting for confirmation on this wave count pic.twitter.com/QWHOFjGpML

No confirmation that the white 3 was the end of this step up pic.twitter.com/HrfFK918UK

Waiting for confirmation of the 4 & 5 in this wave count, needs lower lows to confirm pic.twitter.com/zOAhliqRXk

Two possible wave counts on VRX, either may be correct, but for now I am going with step 5 happening now pic.twipic.twitter.com/8Er4AB7EJl


1 more step down and it might be all finished on its waterfall decline, but that ain’t engraved in stone. pic.twitter.com/Ejvi1wHhhz

Short term wave count, rally now, but how high? Possibly no new high on this rally, but if we do, then steps 4, 5 up pic.twitter.com/r7NewYKJDq

Catch a falling knife anyone??? Not me, not yet. pic.twitter.com/ynGB1UbQT7

Long term daily chart for Valeant, parabolic??? pic.twitter.com/CTfLj707qL

Doesn’t this remind you of Lehman? If Valeant went bust it could mess up a lot of funds, maybe a crippling blow? pic.twitter.com/lIXsb2XNVi

Close up of Valeant Fibonacci radial & step count. Last step down doesn’t count as complete, one more step needed pic.twitter.com/KPgOSqvNy9

I own this stock by way of Sequoia Fund pic.twitter.com/WWaOle72UI

Need to see significant reversal for last step to be completed, higher high would be important for reversal pic.twitter.com/iVrRVLnxx0

Biggest volume spike earlier today. Institution bailed out, WHO? Remember, another institution was there to buy it pic.twitter.com/z3l7k8R3hO

Of course if Valeant did miss a royalty payment, then things may really be wrong. LOTSA institutions hold this baby pic.twitter.com/bouQutKD9W

Valeant Pharmaceuticals keeps going down, but the decline may be close to finished, Fibonacci radial and wave count pic.twitter.com/xGQVm2q5vA

LONG TERM = SELL Follow short term with a greater loss tolerance Short Term = Sell when comfortable Rally peaking wp.me/p1DRwF-332
Will the market rally after hitting the cyan trend line? If rallies back to new high, then step 4 & 5 labeled wrong pic.twitter.com/R1540cgTCx

@wekim77 Don’t know, but it means money is leaving the stock market and trying to find a safer haven
Another look at the wave count in the ES futures pic.twitter.com/ASNBEHz7lb

I’ve redrawn the trend line (red) for ES since the Sept bottom. I like red trend lines better than the older cyan pic.twitter.com/CQezzw7zpQ

ES futures since late Sept low with channel trend lines still in force. pic.twitter.com/FzhbsI8P52

Short term wave count as it stands today. Is 3 finished, or will there be a 4 and 5? pic.twitter.com/16KIGK38QA


Small business lending index through Sept pic.twitter.com/wocf6VhizA

Jason Goepfert Mutual fund investors giving up. Over past 6 months, sold $100 billion of domestic mutual funds, largest outflows in 30 years
Indicating narrow leadership, Russell Top 50 & NASDAQ 100 have made new highs. Only a few stocks are leading rally pic.twitter.com/huC6MQZaXa

New highs are not keeping pace with this advance. Even SPX new highs are lagging. pic.twitter.com/zfLAO7YUc6


Put Call ratio slowly degrades towards the sell line of the envelope pic.twitter.com/m20Xx9m68p

Shorter term oscillators in this chart. pic.twitter.com/XgtNQCEvnm

Good sign when market remains overbought for longer period of time. pic.twitter.com/l5URxXk6X3

Small caps are putting on their best show since beginning of the rally in early Oct. Catchup? Or closing blowoff? pic.twitter.com/cONdYjK0Cl

The NASDAQ Composite is on the top of its envelope. Past reversal have come from the peak envelope point. pic.twitter.com/nX9BVbeMyM

DJ Industrials are near the top of their envelope, limiting future gains pic.twitter.com/BRhQD0VOjx

ADX is close to a daily reversal point, but isn’t quite to an EXTREME level yet. pic.twitter.com/Qsu5CNQPtE

ES futures (SP500) remains within its long trend line from 9/29. ES has a subdivided wave count also pic.twitter.com/7K7XcKA0Gn

Stock market has accelerated to the upside in subdivided 3rd step. Purple trend lines are steeper than steps 1 & 2 pic.twitter.com/VdQNyleO4q

Next projected Fibonacci resistance level is SPX 2139 (new high) pic.twitter.com/6NECLnk69D

Small caps are far from a new high. Small caps are expected to seasonally outperform SP500 in Dec & Jan. pic.twitter.com/ljXFJj37go

See how close the SP500 is to making a new high. May was the peak pic.twitter.com/TNxcfN9bsY

Friday’s decline and today’s rally count pic.twitter.com/jfwlnw615J

Possibility is that instead of a significant correction taking place, yellow 5 step could represent only 1st step up pic.twitter.com/Y3X6gBWpYn

Perceived wave count in the NASDAQ. When step yellow 5 breaks its channel, expect a larger correction pic.twitter.com/HZBKvooXl1

LONG TERM = SELL Follow short term tactics with a greater loss tolerance Short Term = Sell Rally peaking wp.me/p1DRwF-332
Oct 2015 – 146 TWEETS
SP500 new highs had been falling on the latest advance, more clues that the market is going to have a correction pic.twitter.com/pXIZn1HZbg

Mike Burk Market has been following 3rd year seasonal pattern with negative bias. Seasonal pattern calls for another week or 2 of strength.
Mike Burk The positives Little reason for exuberance, breadth indicators have not fallen out of bed & seasonality will be ok for a week or 2
Mike Burk The Negative The advance – decline lines (ADL) have been weak and downside volume has remained very high.
Mike Burk The Negative The secondaries continue to underperform, new lows remain uncomfortably high
Mike Burk The good news is: The NDX (Big tech index) closed at an all time high Wednesday.
ES (SP500) sold off at end of day and then day traders covered their shorts for the day. pic.twitter.com/92AEmfd9Z2

JNK is the most liquid (high volume) of the junk bond ETFs. JNK probably illustrates junk bond performance better due to its high volume
Long term look at junk bonds, JNK. They peaked in May 2013 (1st peak) and then again in June 2014 (2nd peak). pic.twitter.com/QTfOy4N7A8

Sudden decline at end of the day. Traders don’t want to hold stocks over the weekend pic.twitter.com/WxUthGuFIR

SOX hit upper boundary of 60 minute envelope & turned downward. Usually indexes stay close for awhile & then decline pic.twitter.com/hSQ9M12TNY

Resistance at upper bounds of 60 minute envelope for NASDAQ pic.twitter.com/HdS9xsnBCa

Is this downward Fibonacci radial still exerting influence???? We’ll see soon. pic.twitter.com/5VdeSwBNX1

Another Fibonacci radial showing resistance areas pic.twitter.com/qMzN6UxEnf

Fibonacci radial that shows resistance areas pic.twitter.com/QJSMW0e9Fw

Good looking purple projection levels for resistance. Peak around SPX 2093 seems likely before correction begins pic.twitter.com/aOBHQ8osTL

LONG TERM = SELL Follow short term tactics with greater loss tolerance Short Term = Sell Rally peaked or peaking wp.me/p1DRwF-332
Terrible recovery that RUT small cap made since late Aug bottom. Large caps are close to highs while others wither pic.twitter.com/nZhoHkq1de

When I say SELL or BUY in the status update, that means picking the best short term spot to execute that order and NOT executing immediately
But after Jan 1 a greater correction could take place, something below red II shown in chart pic.twitter.com/Ber7xhDyXO

Steps 4 & 5 will be possible with a correction that has a higher low than late Sept, stopping above yellow 1 & 2 pic.twitter.com/oi9k9zBfO1

Imagine a deeper correction after 3 & then a steps 4 & 5 to new all time highs on large caps, but smaller caps fail pic.twitter.com/gMMa8DmnOU

I know we have entered the strongest seasonal period of the year and I’m growing bearish. Perhaps we will have a 5 step up instead of only 3
Since late Aug bottom, this is my perceived wave count. Larger correction to begin soon. pic.twitter.com/3oHrPJxznc

Always put your trust in BREAKING THE CHANNEL as to when a wave count has finished. This is always the FINAL ARBITER pic.twitter.com/IuN5DrhlcK

This is really fine tuning the market & can be disrupted by news. Smaller the wave the less trust you should have pic.twitter.com/5ppzkPHrBs

White step 3 will probably be another top in the area of white step 2. Correction to begin after white step 3 pic.twitter.com/V5nLVe84gz

Rally count since late Sept. Market in a longer yellow step 5 that has 1 more step to go (white step 3) pic.twitter.com/h4A59ERmi6

Over the last 2 days, the market has been coming down in a 3 step correction. “Should” have a rally when #3 is fini pic.twitter.com/EqjITRPyvq

Dana Lyons Is the hand-wringing over laggard small-caps justified? Upon inspection, we are still not sure as results were quite conflicting
Equal weight SP500 / Weighted SP500 Strength amongst the few while most are weaker My StockCharts “PAGE 2 CHART 4” pic.twitter.com/mbL6PSHwAd

Tweeted this yesterday & today we’re getting that last step up rally “Rally since late Sept may have 1 more step up & then correct”
Tooting my own horn re: status tweet on 8/26/15 declaring bottom in place. This precision isn’t possible without my wave counting technique
8/26/15 Tweet of bottom in place LONG TERM = SELL RALLY ON APPROACH OLD HIGHS SHORT TERM = VERIFIED BOTTOM LIKELY, RETEST STILL POSSIBLE
Tooting my own horn How many people were warning about a LONG term peak in late April 2015???
Prior to the 4/30/15 Tweet, I had a HOLD on long term holdings, then changed to warning of upcoming long term peak. SPX peak occurred in May
4/30/15 Tweet warning of the future peak LONG TERM = HOLD (long term top forming) SHORT TERM = Short lived rally soon, mid-day Friday ???

NYSE index Fibonacci radials, resistance on the radials have proven valid pic.twitter.com/1CBsh61Hw9

60 minute chart of junk bonds shows possibility of completing 3 steps up since late Sept stock market bottom pic.twitter.com/W5H1aUIU65

Present rally doesn’t convince me that large step II is complete??? Junk bonds are early warning radar for market pic.twitter.com/wkTADsUiZJ

Junk bonds completed 2 steps up since late Sept bottom. Since June 2014 peak, they have completed 2 large steps down pic.twitter.com/pItp6BUN3H

RUT (small caps) is still stuck. Looks like it completed 3 lethargic steps up. Correction is next for the RUT pic.twitter.com/cBUSNdiDYA

Today the NASDAQ is leading the market higher, SP500 & DJ Ind are lower pic.twitter.com/QXSF0w4CYD

LONG TERM = SELL/NEUTRAL FOLLOW SHORT TERM TACTICS Short Term = Sell/Neutral Rally peaking wp.me/p1DRwF-332
Worst case is that we are in a large correction, 25% or greater Best case, we will bottom above SPX 1867 & rally pic.twitter.com/sALHrTHz2a

Rally since late Sept may have 1 more step up & then correct. Correction will show if we are in 5 step rally pic.twitter.com/XfEzDfPZwr

Waiting to see when yellow “3 fini ?” is finished cuz a correction will take place. Worst fear is red II will start. pic.twitter.com/XunBR2iyBE

Value Line Index (VLI) is unweighted index of all stocks on the NYSE. Adv Dec line of all stocks verifies VLI stasis pic.twitter.com/pBSx2UJ7BP

Future is dreary if small and mid caps don’t play catchup with the large caps. Tick tock . . . . Time is running out
Small caps are static and refuse to rally pic.twitter.com/sMPqn0owVK

Mid caps are static and refuse to rally pic.twitter.com/m3y0FzUACL

Large caps are leading the market, but ONLY the large caps are participating in this rally pic.twitter.com/kFGcDr5zw4

Jeff Saut Corporate revenue growth is still abysmal with only 42.8% of reporting companies beating estimates. Bob Revenue recession???
Lowry’s If an important market bottom occurred late Aug, should be seeing strong trends in our buy sell indexes, but that isn’t happening
Bob says: I’ll be watching how the market REACTS to good news. A good news rally that loses its luster quickly is a warning.
Jeff Saut This week, we look for a trading top, the decline should not be that bad with the Chinese rate cut, FOMC meeting, BOJ’s statement
Jeff Saut We remain optimistic on a longer-term basis, but realize the reality of the Dow Theory “sell signal” has NOT been reversed
Chart shows 3rd step up in the current rally that began in late September. Gotta watch for next significant decline pic.twitter.com/yYcMCARm0u

LONG TERM = NEUTRAL/SELL FOLLOW SHORT TERM TACTICS Short Term = Buy/Neutral Rally Nearly Finished wp.me/p1DRwF-332
Mike Burk The weakness in the secondaries is troublesome, however, new highs are coming to life and the next 2 weeks are seasonally strong.
Mike Burk However, if the secondaries do not improve, this is likely to be a developing top.
Mike Burk We are entering a strong seasonal pattern that is likely to give us new all time highs in the blue chip indices.
Several large cap indexes are bumping on the upper edge of their 60 minute envelope limits. pic.twitter.com/mJNL5qxMKJ

LONG TERM = NEUTRAL FOLLOW SHORT TERM TACTICS Short Term = Buy/Neutral Rally Nearly Finished wp.me/p1DRwF-332
Another look at the wave count using only daily closing figures. pic.twitter.com/GsEhEozWxV

SPX 2065 is the next projected resistance level. 2093 resistance after 2065. pic.twitter.com/gmi4iA6epp


A possible wave count for the NASDAQ indicating we’re in last step up before a bigger correction takes place. pic.twitter.com/OTR1KGx52P

Or look at what the micro cap index did today. Some stocks are being left far behind in this rally. pic.twitter.com/oTgw0ksjDK

Look at what the small cap index is doing today . . . NOTHING That’s give pause to think about things pic.twitter.com/Yh9qkF1CbF

@focus1234567 Prices are always prior highs & lows, those are always the important levels Bear market rally likely, but count problems exist
@focus1234567 I want LONG TERM to define the real trend, Short Term should just be a week to week trend.
LONG TERM = NEUTRAL FOLLOW SHORT TERM TACTICS Short Term = Buy Rally Not Finished wp.me/p1DRwF-332
@focus1234567 I think NEW people are confused by my strategy. Every long & short term strategy tweet will have a buy, sell or neutral in it
@focus1234567 Nothing changed. Long term is neutral & short term is a buy today, but could be a sell tomorrow. It was a clarification move

More later about wave counts
Only concern is whether I have made the same mistake that I made in MAY 2006. That was a step miscount that gave me a TOO EARLY peak warning
The trendlines shown don’t indicate that the bull market has ended, but the count indicates it’s possibly finished pic.twitter.com/P78qWwvG8X

@wekim77 I ain’t dying, hurting really bad cuz I was so clumsy & fell on my motor home car hitch, thought I broke my hip, HUGE ugly bruise
Life’s a bitch & then you die . . . Meaning I’m hurtin’. I’ll try (???) to keep up with the market & not miss any important observations
Walmart online could compete with Amazon but needs to change online interface & include more bells & whistles. They’re in DISTANT 2nd place
With Amazon I can see in advance (reviews) if the product I want is a dud and should be buying a different model from another manufacturer.
Walmart said Amazon is causing big problems. I don’t shop like I did 10 years ago. I shop online (Amazon) buying EXACTLY the product I want
Bank earnings didn’t cause any problems for Wall St (except JPM), but Walmart was kick in the gut today for the Dow Industrials.
The recent peak came exactly at a predicted resistance level. pic.twitter.com/Od4bWIgUOL

This unusual options trade signals that Wall Street is bracing for a black swan marketwatch.com/story/this-unu…
Bloomberg “the worst commodity bear market in a generation” Commodities are supposed to breakdown AFTER stocks, but not this time???
1st step rallies are significant, while 2nd step rallies are insignificant & 3rd step rallies signal a reversal of trend with a larger rally
SPX has retraced between 50% and 62% of preceding decline. pic.twitter.com/4b4NxsCBxn

In bear market, you never know when we’ve had enough rally from step 1 down. These rallies can carry back to old highs, or only retrace 1/3
Some big banks are reporting earnings in the next 24 hours
It’s possible that step 3 is all part of an extended step 2. After channels are broken, we’ll know for sure. pic.twitter.com/kGjW4Zwri5

A possible wave count with loss of momentum pic.twitter.com/yqXUf3cCB7

Obvious loss of momentum over the last few days in the SP500 futures. pic.twitter.com/ULmlNWchok

@wekim77 About the same, BUT we could get a 5th step as shown in earlier charts. I would not be surprised by another bottom test or 5th step
Jeff Saut Keep your shopping lists close, because if we get a pullback here, it’s going to be for buying as long as 1867 continues to hold.
LONG TERM = SELL ALL, OR SWITCH TO SHORT TERM TACTICS UNTIL FURTHER NOTICE SHORT TERM = DECLINE MIGHT BE COMINGwp.me/p1DRwF-332
That doesn’t look good with the SKEW index at its highest level in a year. Should signal a hefty correction coming. pic.twitter.com/h7NvTrVBIP

Mike Burk Conclusion Sep low had a successful retest of the Aug low. Unlikely market will fall below Aug & Sep lows
Mike Burk The negatives The major indices are up 7% – 8% in the past 2 weeks; the market is overbought.
Mike Burk The good news is: Last week new lows disappeared and new highs began accumulating.


LONG TERM = SELL ALL ON THIS RALLY OR SWITCH TO SHORT TERM TACTICS UNTIL FURTHER NOTICE SHORT TERM = BOTTOM ON 10/2wp.me/p1DRwF-332
Resistance at top of current W formation (2020), congestion area earlier this year, & peak just before Oct decline pic.twitter.com/X4bdlEGcHx

All morning as we waited for the FED minutes, SPX and DJI are up while NASDAQ has been down (????)
Lowry’s The most frequent months for rallies to start are October and March
US debt doesn’t have much allure for foreign investors. If the world won’t buy our debt, who do we sell it to??? pic.twitter.com/PU9eRgKCYq

Dana Lyons SENTIMENT Assets in bearish Rydex mutual funds hit the highest level in over 3 years…AFTER a 100-point rally in the S&P 500.
Jeff Saut Investors should wait for the middle peak of the W-shaped bottom at 2020 on the SPX to be surmounted before becoming more bullish
Same Fibonacci radial is resisting penetration pic.twitter.com/op1yGktiZn

But other times, my art isn’t worth the paper it’s printed on.
And sometimes, it’s a gut call where art, helps you make the call. I think only decades of experience can possibly give you this ability.
Sometimes other factors help you make the distinguishtion in wave counts. Some times it’s simple because there is only one possibility

It’s difficult to determine whether we are in this step count pic.twitter.com/0YuynoRc69

LONG TERM = BEARS SHOULD SWITCH TO SHORT TERM TACTICS OR OUT ON THIS RALLY SHORT TERM = BOTTOM CONFIRMATION ON 10/2wp.me/p1DRwF-332
SP futures had sideways correction & NASDAQ showed normal correction. It’s either a 5 step correction, or more upside pic.twitpic.twitter.com/tPW9Dd6N8X


At the moment, the NASDAQ is slightly weaker than the DJI and SP500 and showing signs of a beginning correction pic.twitter.com/maZPpO47WM

Fibonacci radials for SPX, market take a breath here ? pic.twitter.com/poBzDRlwlq


What are corporate profit margins telling us? Nothing good, according to Barclays analysts bloom.bg/1WHWzuc pic.twitter.com/WRyQMmOaNQ

@MikeHren Read the following and it will help explain a lot stock-market-observations.com/2011/07/02/odd…
If the cyan count is correct, there will be a step 5 down. But if cyan 3 was the end, we will continue to rally pic.twitter.com/yHI2DLDPhV

@focus1234567 Some point must represent end of step 1 down in the bear market. This seems like a good point, possibly right, possibly wrong
Mike Burk The persistence of high levels of new lows during last weeks rally leads me to believe it is, or was just a bear market rally.

This looks like it has the best price projection of the 3 I posted today. pic.twitter.com/CjbgLqQAmV

Step 3 will probably have 3 very distinct steps within its rally, almost like steps 1 and 2 earlier didn’t exist. pic.twitter.com/nlHL8zLywK

LONG TERM = BEARISH DOESN’T MEAN YOU CAN’T MAKE MONEY SHORT TERM = CONFIRMATION OF BOTTOM PROBABLY OCCURRED ON 10/2 wp.me/p1DRwF-332
Dana Lyons Average retest period following crashes similar to August have bottomed an average of 27 days after the crash…that would be today

If we don’t surpass peak of 9/16/15, more trouble lies ahead
A forecast for a future peak, we’ll wait and see how things go for awhile though pic.twitter.com/Hk0g4bq40j

NASDAQ is stronger than the DJI or SP, it made new high before correction. The others stopped short of the morn high pic.twitter.com/vW4dNyugfQ

If I don’t post anything, it’s probable that I’m waiting for something (a confirmation) to take place.
Patience is something that you have to learn from the market. I never had it when I was younger, but I learned it was necessary.
If you have established a speculative long position, this is where you sit and wait for the market to prove you right or wrong.
We’ve got to see higher highs. A high above the one on 9/16/15 pic.twitter.com/YKlrjhsYn0

Only the DJ Ind show a CLEAR 3 step down since 9/30/15. Did this represent a successful retest of the bottom??? pic.twitter.com/AOmhaHkil0

How the market reacts to news is always important to market direction. The market could have continued falling all day on this news & didn’t
Bad news today, but the market is climbing back from its initial plunge. Would be encouraging, market closed positive pic.twitter.com/BRIAlBsfOi

A longer term view of the presumed wave count pic.twitter.com/FpMgoZBuQC

This is the presumed correct wave count. pic.twitter.com/7l11IaDhIr

An alternate wave count that allows for higher highs. This count could be valid because of the high number of bears pic.twitter.com/Jv83tq9xlU

Sep 2015 – 89 TWEETS
The SKEW index fell today moving it into a comfortable range for a rally to continue pic.twitter.com/kMpUNxWS49

LONG TERM = BEARISH OUTLOOK FOR NEXT YEAR, OR LONGER SHORT TERM = WATCHING/WAITING FOR CONFIRMATION OF A BOTTOM wp.me/p1DRwF-332
Was that a successful retest of the panic bottom? The count is right, but we’ll know for sure with higher highs pic.twitter.com/pI5ZWQlqMp

LONG TERM = BEARISH OUTLOOK FOR NEXT YEAR, OR LONGER SHORT TERM = WATCHING/WAITING FOR A BOTTOM IN STEP 1 DOWNwp.me/p1DRwF-332
Bulls are down, but bears don’t look like they’ve capitulated by rising to a higher level. It’s all relative though!! pic.twitter.com/IQdLIZrBr4


Aug 24 low is support(??) Some indexes have already penetrated. It’s HOW the market acts after/if SP500 penetration pic.twitter.com/WMmmpwGFOQ

Wave count for NASDAQ. Step 3 marked the bang and now we wait for the whimper. But if we’re going down in 4 & 5 . . . pic.twitter.com/1G6838526U


Another Fibonacci price projection based on 2009 pic.twitter.com/W0K4sR6faY

Fibonacci price projection based on 2009 pic.twitter.com/1lNIjngoFa

Haven’t shown this chart in recent weeks pic.twitter.com/q4gIZFjCpe

Dow Industrials are down about 23% of advance since 2009 pic.twitter.com/UE3dc7U5rk


#2 Continuation of pitchfork in prior tweet pic.twitter.com/u0Bv6isk92

#1 Pitchfork points in early part of bull market pic.twitter.com/YTxzSI8yFl


Spell check plus not proof reading my tweets closely is causing havoc with me today. I gotta an excuse, I’m old
Market declines end with a bang or a whimper. We’ve had the bang & now we could see a whimper Whimper would consist of aimless action days


Monday was a 90% down day, 90% declining stocks and 90% declining volume. pic.twitter.com/eVMg7dp5qR

BEAR MARKET DOESN’T PRECLUDE NEW HIGHS Not saying it’s going to take place, but we could rally & have TOKEN new highs in a step 4 & 5.
LONG TERM = BEAR MARKET DOESN’T PRECLUDE NEW HIGHS SHORT TERM = AT SOME POINT WE SHOULD SEE A RETURN TO OLD HIGHSwp.me/p1DRwF-332
Interesting chart on market count. If valid, it could set up biggest rally since market peak. pic.twitter.com/ioiOYqfrPV

@focus1234567 Nice to be back, but need to rest from vacation. Gonna do nuthin’ but watch DVR for while. Trees blocked satellite reception
Lotsa analysis needed to figure out the count.
SKEW index is still high & usually means more downside, hard to reconcile that with the need to rally pic.twitter.com/pLz1DnNS1V

Price is on the edge of the envelope, which could be a rebound area. Market is oversold & could rally pic.twitter.com/Imwu74oKqf


Been on the run for 28 days & 4700 miles. Glad nothing happened in the market while I was gone. Gonna take a while to get me up to speed
There should be no doubt in anyone’s mind that the market ended step 3 up in late June 2015. What are the market’s possible scenarios?
SKEW index is volatile & spending lotsa time at high levels. High SKEW reading is indication of a likely correction. pic.twitter.com/xK4BMcMOkP

Jeff Saut There has been only one false Dow Theory signal in the last 18 years, at least by my method of interpreting Dow Theory.
Jeff Saut We are trying to stay constructive, but the negative evidence is mounting
LONG TERM = SELL RALLIES, RALLIES APPROACHING HIGHS SHORT TERM = BEAR MARKET LIKELY AFTER RALLIES HAVE NO MONEY LEFTwp.me/p1DRwF-332
I’m one of those narrow minded nuts that never got on board with globalism. I don’t like exporting the USA’s wealth to the rest of the world
FTSE & DAX have lower highs. This is looking like a world-wide phenomenon. The world is in sync & I don’t like that!! pic.twitter.com/bEXE7kCBDy

Notice how the recent high was turned back by the lower pitchfork resistance line pic.twitter.com/OKJv3MpHxB

Really need to see my Sierra Charts (black background). I’ll see if I can update them tonight and post a couple?????
Closing break of SP500 @ 1914 MIGHT challenge panic low. SIGNIFICANT closing panic low break “might” be bear confirm pic.twitter.com/HTZbAzCTTY

I see 3 steps up in latest rally, looking like it finished 2 larger steps up. Watch for closing break of SP500 @ 1914 pic.twitter.com/TfiL16EPVC

John Murphy WITH SHORT-TERM BOUNCE ENDING, A RETEST OF SUMMER LOW APPEARS LIKELY, THIS WILL HELP DETERMINE IF THIS IS A CORRECTION OR BEAR
John Murphy FED INACTION BOOSTS BONDS AND SAFE HAVEN ASSETS WHILE HURTING STOCKS
Mike Burk The negatives Market has been following average seasonal pattern quite closely and that pattern has been down for the next 2 weeks
Mike Burke The good news is: The secondaries continued to outperform the blue chips. Yup, that is good news Bob
Important lower lows, not little ones within a small correction. Gotta run, creeps with straitjackets discovered my hideout. Woe is me
Nice rally though, but I hope that isn’t the end of 3rd step up. Gotta watch for an unusual retracement or lower lows pic.twitter.com/tJgDxeqTqt

I’m still on the run, those dastardly guys in white coats haven’t caught me. I ain’t goin’ back to the joint. They’ll never take me alive
Mike Burke Conclusion New lows have declined, but haven’t disappeared as typically do coming off bottom making me suspicious of recent rally
@wekim77 duhhhhhhh . . . They have me on low oxygen & it’s hard to think of my name or anything else. Mean bastards will resort to anything
Going back into the land of no signals, so hang tough. Poor Bob
Here come the guys with the straitjacket to put me away. Gotta run & make good on my escape Tune in to see what happens to poor Bob next!!!
My long term outlook is still the same. That picture HAD been developing for a long time & is only subject to tweaking. Like extensions 😦
I’m living in a dungeon & my signal is non-existent for long periods. I’ll yak when the guards permit me (between shock treatments) 😉 LOL
Tactic 1 sell the rallies, Tactic 2 wait for new highs, could be weaker steps 4 & 5 from 2011. Whichever tastes better is the best pathway
Higher lows dominate the picture & higher highs look to be in store. pic.twitter.com/Pl8jEDakQ4

The Skew is in a high zone that precedes market declines. Fast run up on the Skew, looking like last Oct run upward pic.twitter.com/CcCNfNzXOf

Investors Intelligence bulls at lowest level since 3/2009. VERY bullish situation & gives credence to a rally back to old highs (or more).
Ryan Detrick “Lately though, when the first day of any month drops big, the rest of the month soars back up 6% on average” ??????
Ryan Detrick “Sep is weakest month going back to 1928. I found when 1st day drops 2%+ (like it did), rest of month tends to be very weak”
Gary Kaltbaum: “It is quite noteworthy that markets cannot get a head of steam considering the oversold condition.”
My scenario is a successful retest of panic Monday low, followed by rally to old highs. Failure to make a new high, market rolls over & dies
LONG TERM = SELL RALLIES & ANY RALLY APPROACHING OLD HIGHS SHORT TERM = BOTTOM #1, RETEST LIKELY, BEAR MARKET COMINGwp.me/p1DRwF-332
Mike Burke . . . We may be in for a real bear market and not a short term correction. OVERALL Bob agrees with Mike Burke
Mike Burke Conclusion Markets lack of responsiveness to sharp decrease in new lows leads me to think . . .
Mike Burke: . . . but that appears not to be the case this time.
Mike Burke: The negatives Over the past 2 weeks new lows have practically disappeared. This usually indicates a bottom for prices,
Mike Burke: The good news is: · Hard to find.
No lower low today, so it “could” be an uncomplicated double bottom . . . But things happen. More rally seems likely. pic.twitter.com/65M4BtFA71

Lotsa red in the world stock markets today, so this not a localized phenomena pic.twitter.com/y75qaYN5co

My long term prognosis is unchanging and is my guiding observation. It’s the “or worse” part of long term that I worry about.
Wish could post charts to explain things clearly, but that isn’t possible at the moment. Damn!!! See my charts on StockCharts listed in bio
Remember how retest goes, they can be the same, higher or even lower than initial low. Worst case scenario is we’re in a larger step down!!!
Looks like a retest of panic low is in progress. Step 2 down of 3 steps down, but until we break low of 4 days ago, step 2 isn’t verified
Projection chart have a common level at 1985 (purple and yellow). We’ll see if it’s meaningful.
Good night and good luck . . . ERM and Bob
Fibonacci projection levels, purple are downside that are still providing resistance, yellow is upside projections pic.twitter.com/AXF3pdzQNK

“Good night and good luck”. – Edward R. Murrow and Bob
Gotta weak signal, hopefully tomorrow will yield stronger signals to do constructive things. Lack of communication DOESN’T CHANGE my outlook
Need a Fibonacci projection chart for this rally. I’m writing this on my iPad & it can’t do stuff like that. Need Sierra Charts on MacBook
Nice well contained decline & blasted off into step 2 today. This is all part of the rally back towards the highs. pic.twitter.com/gTeIMjE7gl

Had 3 steps up since low near yesterday’s close. Declining presently & we’ll see what it’s going to do on decline pic.twitter.com/Fah68Eow1g

Maybe in 4th step presently, have to wait for a bounce or a decline to tell us more pic.twitter.com/rGWITIoVrI

Sometimes all the fun is in step 3, which is exactly what happened beginning yesterday after the close.
Aug 2015 – 507 TWEETS
Starting Tue, likely fewer tweets for Sept. Will anyone notice?? If dramatic events take place & I don’t comment, it’s cuz I lost my signal
LOTS of chatter on Twitter from smart stock market guys that are dwelling on China. I think R problems are broader & more complex than that

How A Real Plunge Protection Team Works—–China Rolls Out The Paddy Wagons, Snatches 200 Rumor-Mongers davidstockmanscontracorner.com/how-a-real-plu…
Said before that Jeff Saut is a strategist that I pay attention to. When we disagree, it’s minor, or the disagreement doesn’t last long.
Jeff Saut is ignoring Dow Theory sell signal for now. He’s playing rally back to old highs, or beyond. He is still VERY leery of more lows
When I see LARGE 3 completed (since 2009), I get very wary of the future. Sub-stepping can always throw a money wrench into the pile though.
Market could still trace out a 4 & 5 up this year before the real decline begins, but I don’t HOPE for things like that. I play risk reward.
I regret not calling heavier reductions of long term positions at the May peak. I only said sell underperforming stocks. Hindsight is 20-20
SP500 futures down -28 points tonight & DJ Ind down -210. Another gap opening unless things turnaround.
Can’t discount the “possibility” that a retest could be underway. Gotta be swift to take advantage, or avoid problems pic.twitter.com/DRecn8Ldlb

3rd step down is obviously underway, if we don’t have any sub-divisions, should be over in a reasonable time period pic.twitter.com/vdlnrxrvjP

LONG TERM = SELL . . . RALLY “ON APPROACH” TOWARDS OLD HIGHS SHORT TERM = VERIFIED BOTTOM, RETEST POSSIBLE, OR WORSEwp.me/p1DRwF-332
My blog tells you all about my wave counting voodoo (& other things that aren’t voodoo). Blog is not updated anymore. pic.twitter.com/pXEZODaHYi

Each wave count was contained in a defined channel, or slope. Each break denoted another wave, or end of decline pic.twitter.com/xGwldWoP9u

Lotsa sub-divisons in this chart, but it’s well contained close to the rally peak pic.twitter.com/qCcimdMPsr

“IF” white 3 is finished on downside meaning no sub-divisions are going to take place, we are in store for more rally pic.twitter.com/nDciD2CF5K

LONG TERM = SELL – RALLY ON APPROACH NEAR OLD HIGHS SHORT TERM = VERIFIED BOTTOM LIKELY, BUT RETEST STILL POSSIBLEwp.me/p1DRwF-332
Is this 2 steps down? It looks like it & might be rolling over into step 3 down? It’s a reasonable correction so far? pic.twitter.com/s0MqAtmAY7

Fibonacci projection lines are working well. These were downside lines, but are working just as well on the upside pic.twitter.com/viMtUB7G3C

If don’t reverse before tomorrow’s opening, we’re going to have another gap open. Last Monday had a bad first 15 minutes (down 1000+ points)
SP500 futures down -26 tonight & -211 D Ind. Multi-step down since peak on 27th. Probably in 2nd step down since 9/27 pic.twitter.com/XO3n92qepA

The entire Mike Burke update for 8/29/15 …arketobservations.files.wordpress.com/2015/08/mike-b…
Mike Burke Intervention on Mon & selling stopped, weakness needs to resolve itself, takes longer than if the market was allowed to crash
Mike Burke All of major indices positive for week, not led by the small caps or accompanied by a significant increase in number of new highs
Mike Burke 336 new lows on NYSE Mon, 41% of issues traded & 772 on NASDAQ, 26% of issues traded. Retest follows numbers of this size.
Mike Burke The good news is: · New lows disappeared at the end of last week.
A good article by Martin Pring (author of many good stock market books). BP% of SPX can be found on my StockCharts …arketobservations.files.wordpress.com/2015/08/martin…
90% down day on Mon & then almost had a 90% up day on Thursday. Advancing issues were 87% & up volume was 96% on Thu pic.twitter.com/5OZj8AfeJM

Markets gonna keep it a secret as to whats next. After a 3 step down late today, did a FAST rally to below prior high pic.twitter.com/4upoKNDqOz

More upside before a retest of Monday bottom. A POWER thrust thru Mon low with volume & not stopping is bad voodoo wp.me/a1DRwF-2Le
Waiting for lower low, or possibly higher highs. I guess not many want to hold open positions over the weekend. pic.twitter.com/yFfUaSWugX

Duhhhh, some day I’ll learn . . . but I’m old, I have reasons to be stupid Read all of Tom McClellan post …arketobservations.files.wordpress.com/2015/08/10.pdf
#8 and going to live in a commune. A bear market does not depend on the ultimate magnitude, but rather upon the attitude it creates.
#7 market is when most stocks do poorly, even the most deserving ones. It hurts everyone. It gets people talking about giving up investing
#6 A bear market is nearly the same, except that there are lower highs and lower lows for a protracted period over several months. A bear
#5 higher highs & higher lows on an intraday chart, but that does not make it a bull market. There needs to be persistence for a long time.
#4 prices make higher highs and higher lows. A bull market should be thought of as lasting over several months at least. You can see
#3 A bull market is when the major averages are in an uptrend, and most stocks are doing well. An uptrend is defined as a period when
#2 McClellan It is among the most meaningless, useless, and untrue statements out there. I agree COMPLETELY with Tom. BETTER DEFINITIONS
#1 Tom McClellan I’m starting personal crusade to expunge notion of “10% is a correction & 20% is a bear market” from our collective lexicon
China A shares were up 10.3% today. A serious rally after having declines of similar magnitude. H shares (less volatile) were up 1.8%
End of 3rd step mentioned earlier, had immediate correction & rebound to new highs. We MIGHT still be in 2nd step up? pic.twitter.com/Cd4bTe66iy

It’s possible we may be ending 2nd step up since 8/25. I can see 3 steps since 8/26 which encompasses all of 2nd step pic.twitter.com/oZCR0sXEF3

Since rally began on 8/25, appears that we are 2nd step up, which will be followed by a correction & then step 3 up pic.twitter.com/awquCWkWdd

Jeff Saut looking for move no higher than 1970-2000 SPX. We are in that zone presently. He looks for a retest after this move up is finished
Soon I will write fewer tweets as I’m going to be busy doing other things for awhile. I should be doing at least 1 tweet per day.
Good night John Boy. (Weird . . . told you my mind works differently) As Bob says good night too. It’s only 12:30 AM on west coast
Successful retests usually accompanied by strong move up on high volume. Retests 1st few days after initial bottom are part of reflex rally
Retests of prior lows can end at the same level as the first bottom, OR at a level HIGHER or LOWER than the first bottom.
#2 John Murphy That assumes of course that this is a market correction, and not the start of a major bear market.
#1 John Murphy Any bottoming process this year could last at least a month or two and will most likely include a retest of recent lows.
Last time McClellan oscillator was this deeply oversold was May 2012
China A shares are up 3.25% tonight. A shares are the most volatile. The H shares are up 2.65% tonight.
If don’t understand how I count the steps in the market, read the explanation found at this link. stock-market-observations.com/2011/07/02/odd…
SP futures are back at the overhead resistance level that has turned the SP futures back two previous times. pic.twitter.com/wvZYmwBcy5

It’s Bernard Baruch, not “Bernad Baruck” One of the smart guys of a by-gone era. Sold early in 1929 & went to Europe. Missed crash of 1929.
Missed calling top correctly in 2007, called it early instead of Oct 2007. Vowed not to make that mistake again, so I waited & waited . . .
I shoulda done this . . . but didn’t Shoulda called a top in the market many weeks ago as I was becoming wary & urged long term liquidation
After large step 3 since 2009 completed 1) rally into tepid steps 4 & 5 up 2) decline in 3 steps down (30%) 3) decline in bear market (60%)
Another less agreeable guess Rally awhile & then decline past the recent lows The tone of the market has now changed since step 3 completed
Another guess Rally & make token new highs & then decline. We could repeat this two times, making token new highs (steps 4 and 5 since 2009)
Best guess Build some kind of base and then rally toward old highs, but fall short, roll over into a larger step 2 down.
But I’m not Baruch, so I’ll hazard a guess. We’re going to stay in the “general” area of the low before mounting an attempt at higher highs
Yeah, yeah, yakety yak, yadda yadda yadda . . . enough. What’s next? As Bernad Baruck said so eloquently many years ago, “it will fluctuate”
Fibonacci retracement since 2009 has stopped at 23.6% and on one of the upward trend lines based on 2009 bottoms. pic.twitter.com/OMNiIB3pk9

We had a strong close on EVERYTHING today.
Dow Theory sell means investors have to be careful until next buy signal is given. Buy signal doesn’t occur for several thousand points up
Dow Ind & Trn showing violating their closing October lows. giving a Dow Theory sell signal pic.twitpic.twitter.com/6crVNQKy6e


SPX almost inside the envelope which defines normal behavior. A few indexes are already inside their envelope pic.twitter.com/09LDqE3Vwh

All 4 of these indexes show inside days (yellow) for the last 2 days, SPX, DJ Ind, NASDAQ Composite, NYSE Index pic.twitpic.twitpic.twitpic.twitter.com/jE12xyuhrB


Russell mid cap showing good wave count. It’s difficult to find consensus wave count. Some indexes show 4 steps down pic.twitter.com/D0mQv7SMRn

Busy all day baby sitting the RV at the repair shop
LONG TERM = SELL RALLY ON APPROACH NEAR OLD HIGHS SHORT TERM = VERIFIED BOTTOM LIKELY, BUT RETEST STILL POSSIBLEwp.me/p1DRwF-332
John Murphy favorite, above zero line is a bull market, below zero line is bear market, could be a fake out like 2011 pic.twitter.com/rpcqEBpwXk

5 day Trin is showing a very oversold reading pic.twitter.com/9qKUArcJwj

SP futures made lower low after the close, close is 13:00 on this chart, if it continues doesn’t bode well tomorrow pic.twitter.com/P0MExvzB7L

SPX made a lower closing low today than yesterday’s close pic.twitter.com/6mZun309ql

Russell 2000 (RUT) made a lower low today. Everything else closed weak. pic.twitter.com/ffRF57wPt4

Earlier called this step 2 up, looks like the 3 bumps since the low were the 3 steps up. Retest, or worse in progress pic.twitter.com/qLbggkdNQG

Purple Fibonacci radial step 1 down in May, Yellow Fibonacci radial step 2 down in Jul/Aug Converged on yesterday low pic.twitter.com/XD35s7nnqW

New Pitchfork, too steep to last very long, but it’s probably in force until broken pic.twitter.com/vxrfmXWC1i


If we make up our mind about what happens next, it is impossible to keep our ego at bay if the market goes the other way. Kills flexibility
After Oct penetration of envelope, buying panic took place to all-time highs, a buying panic now would be a surprise pic.twitter.com/Qd5paulPno

Well . . . I’ve beat the high frequency traders to death, so I’ll get off my soap box
Restrictions on high frequency traders won’t happen until LARGE event occurs, can’t expect the SEC to be on the ball pic.twitter.com/ooo3JOvOxW

Gotta put restrictions of some type on high frequency traders so they can’t make declines worst than otherwise pic.twitter.com/n0cMfkxm8L

High frequency traders fault, not useful, provide liquidity yes – until a downdraft occurs then exacerbate declines pic.twitter.com/XHnIGabMQ2

No 2008 envelope penetrations were as large, so this was an unusual event pic.twitter.com/tUdcvjN84T

Last penetration of extreme size was after 9/11 when markets reopened after being closed. 9/11 was a larger % down pic.twitter.com/fPrw2kjgfc

Extreme penetration of envelope that keeps normal fluctuations within envelope, penetration means rally is coming pic.twitter.com/XFSsz40kti

ADX is still in the buy range after being in an extreme yesterday morning pic.twitter.com/hbCnDTbUBZ

Short sale restrictions in effect for Apple. Usually means they can’t find enough stock to fill all the short sales pic.twitter.com/WsakIq5rLz

Dow Jones Industrials and Transports have been among the weakest indexes. Only a few indexes broke the Oct 2014 lows.
None of the Russell indexes penetrated the Oct 2014 low, large cap, mid cap, small cap, micro cap pic.twitpic.twitpic.twitpic.twitter.com/yKuf3kOMwW


LONG TERM = SELL RALLY TO OLD HIGHS OR WHEN COMFORTABLE SHORT TERM = IS CRASH OVER, NOT UNTIL SEE A VERIFIED BOTTOMwp.me/p1DRwF-332

Declines raise money that propels the next big rally and this is sustainable & good. The bull run since 2012 simply ran out of money
Very bearish scenario Worst case scenario is for a large step 3 down counting from the peak in 2000, step 1 ended 2003, step 2 ended 2009
My scenario is for a 30% correction over many months, then rally vigorously to much higher highs in step 4 counting from 2009.
I don’t favor bullish outlook, that doesn’t preclude the possibility that we couldn’t get token new highs in steps 4 & 5 counting from 2009
Bull Outlook 1) Market works its way higher to new all-time highs in unimpressive manner 2) Market moves vigorously higher to new highs
Bearish outlook? 1) rally falls short of old highs, this decline becomes step 1 down in larger bear market 2) continue down in steps 4 & 5
Wave count since May peak with 3 steps down completed pic.twitter.com/D0mNGnSHVu

Since yesterday’s opening low, traced out a quick step 1 up, plodding ahead in 2 steps up in larger step 2 pic.twitter.com/tlM7JZp9Dd

China’s A shares (most volatile) are flat today with a small move up (.25%).
Bloomberg: China to Halt Stock-Market Support Amid Intervention Debate
More days rally before we retest adds validity to the retest. Since we have 3 steps up since 2009, seems that a larger correction is likely
After a 90% down day (today), we frequently rally for several days and that appears to be the schedule for now.
China A shares are up 4.1% tonight, & our markets are in rally mode, so the crash is over for tonight.
Everything is on sale. Everything must go, closing out all of our inventory. Come on down and we’ll make you a deal. pic.twitter.com/70KYMYvZge

@wekim77 It’s only step 1 down, lots of zigs and zags along the way. My big fear is always the 1929 crash where it never stops to rally
Very low reading for today, but look at 10 and 20 day readings. Nobody is buying calls. Big time bearish feelings pic.twitter.com/MKgGVAF2Lg

I like the visual for how some feel presently, shorts are pretty happy, but they are a skittish bunch right now pic.twitter.com/waIngsOEd6


Unless it’s a fake-out, we have a sell signal on the penetration of this line today. pic.twitter.com/2B8tEAEEvT


China A shares were down 13% last night. That’s significant.
How the world went today, in order from highest % losers to % winners pic.twitter.com/lkZPHBkBJp

@Stock_Trend_Chg NO AND HELL NO
LONG TERM = SELL UPCOMING RALLY OR WHEN COMFORTABLE SHORT TERM = IS CRASH OVER??? NOT UNTIL WE SEE A VERIFIED BOTTOM wp.me/p1DRwF-332
#3 Any account not in margin compliance will, as always, become subject to broker initiated liquidation.
#2 Please monitor your accounts accordingly to ensure margin compliance.
#1 In light of the notable volatility in global markets, we are temporarily suspending intra-day margin release.
Market keeps plugging along to the downside, we’ll see what happens when we arrive at opening low for this morning pic.twitter.com/FKRAW53NY6

There it is, A DOW THEORY SELL SIGNAL We should rally soon (???) and long term will liquidate holdings on the rally pic.twitter.com/v6QYm0SuMt

Deflation is upon us & that’s a really nasty word. Deflation scares the crap out of the FED. They don’t tolerate it!! pic.twitter.com/T2d0q5VmI1

Makes me feel little better as rally began at conclusion of 3rd step of a larger 3rd step. Is this going to be called a successful retest???
I really don’t want to close on the lows of the day, that wouldn’t feel good. But if so, we might hear the FED say something comforting ????
In the 1987 black Monday, we lost the equivalent of today’s loss of -3500 points.
The count on a daily chart shows we’re in 3rd step. As long as we don’t get 5 steps in this last step, all will be OK pic.twitter.com/XFi75beTUz

A crash is over when all the sellers have sold that are going to sell – a sold out market. All that is left are buyers and short covering.
DJ Ind consecutive losses Tue -34 Wed -163 Thu -357 Fri -531 Mon approx -700 Is crash over? Or is tomorrow a bigger down day than -700 ????
Heading straight for that Dow Theory sell signal today. pic.twitter.com/dMu4YH43Ob

The VIX numbers are always highest at the bottom, or at the finish of a panic bottom, panic bottoms are frequently retraced later
VIX fear index is out of its mind with fear, biggest numbers since 2011 when fear of another recession was rampant pic.twitter.com/oJKVBw2MWE

The advancing issues & advancing volume are so lopsided towards selling, that today is a full scale capitulation day. pic.twitter.com/Xvxeilaf5k

90% down day in advancing issues and advancing volume. Normally after a 90% day, there is a 3-7 day rally. pic.twitter.com/493ps7UQbu

A look at the spooky cycle chart & the red line has a good record of buy/sell signals. It’s now operating on a sell pic.twitter.com/JvKberuXCO

The count on the DJ Transports looks incomplete on the downside . . . hmmmmm
DJ Transports are still below Oct low and are on the low of the day and show no inclination to rally. pic.twitter.com/GGpZFXB4SD

Russell 2000 shows 3 steps down since Aug 18th. If valid, a 3rd step in larger caps could just be a bottoming step pic.twitter.com/Du1mnkvy88

If we are declining in purple step 3, this “may” set up good buy point for upcoming rally. If true, we also will likely get Dow signal today
Wave count since July peak. Purple 3, I see 2 steps down, which means we are probably declining in 3rd step presently pic.twitter.com/iWVmhswND5

Worst case scenario – This is step 1 down of a LARGER decline that will last many months Best case scenario – New all-time highs await us
Larger questions are (1) will we get Dow Theory sell signal today closing below DJ 16,117 (2) if not, will we make new highs on future rally
So far it has been a V bottom with 2 steps up. We are correcting presently & are in 2nd step down of the correction pic.twitter.com/4lvN0LYVkl

SP futures fell -12% from intraday peak to intraday bottom. DJ futures fell -16% (ditto) Dow has been weakest of all the large cap averages
Last Oct 2014 was a V bottom and there was no playing around the bottom before the rally began. I suspect this won’t be the same as Oct’s V
If the wave count is complete, there should be some up and down action around this bottom before it grinds out a rally towards the old highs
This is the wave count in the SP futures since the May peak to today. It appears to be a completed (??) 5 wave down pic.twitter.com/bID7nCh6Wc

Will the market close lower than presently and give us a Dow Theory sell signal??? Stay tuned and we’ll see.
I guess we can classify -1200 DJ Ind points overnight as a crash, one that didn’t carry through cuz we’re ONLY down -214 points at moment
First 2 minutes of trading, DJ Ind fell -330 points, finishing off -1200 point decline for the night. Lottsa fun & no Dow Theory signal yet
1987 crash broke prior lows & was end of quickie bear market, DJ Ind was 2750 intraday & 1600 intraday, % drop 42%, 2 month total decline
REPEATING Dow Theory Sell Figures Must Close Lower Than: DJ Ind Oct 2014 closing low = 16,117.24 DJ Trn Oct 2014 closing low = 7,717.69
The 2007 Dow Theory sell signal broke prior low by a small amount & then rallied back towards old high and failed. pic.twitter.com/08zDaRUjoF

The Fibonacci chart levels tweeted earlier are providing support points, meaning temporary hesitation support levels pic.twitter.com/vy1igdCe2c

Dow Theory operates on closing figures. Its where we close tomorrow. If we’re down -1,000 points, it’s safe bet we will bust Oct close low
DJ Ind are down -450 points (2.7%). Are we having fun yet??? China A shares are down -8.2% tonight. When does China govt. support start???
A new Fibonacci projection since old ones keep getting blown out. This one has some valid support & resistance levels pic.twitter.com/xDt8cdWrZl

China is MAJOR buyer of US debt, if China is going into difficult times, who is going to buy our debt cuz we aren’t gonna balance our budget
DJ Ind futures are down more than -354 points tonight, they were down -380 & now rallying a bit.
A loss of -354 DJ Ind points in the futures tonight would break closing Oct low. A close below that level would be half of a sell signal
WSJ China’s losses sending markets tumbling, fears about deepening effects of slowdown in the world’s #2 economy rattled investors worldwide
Still looking for a much needed rally. Rallies are more fun, but crashes can be very profitable if you’re on the right side of them.
ES 1950 to 1952 area holds until it doesn’t want to hold anymore & then it crumbles. I only had 1 contract, so minimal damage.
World trading tonight is decidedly down. China A shares are down almost 7%. H shares are down almost 5%. pic.twitter.com/k5bUX12EJR

Bought with a close stop to my purchase price. Very short term trade. The ES 1952 area want’s to hold for now Only crazy people do this
One interpretation of the count. An ALTERNATE is that step 4 is sub-stepping & is not complete, & 5 hasn’t begun yet pic.twitter.com/arjc6ROFAU

SP500 futures bounced twice off of 1950 level and headed at it for a 3rd time. Still in the ball park for 1952 Fibonacci
Down 11 on the open to 1961. The next Fibonacci level is 1952. We’ll what see happens???
If prior Fibonacci projection tweet fails, the next Fibonacci projection levels are in this chart. pic.twitter.com/sXFfNT7qew

Fibonacci projection of 261% from step 1 to the recent low. pic.twitter.com/ArXFC04729

I like market history & that’s the main reason why I post articles like the 1987 crash. Crashes like 1987 only happen ONCE in a lifetime
Fibonacci projected level to the top of step 3 is 161.8% of step 1. This is another validation of the recent May peak pic.twitter.com/yMW80siBuu

Black Monday – Oct 19, 1987 stock-market-observations.com/2015/08/23/bla… pic.twitter.com/wGmImLR1GF

Ever wonder why the stock market does crazy things? Read the article by Edson Gould at the following link. stock-market-observations.com/2015/08/22/my-…
My Most Important Discovery (193?) by Edson Gould stock-market-observations.com/2015/08/22/my-… pic.twitter.com/utVNhY4xz1

For those who weren’t there, here’s the month of October 1987. Too bad I don’t have the hourly chart for crash day pic.twitter.com/EuKBa1wXWk

Jeff Saut was quick on his feet and called the final Oct 2011 plunge, an “undercut” low, which he advised buying into the low
In 2011, the last plunge to final low surprised me, & brought lotsa bears out of woodwork. I was flummoxed by it, until the quick reversal


Mike Burke: Conclusion No sign of a bottom, but I expect Fed to intervene Bob If the FED is static, other forces will come into play + or –
Mike Burke says: The negatives Friday, NYSE 627 new lows (19% of issues traded) & 345 (12%) on the NASDAQ. These are bear market numbers.

Mike Burke says: The good news is – · The Federal Reserve Bank (Fed) is likely to intervene to prop up the market early next week.
LONG TERM = ON DOW THEORY SIGNAL, SELL FOLLOWING RALLY SHORT TERM = IS A RALLY, BOTTOM OR CRASH COMING?? WAIT AWHILE wp.me/p1DRwF-332
Fibonacci radials & most recent wave count from the July peak. In “4 of 2” is very unlikely, it’s just a “what-if” pic.twitter.com/Hv5cD0ygnd

Penetration of envelope in 10/2014 & DEEP penetration today. This is unusual, “possibly” marks end of the panic phase pic.twitter.com/TkvRsLJvWr

Notice how far outside of envelope DJ Ind penetrated in Oct 2008. It pulled back inside and stayed there until 3/2009 pic.twitter.com/GqP9QDXILD

And a Fibonacci radial stopped today’s decline. pic.twitter.com/Wc7hCD0Wjd

Gary Kaltbaum Good The market is closed Bad Market continues to deteriorate Market continues to deteriorate Market continues to deteriorate
Bears out of hiding in droves BRETT ARENDS – Opinion: Dow 5,000? Yes, it could happen. Naturally Pretcher is predicting a far worst target

Art Cashin speaking about the 1987 crash and watching the China market on Sun evening and Monday. pic.twitter.com/GeoMTA7XWa

Is the stock market going to be the evening news lead story tonight??? Someone said fear was greatest since March 2009. That’s a good sign
Dow down over 500 points today, that’s 3.1% decline pic.twitter.com/Ww6PaHg9U2


Stopping at Dec lows looks like a reasonable place to rally, but that’s not buy signal cuz only crazy people do that pic.twitter.com/uz3fqc4Cgy

The DJ Industrials are about 370 points from the Oct closing low. Today, the Ind & Trn didn’t violate their Oct lows. So no Dow Theory Sell
And today, we stopped right on the Fibonacci projection level, which is really close to Oct 2014 closing low pic.twitter.com/OdinjtPHgY

McClellan Oscillator is oversold, but not as oversold as we saw back in Aug, Sep & Dec 2014 Shorter term oscillators pic.twitter.com/QAjSlXFpaQ

All indicators on this chart are oversold . . . by a significant margin These are long term oscillators pic.twitter.com/A7wuNn7DrH


Likely we will bounce soon, if no bounce takes place soon, then think crash
Not that we are going to have a 1987 crash, but the preceding chart illustrates what a once in a lifetime crash really looks like.
During the 1987 crash, each day was worse than the preceding day. We thought Fri was bad until Mon really crashed. pic.twitter.com/syz5qvunTH

It today is a capitulation day, we should get a bounce next week. There should be bottoming activity before its over. pic.twitter.com/QpkTEq274g

Looking at NYSE index, the count looks like it could be 4th step of a larger step 4. pic.twitter.com/MmqL6IjPrj

Indexes around the world today. In order of greatest percentage loss pic.twitter.com/UMUxlI6AKS

Wouldn’t you expect a bounce around Dec 2014 lows? If not & keeps plunging, that would be a head scratcher & put the focus on Oct 2014 low
The last projection level on this chart is also the Dec 2014 low pic.twitter.com/adqb3tVyx3

Fibonacci projection levels based on the Aug 17 peak. If market exceeds 261% level, I will measure from other lows pic.twitter.com/Lfsq5IBxPW


London FTSE is not far from its Oct low. pic.twitter.com/zeKCR0LJ8k

None of the Russell indexes from largest cap to micro cap have broken the December low. pic.twitter.com/xoFs7NscUQ

The weakest of the large caps is the DJ Ind as it’s nearest the Oct 2014 low pic.twitter.com/ezA1uufM4P

This is how the prior chart looked at the 2007 market peak, which generated a Dow Theory sell signal in Nov 2007. pic.twitter.com/aAqbSDejwI

No indication of a recession in this chart and major Dow Jones Theory expects weakening business conditions. pic.twitter.com/3GpYIZYLwy

Could this be right???? Nahhhhh . . . but it’s pretty spooky. pic.twitter.com/LutXWUtGwo

VIX getting into the area of the Oct low. pic.twitter.com/dRx48DPoPt

As long as step 4 isn’t sub-stepping (??), this count is correct. pic.twitter.com/GmDhZp6Q9G

I would think this would be much higher at this point of the decline. pic.twitter.com/DO6wIh2HJ2

Breaking the lower boundary is USUALLY a signal for a bounce. See Oct 2014 penetration. pic.twitter.com/Gp8H8pRg5q

Selling (red) deep into buy territory. Green (buy) is near buy territory. You watch the lines to reverse for a signal pic.twitter.com/RbmZ0nhWgb

Equal weight SP500 performing much better than the cap weighted SP500 pic.twitter.com/zWn62H8fhP

So far Trump is the teflon candidate and still in the running for President. The voters are so pissed at DC they’re giving us Trump ???
Is this the Trump stock market???
Referencing large step 3 since 2000 was not a prediction, just thinking out loud doing a “what-if”
We get QE4 & market turns up only to stop short of new all time highs, declining quickly towards the current lows. Large step 3 since 2000??

“..this break was not created by some new macro event or geopolitical headline. This was a break created by buyer exhaustion” Mike O’Rourke

This is the highest the CBOE total put/call ratio has been this far into the day since at least 2004.


Dow Theory references the Dow Industrials (not SP500) and the Dow Transports. So a signal is only generated by the Dow Jones figures.
SPX Oct 2014 closing low = 1862.49, Oct 15 intraday low 1820.66 DJ Ind Oct 2014 closing low = 16,117.24, Oct 16 intraday low 15,855.12
2094 was my warning to take precautions now. SPX presently at 1995. That’s a 100 points decline in SPX and still more to go
Going like a bat out of hell towards the Oct 2014 lows. pic.twitter.com/Eteqsa10Aj

@wekim77 They all break the channels at the same time though.
@wekim77 I use a bunch of indexes to count, sometimes they all agree & maybe only 1 will show the real count, cuz the rest will be confusing
This indicator has suddenly risen to an area where rallies have occurred in the past pic.twitter.com/TrY7QsLAn8

I hope this will be over by Sept 1 as I will be traveling. Hopefully I’ll have Verizon contact while in the middle of nowhere, frequently do
I prefer to be conservative on Dow Theory sell levels, choosing the Oct 2014 lows. Ind & Trn are declining near the Oct levels, but no break
Dow plunging 360 points, the Godfather of newsletter writers, 91-year-old Richard Russell, warned we have entered a bear market in stocks-KW
Richard Russell did say today “I believe the stock market has gone bearish”. Did King World put words in his mouth regarding a Dow signal???
2007 Dow Theory Sell, bottomed below August lows. Rally after sell signal was THE EXIT 4 short & long term investors pic.twitter.com/e1BLLRrMdr

This is how the 2007 Dow Theory sell signal looked. Making a bottom below the August lows. pic.twitter.com/45panFhPIZ

I think only Mark Hurlbutt declared a Dow Theory sell signal today. I would respect Richard Russell’s declaration of a sell, but not Mark’s.
If market breaks Oct lows, wouldn’t be surprised to see big rally, like what happened in Nov 2007 Dow Theory Signal pic.twitter.com/zXHUUOk6bQ

Talk of Dow Theory Sell Signal today, didn’t happened. Oct 2014 lows are critical Dow Theory levels, not broken yet pic.twitter.com/CgRS3edrOt

SPX is @ 2036 & fell below “minimum” to qualify this step. Now Is anyone unhappy with my sell signal @ 2094, missing 60+ point drop ????
After 2 false breakouts, the triangle has been broken a final time. Triangle target is 2010, another 38 points down pic.twitter.com/TyiGIcz82C

Present count of the step since the peak on 8/18 at 2104. I called reversal at 2094, 10 points off the high. pic.twitter.com/u9d7UXFC2p

Prior Tweet – “which should carry us down to SPX 2044 or lower”. Only couple of points from achieving objective, but market should go lower
Wed – SPX was 2092 at 5:30 AM PDT Tweet warning SPX is -40 since Tweet of “plunge downward on our hands real soon. Precautions taken now”
Martin Pring chart Market’s response to FED meetings pic.twitter.com/riEfADqYud


Many of the global markets are falling, but Japan is one that is holding up. pic.twitter.com/3pHRbYcLQf

SPX pitchfork since 2012, it has spent substantial time below lower line, Oct was a fast dip below the line & then up pic.twitter.com/4LPjkeaD1Z

Wave count in the Russell mid cap index. pic.twitter.com/rBQi6q7mZC

Wave count in the NASDAQ composite index pic.twitter.com/RMkqpzq4Ew

New closing low for the DJ Industrials today. pic.twitter.com/SEz6vFeL2E

Price of oil keeps going down. It had a fair rally after the initial decline & now it’s falling again to new lows pic.twitter.com/WMHFNQEpAf

Russell micro cap index showing likely wave count, also showing weakness in its latest rally. pic.twitter.com/1V7aLrOV0w

Chart that made me think decline was over. Now it looks like a possible 5 step down. No verification of 5 steps yet pic.twitter.com/DjIUBzbt2E


John Murphy says Sideways pattern formed since early July, has bearish look to it, increases odds for another downleg pic.twitter.com/oNgIs8FnVO


@focus1234567 Terry’s best bond strategy is always a good strategy for conservation of capital. It’s a slow capital appreciation tool too.
#9 The real money is always made in the long term and not by trading the short term. Lotsa people don’t realize that until it’s late in life
#8 LONG TERM scenario will always be most conservative approach & it has had no buy signals in some time. Short term can be a crap shoot
@wekim77 Could be a freudian slip of the keyboard
LONG TERM = HOLD STRONG STOCKS, FOLLOW DOW THEORY SELL SIGNAL SHORT TERM = ANOTHER STEP DOWN IS UNDERWAY, CAUTION !! wp.me/p1DRwF-332
#4 When I reversed my viewpoint at 5:30 AM PDT, SP futures were down 5 points, but a 5 step decline was in progress. Didn’t like the 5 steps
So far today, we have experienced 1st step down, which should carry us down to SPX 2044 or lower. pic.twitter.com/AmvL89HZ5q

LONG TERM = HOLD STRONG STOCKS, FOLLOW DOW THEORY SELL SIGNAL SHORT TERM = ANOTHER STEP DOWN IS POSSIBLE, CAUTION !! wp.me/p1DRwF-332
Since July peak, I see 2 steps down. We could have a plunge downward on our hands real soon. Precautions taken now. pic.twitter.com/vE3MokDXlJ

“My Uncle always told me to never own anything that ate while I slept.” Quoted from Jeff Saut, just seemed like sound advice.
John Hussman posted this recently. Probably good calming material when the world & the market are treating you badly. pic.twitter.com/OnkDOXrAWJ

Interesting chart, but it’s way off target presently. Probably supposed to look at this as a rough long term guide? pic.twitter.com/WO7OZqER9W

Heidi Klum is no longer a 10??? youtu.be/qdY7p7iKIK8
In 3rd step down since peak today. FOMC minutes at 4 PM. We’ll see how positive FED is about raising rate in Sept??? pic.twitter.com/sp1F8QrokD

Triangle breakout with decline back to upper line finding resistance. False breakouts are not uncommon near the apex pic.twitter.com/0ik5ybUUMz

Yen formed triangle over last 5 days. Hopefully it will break upward, cuz inverse Yen & SP500 follow same direction pic.twitter.com/rUcXHMMKMt

To generate a Dow Theory sell signal, Ind & Trn must pierce lowest red lines “almost” simultaneously on both charts pic.twitter.com/dhNsRGRcI4

Another way to count the rally. Since 8/12, we’ve had 1 step up & a 3 step correction, now beginning larger step 2 up pic.twitter.com/vNF7rZx0g8

LONG TERM = HOLD STRONG STOCKS, FOLLOW DOW THEORY SELL SIGNAL SHORT TERM = RALLY NOW, 5/20 HI TO 8/12 LO, 3 STEP DNwp.me/p1DRwF-332
Correction is 23% of entire 3 step rally but 50% of most recent rally. In a 5 step up, would explain short correction pic.twitter.com/acBeM7cFSu

NASDAQ recent count to the present. Waiting for step 5 to reverse upward. Seems too small to correct a 3 step rally?? pic.twitter.com/Gi3TwyHu50

Inverse head & shoulders on daily chart with slant neckline. This is continuation pattern without valid measurements pic.twitter.com/tjrErTtLHq

Large inverse head & shoulders from market’s peak. If valid, this is CONTINUATION pattern & doesn’t measure normally pic.twitter.com/xpE4grbwVu

Head & shoulders MEASUREMENT is the same as the triangle shown recently. Target is 2152. No upward break of H&S yet pic.twitter.com/qTjzcPPV1e

SP500 futures have retraced 23% of their recent rise. After a 3 step rise, you would expect more retracement, but . . pic.twitter.com/HeGQ3Dfb5L

Could form inverse head & shoulders at this bottom to solidify upcoming advance. Target ES 2152, prior high was 2135 pic.twitter.com/cvzic8c6fc

Nothing has happened of consequence to say 3rd step is finished. Prices must fall below ES 2074 B4 3rd step is over pic.twitter.com/B5jfvDyncw

Could be 3 steps up completed, but I would rather think we’re going to subdivide and have 5 steps. We’ll see? pic.twitter.com/RethdOPuEf

Tom McClellan said his timing models suggest “THE” top in stocks will hit between 8/20 and 8/26 Market must have lower highs to come true!!!
After hours, SP500 futures made a small higher high (8/12/15 peak). The Dow & NASDAQ futures haven’t followed. pic.twitter.com/FDqBb8h8ih

International stock indexes bottomed in early July. pic.twitter.com/YtInVVkN9j

Very regular 3 step decline in the Russell small and micro cap sectors. Russell mid caps shows a 5 step decline. pic.twitter.com/iLdvNaPqKA

Notice how the retail sector performed during the weakness since May. What weakness??? pic.twitter.com/319BzA6Epl

A 5 step decline in the Value Line Index. It achieved its downside target for the head & shoulder’s topping formation pic.twitter.com/zrltPbK1cD

Many of the indicators on my StockCharts page have been showing positive divergence since the late July bottom
These charts have positive divergent readings on the recent low. First positive reading in many months. pic.twitter.com/B6XwgA6AQg

After false breakout of triangle on 8/12 has now broken out to the upside. IF BREAK IS VALID, target is 2172 pic.twitter.com/3kbE7TK7p6

SP futures didn’t break the step one correction bottom. Market must break 2100-2110 level to break bigger downtrend pic.twitter.com/hP1dFhGIPh

We “may” have completed rally in 2nd step (sub steps up?) Breaking below step 1 correction may indicate a reversal. pic.twitter.com/0YMKLGPHbj

Good Definitions: Short-Term: Days to weeks. Medium (Intermediate)-Term: Weeks to months. Long-Term: Months to years.
The TEMA was developed in order to deal with this problem.
One of the common problems of trading with EMAs or oscillators has always been the inevitable issue of lag encountered in trading decisions.
Triple Exponential Moving Average, or TEMA, is a type of exponential moving average developed by Patrick Mulloy in 1994.
Mike Burke There is not much to go on this week. Both the breadth indicators and seasonality are indecisive, but both are modestly positive
Mike Burke New lows declined a little last week, but not in a way that would suggest a bottom. Next week seasonality is modestly positive.
Mike Burke The turmoil in the FX market last week probably contributed to volatility in the equity markets.
Jeff Saut likes candlestick hammer formed on Wednesday. He is declaring Wed as likely bottom, but a break to Dec lows is possible AGREED!!
After a 62% correction, the market is rallying in step 2 since the 8/12 bottom. Needs significant new high to verify pic.twitter.com/PtTW738S21

A false breakout from a symmetrical triangle shortly before the apex. pic.twitter.com/wRlUNgFsQp

It’s not too unusual to see a false breakout from a triangle as you get closer to the apex of the triangle. pic.twitter.com/JBJAKx4l2X

LONG TERM = SELL DOW THEORY, OTHERWISE HOLD STRONG STOCKS SHORT TERM = WE “MAY” HAVE REACHED THE FINAL BOTTOM wp.me/p1DRwF-332
Rally stopped on the upper tine of the pitchfork. Needs more punch to break the line. pic.twitter.com/MfxLuMxaqp

All of the futures traded indexes are rolling over in after hours market trading. I’ll have to watch it later tonight pic.twitter.com/HVnPWn81o2

NASDAQ found support at one of the Fibonacci radials, but it looks like it’s in 2nd step down and “may” fall lower pic.twitter.com/Jd1ExLlPRY

As you can see from yesterday’s late peak, there was only 2 steps down & now we are getting payback for that omission pic.twitter.com/TtZrTesDW2

Dow futures aren’t near their morning lows, there is more weakness in the NASDAQ & that usually means more decline pic.twitter.com/gjwhwghss9

Something is killing the NASDAQ because it’s near its morning low, while other indexes are higher than that. pic.twitter.com/1Zble4ygDF

Most world indexes are positive today. pic.twitter.com/4GLDhvPzKS

NASDAQ now weaker than large caps and leading to downside. pic.twitter.com/HmIzK6i7mo

Possible wave count that bothers me. When white 3 complete, it will finish yellow 3. Other indexes don’t confirm this pic.twitter.com/SYt6O21Rx2

Looks like we “could” be rolling over into more correction. Needs a few more minutes to confirm this. pic.twitter.com/bxuBsVKIsy

Semiconductor daily index almost touched bottom channel on Wed. No other index came this close on their daily charts. pic.twitter.com/eNsM1ZdQTz

Yesterday morning, many of the indexes that I follow touched bottom of their channels. That’s reason enough for rally pic.twitter.com/VVWUtjubC2

I may be less than 100% convinced at the moment, but I’m not changing my short term forecast. Possibly, we could still see a double bottom
“I’m so confused”, said Vinnie Barbarino, which was John Travolta’s first role on “Welcome Back Kotter”, in 1975 pic.twitter.com/GZJO8eqnNK

Normally, when a larger 3 step is finished, it’s obvious to me quickly. This time, not so much.
Large cap reversal after 3 smaller steps down. Larger trend in 3rd step down too. But all isn’t perfectly clear yet?? pic.twitter.com/GoVISllCfg

Because of daily chart, I’m not 100% convinced that bottom is in place. 3rd step probably is finished, but needs more pic.twitter.com/RTqturnW9O

The daily chart doesn’t show that 3rd step down is completed. It needs a larger upward move to break the down trend. pic.twitter.com/UhEONGzvsn

False break down of triangle, broke it & then reversed upward immediately. What happens when it meets downslope line? pic.twitter.com/xGo4qYOjgA

Correction this morning & now moving ahead again. It wasn’t a double bottom, but that might come after 3rd step up. pic.twitter.com/b7DNJ6AWty


A correction has begun. We’ll see how things hold up.
Buying seasonal influences came into play beginning on Tuesday and violia, it’s underway.
Buy signal likely, market came off bottom like a rocket (short covering). Wait for a correction to buy & verify sustainability & the bottom
LONG TERM = SELL DOW THEORY, OTHERWISE HOLD STRONG STOCKS SHORT TERM = WE MAY HAVE REACHED THE FINAL BOTTOMwp.me/p1DRwF-332
After longer than usual decline for this bull market. a rally with some type of return to the area of the previous bottom is to be expected!
The NASDAQ is performing better than the SP500 & Dow, exceeding its previous high by a wider margin than the SP & Dow pic.twitpic.twitter.com/WgZv7FMuUZ


When step 3 is finished declining, there is a buy signal. Have higher highs presently & the decline “MAY” be FINISHED pic.twitter.com/KGqoJgyLd0

@wekim77 Width of the triangle added (or subtracted) to/from the breakout point.
Vietnam has responded to Chinese Yuan devaluation by broadening their band vs the Yuan currency. The race is on for last & best devaluation
Currency wars were the big rage prior to the beginning of THE Depression. So they are to be watch carefully for contagion.
Currency wars are not to be taken lightly!!!! 1998 currency crisis caused markets to lose lotsa points. Lotsa different problem occurred
Germany’s DAX is down 2% tonight. China has lotsa people upset with their surprise Yuan devaluation.
Biggest concern investors fear is Yuan devaluation suggests China’s slowdown is more severe than reflected in Chinese government statistics
Certainly a “death cross” indicates a weak market, but often we have false starts before a genuine cross takes place that is meaningful.
Moving average crosses have no predictive value. They are lagging indicators of what has already transpired and don’t show the future trends
Some argue that death crosses have little predictive value, since some previous ones appeared right around market bottoms like July 7, 2010
Rare “death cross” appeared Tue in chart of Dow Jones Industrials, suggesting stock market may have already begun a new long-term downtrend.
@3i_Capital Agreed. I’d rather be cautious on the tops as the public is eating the last of the frosting
@3i_Capital I called the peak in May 2006 and knew it was wrong quickly. I vowed to be more conservative on the next significant peak
@3i_Capital That’s certainly possible. But I’m still waiting for a bear confirmation similar to Oct 2007, or something similar & divergent.
Value Line index is resisting making a new low. That’s good sign. Value Line consists of ALL stocks with equal weight pic.twitter.com/A3pE7k1HML

Jeff Saut is looking for a final bottom also & he’s very good. One of the very few people that I follow carefully and that requires talent.
If we’re in last step down, these things end with dullness or a waterfall. Don’t try to catch a falling sword, let it show itself first.
Enlarge the screen images of these daily Russell charts & you’ll see that it looks like we are in the last step down. pic.twitter.com/RkoGGyRi9Q

World indexes aren’t have much fun tonight either. pic.twitter.com/4mJyQRGrbx

Are we having fun yet??? Since the close today, we’re down another 13.80 point in the SP500 futures. pic.twitter.com/IiaHSh5dn2

A channel break for the decline that began early this morning. Don’t “think” large rally will result from this break pic.twitter.com/8tIe3P6JEG

Things to do, people to see, so no more comments from me until later today. If I have nothing to say, there won’t be further comments today.
A triangle forming, approximately SPX target of 2166 upside or 2014 downside. Target depends on direction of breakout pic.twitter.com/BLVtpm2NFz

Higher high in the NASDAQ making it the end of a step down. Which step is it??? I should be posting that later pic.twitter.com/aZMBn6PgS0

LONG TERM = SELL DOW THEORY, OTHERWISE HOLD STRONG STOCKS SHORT TERM = WAITING FOR NEXT SPECULATIVE BUY POINTwp.me/p1DRwF-332
Yup, it was a completed 3 steps down, market rallied and then rolled over again into a 4th & 5th steps down, further downside slide underway
Looks like 3 steps down since today’s peak. Speculative buy in progress with stop below 3rd step low. Protection against a 4 & 5 step down?
Today’s rally was very close to a Fibonacci 61.8% rally. There are 3 contacts on that level today with one peek above pic.twitter.com/8EnF4W0sRs

We might correct for awhile after the 2:18 EDT peak. A strong close today making new highs would be very bullish. We’ll see.
Using my wave count technique & seeing a 3rd bottom, I saw a rally coming & issued a speculative buy point last night around 8 PM PDT.
This was the correct Fibonacci radial. The most obvious is the one I didn’t use on prior posts. I screwed that up pic.twitter.com/tAOBL9CoAE

Earlier from an old saying, triple tops are seldom valid. The one in NDX wasn’t valid with a break above prior peaks pic.twitter.com/CnKtCCQLp6

Is the NDX futures going to touch the underside of the Fibonacci radial??? pic.twitter.com/Iz5UFnKYky

Short term rally in the Yen presently pic.twitter.com/SULzHBsBLf

Is the NASDAQ NDX going to make a higher high or turn down??? pic.twitter.com/K41DxvgW6t

Fibonacci price projection from a prior peak before the correction took place pic.twitter.com/9zbJk6fe0M

Uneasy with failure to correct & move higher in Dow & SP500. NDX is making a triple peak??? Old saying, triple peaks rarely prove valid
Often times when you take a position can be more important than what you take a position in. – Anonymous
The Yen has been in a downtrend this morning and will our market follow along? pic.twitter.com/DRrwdkUnQJ


Meeting resistance at this morning peak in the NDX futures pic.twitter.com/0jR4EvZ3zc

The large caps are doing better than the small caps this morning. Chart = large cap, mid cap, small cap, & micro cap pic.twitter.com/8yZBD5LrSx

Are the other indexes beginning a correction now??? We’ll see, but the NDX futures are still below their morning high pic.twitter.com/Zb9tFbNGyV

Another Fibonacci price projection for further advance. 2104 level is the next projection price level above 2094 pic.twitter.com/vi6L7Agsj8

The SP futures didn’t have a correction this morning. pic.twitter.com/iGKPKKrVxX

Only the NASDAQ had a correction this morning . . . WHILE . . . pic.twitter.com/dAaZlYuqxd

Initial Fibonacci price projections yielded a precise figure for this morning’s correction peak pic.twitter.com/z4fTc33LSj

Fibonacci radials for NASDAQ yielded this morning’s peak drawn from a prior peak during last night. pic.twitter.com/RiMkwKtLT0

LONG TERM = SELL DOW THEORY, OTHERWISE HOLD STRONG STOCKS SHORT TERM = SPECULATIVE SHORT TERM BUY, TOOK 1ST PROFIT wp.me/p1DRwF-332
NASDAQ hit the 62% retracement line this morning. pic.twitter.com/XQfT7chUng

LONG TERM = SELL DOW THEORY, OTHERWISE HOLD STRONG STOCKS SHORT TERM = SPECULATIVE SHORT TERM BUY, TAKE QUICK PROFIT wp.me/p1DRwF-332
Since 8/5, we’ve completed 3 steps down. More rally is likely, probably to at least the 50 to 62% retracement level. pic.twitter.com/hhiRiSqbaD


Just cuz I say it’s coming, DON’T MISINTERPRET & think it’ll happen next week. Forewarned is forearmed, means have your finger on trigger

This is, so far, THE chart of the year. Look at all of the unprofitable IPOs: stks.co/a2Mu4 $SPY $IPO pic.twitter.com/rsmmg69nvH

@wekim77 Yup. 1987 was one SCARY crash. Wish I was short during 1987, but I was out and completely neutral 😦 I bailed out on Oct 6th.
Any correction at the present isn’t related to the economy. It would be a simple correction of this long bull market pic.twitter.com/EkWMpDI8bO

No indication of a recession in today’s jobs chart, meaning economy is in good shape. pic.twitter.com/KqSuLXGTZY

Last recession, black jobs line crossed below red average line during late 2006 & then jobs rose in 3rd quarter 2009. pic.twitter.com/fqM0cTYZiC

Prior to late 2000, the jobs indicator was showing a recession was likely, black jobs line crossed red average line pic.twitter.com/1vlyI3dURK

An interesting chart and I’m not sure how useful it is, but if it’s correct, terrific. pic.twitter.com/v97NeCHnXA


Pitchfork for Russell 2000 (RUT). Moving in the lower half of the pitchfork since Oct 2014 pic.twitter.com/rKNz21gItA

This pitchfork shows after Nov 2012, the count is step 1 Oct 2014, and step 2 May 2015. pic.twitter.com/VtGDcGurCg

Wider version of present channel. This version allows leeway to downside. Count would be the correction after step 2 pic.twitter.com/R0TTxeXaca

Close up view of the same pitchfork. Notice the recent rally failure at the lower line pic.twitter.com/k5TG0BaxVQ

Prior to this year, the market has moved in the upper half of the pitchfork, now it’s spending time in the lower half pic.twitter.com/8vsL9cgmoq

The channel since 2012 with a couple of breaks, Oct 2014 & the present. pic.twitter.com/mp8Y00McCk

DJ Transports were turned back by this pitchfork. Let’s see what the next rally will do. Transports are oversold pic.twitter.com/FKiFmZqTUj

Mike Burke The recent period of weakness has been consistent with the average seasonal pattern and that pattern turns positive next Tuesday.
Mike Burke Average returns for the coming week have been positive by all measures.
Mike Burke The Positives New lows increased last week, but, so far, have not reached the levels of 2 weeks ago.
Mike Burke The positives Market weakness of past several weeks has been consistent with negative seasonal pattern that ends early next week
Mike Burke The negatives New highs disappeared last week while new lows returned to threatening levels.
Mike Burke The good news is: · The market is oversold and next week seasonality turns positive.
Wave counting from my blog by Bob Karrow stock-market-observations.com/category/3-rea… pic.twitter.com/ugvjP11CXO

Changing scenarios is an example of: “Don’t ever make the mistake of telling the market it is wrong”. – James Dines
One must always be looking for changing scenarios. Sticking with 1 scenario is a key to failure. One must always keep reacting to the market
And there you have it. Different scenarios of further rally or doom & gloom. I didn’t elaborate on doom, because no one wants to hear that
The 1998 correction was followed by strong market rallies. This scenario is possible again over next couple of years. pic.twitter.com/RmuLqE34M0

During the 1990s, the 1998 correction is exactly what I’m looking for when we have a terminus wave count pic.twitter.com/BxhZ6hyH4G

Disregarding percentage declines, future expectation is that this channel should be broken & a new channel to follow pic.twitter.com/ZPsS2V8Yxc

Counting steps correctly has a lot to do with symmetry & how the wave developed. I was never satisfied how early steps in 2011-2012 unfolded
Wave count in prior tweet consists of decline in 2011 ending in Aug & not Oct. This enables May 2015 peak as step 4 pic.twitter.com/PW3k1jWCtV

A rally to new highs would potentially validate this wave count. I have always been suspicious of step 1 in Nov 2011 pic.twitter.com/cOI16cgRcG

A rally short of old highs would prove this chart’s count is correct. BUT . . . pic.twitter.com/9Y69uD1P61

After pitchfork tine is broken, a rally to new highs similar to Oct 2014, or a rally could be fall short of old highs pic.twitter.com/N4xmQbc7ib

I expect lower tine to be broken, but how far down after that? Probably not too far & then a rally back to old highs pic.twitter.com/CeDrAuaTv5

A pitchfork since 2011 shows we are near a break of the lower tine of the pitchfork. We had a broken tine in Oct 2014 pic.twitter.com/rSKNfSasoC

A bear market could carry market down near 2009 lows, OR only a 62% correction of the advance since 2009 (2012 peaks) pic.twitter.com/XX5LsYMvFt

Simple break of trend would be largest correction since 2011, perhaps as low as the lower blue line, about 1900 DJIA pic.twitter.com/dCLYLVj6Bm

At the end of step 3 occurs 1. Break of step 3 trend & resumption of bull market in step 4 & 5 2. A large bear market pic.twitter.com/1x3WVZAagX

It’s obvious from the chart that we are in step 3 since 2009. BUT where are we in step 3?? That’s the $64 question?? pic.twitter.com/ThEkLrm0iB

I know that I make things confusing to follow, because I frequently have several different scenarios going at once pic.twitter.com/NBGyfYvM3I

@MichiganMan_2 I QUALIFY that with when the top is in. If the peak is behind us, a 25% decline is likely & will also fuel higher peaks
LONG TERM = SELL DOW THEORY, OTHERWISE HOLD STRONG STOCKS SHORT TERM = NO BUY SIGNALS YET wp.me/p1DRwF-332
@MichiganMan_2 2100 SPX from 1100 in 2011 can reasonably expect at least a 25% decline. A bear market for me involves over 1 year downside.
@focus1234567 It can happen. The channel is the determining factor, but when you have correct wave count, you’re ahead of market on buy/sell
@focus1234567 it’s determined by the channel break (trend break). I’m flexible that way where Elliott Wave is rigid. The trend is everything
OR, we could keep it simple and end the decline during 3rd step. No way to tell for sure other than the way the rallies perform on upside.
If market ends correction in Oct, or Sep (?), market will likely have 5 steps down. Market is in step 3 & it’s Aug 7. Rallies take time too
Market is perverse & will end its correction at an unexpected moment, like the rate hike, or at the end of a (sold-out) waterfall decline.
If we get a September bottom to this correction, It probably occurs on the FED rate hike. OTHERWISE, we get a waterfall after the rate hike
It’s the new lows that are picking up velocity overwhelming the new highs
Did anyone notice how the new highs held up really well today? See following chart at my stockcharts link PAGE 2 CHART 2 – – NEWEST HIGHS
2011 correction lasted 22 weeks & if that holds true now, “A” bottom could arrive in October. Oct is always a good historic possibility
Russell 2000 (RUT) in 3rd step down. I’ll try to post more charts when I arrive back home. pic.twitter.com/Iy2hVQOnyQ

BAD MOJO
PAGE 4 CHART 0 – – LARGE CAP INDEXES Value Line index at bottom of this chart group has a completed head & shoulder. Chart link next tweet

Current chart formation is typical where market could turn up into 2 or down into 3. Higher highs & lower lows define pic.twitter.com/7XwjEEN9DI

This Fibonacci radial appears valid and gives some ideas of possible downside stopping points. We’ll see how it goes. pic.twitter.com/RIJ34b39oP

This Fibonacci is valid but it doesn’t yield any stopping points if the market turns down. pic.twitter.com/HqFGUqMQgL

Dow could be in a downward channel. We’ll see how that turns out, meaning it must have lower lows to be valid. pic.twitter.com/bxWVAPUqbR

Yen is showing the way for our market (hopefully). pic.twitter.com/2VGW5Vqzd2

The rest of this week I MAY not have a wireless connection. So if you don’t hear from me, it’s because I’m out of contact in the wilderness
@MichiganMan_2 Coryell coached LA community college, then SDSU, St Louis Cardinals & SD Chargers. Coryell videosyoutube.com/channel/UCYnZi…
@MichiganMan_2 I try to get friends back east to come in Jan or Feb as some of our best weather occurs then. Rest of US is hip deep in snow
@MichiganMan_2 TERRIBLE. Just like it was before Don Coryell took over the football program at SDSU. Those were the glory years at State.
@MichiganMan_2 Deviations from perfect weather are scorned upon by everyone. Strange how rapidly and radically people can change.
@MichiganMan_2 3 or 4 years later, transplant in a 55 degree SD day, says it’s cold today. Everyone becomes quickly acclimated to perfect.
@MichiganMan_2 RE: Transplants to SD from northern USA. We’ll have a 55 degree day & think we’re dying, transplant says it isn’t cold.- more
@MichiganMan_2 The new BB arena was designed to amplify crowd noise. It’s called the Pit & isn’t a friendly place for visitors due to noise
@MichiganMan_2 SD doesn’t have weather. Everyday is like yesterday. When we really do have weather it’s a big event & everyone is amazed.
@MichiganMan_2 SD has to wait for the Jan NFL meeting to see if the move is approved. Seems like Rams have inside track.
@MichiganMan_2 Steve Fisher is GREAT. Built a new BB arena for him. Chargers said they R going 2 LA, SD is busy trying 2 build stadium, but?
Decline stopped today at the 50% level. That’s reasonable. pic.twitter.com/NQTUldL7uP

@MichiganMan_2 Wife and I are alumni of SDSU. The Chargers used to be our team, but since they are moving to LA (likely), not my team now.
@MichiganMan_2 I have to keep my eye on MI now, because I’m sure you’re going to have a winner soon, if not immediately.
@MichiganMan_2 Harbaugh also has a free hand at MI & the 49ers were handicapping him. He hated that cuz he wanted to win the Super Bowl
Yen rallied more than our markets did in recent days. It declined earlier today than our market did. pic.twitter.com/kerDfa3IyE

Weak rally attempts so far after hitting the downdraft today. It needs more to not bring out the bears in force. pic.twitter.com/jsVXrJ00sm

@MichiganMan_2 I believe it. Leaving the pros & going back to college is unusual, especially for a winning pro coach. Just fed with the BS
@MichiganMan_2 Harbaugh coached at University of San Diego for many years before moving to Stanford. We knew he would be good everywhere
US is one of the worst performing markets today. pic.twitter.com/Wp2qPL9FpB

Murphy noted CRB Index hit a 6 year low, decline could indicate deflationary pressures, which could prevent central banks from raising rates
Scary, because of the possibility of deflation & that is among the ugliest terms in the economy. Where cash is king, if you don’t lose it???
Crude oil count. We could end up below the 2009 lows, which would qualify this decline as large step 2 down. Scary. pic.twitter.com/lOqJyLT1hW

Oct is 1 of the peculiarly dangerous months to speculate in stocks. The others are Jul, Jan, Sep, Apr, Nov, May, Jun, Dec, Aug & Feb – Twain
@MichiganMan_2 Historically corrections ended in Oct, but In recent years, more corrections end in Sept, but they’re both scary time periods
A possibly valid pitchfork on the Russell mid cap index pic.twitter.com/zpmCXbUe6N

There is the possibility that we are in 3rd step down since the mid-May peak. I have seen some treacherous 3rd steps pic.twitter.com/GBW9ClfCBf

Like Mike Burke said: Seasonally the first week of August, during the 3rd year of the Presidential Cycle, has not been pleasant. True so far
The NASDAQ chart looks like it is in step 2 down, which would probably mean a deeper decline. pic.twitter.com/ytb0qNr3eg

Possible double bottom I saw last night turned into a sub-divided step down. Fibonacci retracement levels on chart pic.twitter.com/PW5UQfiCWj

Is 3rd step down a double bottom? IF 3rd step is finished, we should rally on Monday (or at least tonight). We’ll see pic.twitter.com/I485Lt1qts

LONG TERM = SELL DOW THEORY, OTHERWISE HOLD STRONG STOCKS SHORT TERM = 1st SHORT TERM PROFITS PER MONEY MANAGEMENT wp.me/p1DRwF-332
@Stock_Trend_Chg Higher volatility means prices should rise or fall rapidly. Are too many people bearish? Majority is usually not correct.
Bandwidth of weekly Bollinger reached a 20 year low in July. The theory is that volatility expansion often follows a volatility contraction.
Mike Burke – 5 Had a bounce from oversold levels last week. If new lows continue 2 decline regardless of what prices do market should be ok
Mike Burke – 4 New lows declined significantly last week, but levels are still uncomfortably high. Next week will be critical.
Mike Burke – 3 Seasonally the first week of August, during the 3rd year of the Presidential Cycle, has not been pleasant.
Mike Burke – 2 If new lows continue to decline, the recent hiccup in prices will be over.
Mike Burke – 1 After hitting extreme levels on Monday, new lows declined sharply the rest of the week. This is a critical point.
Jul 2015 – 207 TWEETS
A violation of the July 27 or 28th lows is an excellent reason to sell, especially if the penetration is significant. pic.twitter.com/ozTXi4esvG

Have a nice weekend Bob
Since the bottom the put buyers have dominated the call buyers. Someone doesn’t believe this rally and I can see why pic.twitter.com/C7IhEVLvi5

LONG TERM = SELL DOW THEORY SIGNAL, OTHERWISE HOLD SHORT TERM = SHORT TERM PROFITS ACCORDING TO MONEY MANAGEMENTwp.me/p1DRwF-332
We have lower lows so we are going to correct, or pause in this area. A correction seems more likely. pic.twitter.com/aFdA2oMreg

The semiconductors are still riding close to the bottom of the channel. Most other indexes have moved to the mid line pic.twitter.com/CXl52bUURV

DJ Trans was a nice measurement being correct on a Fibonacci basis and the head and shoulders measurement. pic.twitter.com/FcTNuKu027

Measurement taken from different points with the same result. pic.twitter.com/JQoc005lVn

This Fibonacci relationship chart gives us a good reason to pause here, but how valid is it over the long term???? pic.twitter.com/wWfuQpF30l

Looking at several different indexes, it’s difficult to say with authority that we have 3 steps up, but we’re close pic.twitter.com/jGgLVbptv4

Watch for the lower low for the tip off that you should be taking profits.
Likely to have a correction on Monday+. Short term profits could be taken with object of buying back at lower prices pic.twitter.com/bqFmX9lhC0

Take the large caps away and it’s not a bad day. The Russell indexes are in order, large, mid, small, micro. pic.twitter.com/4VNohbEQMf

Mutual funds are holding the lowest percentage cash in their entire history (since 1960). This is a long term negative indicator.
If we do make significant new highs & the market internals don’t improve to match new highs, it could be Oct 2007 all over again. We’ll see?
If decline since mid-May is over, we must start by rising above mid-July peak. pic.twitter.com/PyGzHAgYPc

Small & Micro caps are doing better than the large caps today. That’s a good sign, but they are only outpacing them by .2%
Need to STAY AGILE in case of a double bottom or worse in large caps. Until resolved I can’t ignore step count problem in small caps???
Bothered by only 2 steps down in mid & small cap, but 3 steps in lg caps. Might have 3rd step dn in small caps & double bottom in lg caps???
New lows took a big tumble downward today. Good sign pic.twitter.com/bnDdIdk07c

LONG TERM = SELL DOW THEORY SIGNAL OTHERWISE DO NOTHING SHORT TERM = COMPLETED 3 STEPS DOWN SINCE MID-MAY, BUYwp.me/p1DRwF-332
Small & Mid caps are underperforming the large caps today. This is likely due anticipation regarding today’s wording about a FED rate raise
Watch the market closely after the FED announcement today (2PM). It’s wild for first 30 minutes, but after that it settles down to its trend
Referring to the previous tweet, put buyer correct on FED annoucement day. I meant that the puts were right for ONLY the announcement day
With a strong move up, the put buyers were strong. This last occurred before a FED meeting and the puts were correct pic.twitter.com/p7WLXF7MJd

If the market rises strongly tomorrow, it is usually a good indication that the market will continue up after the FED announcement.

It seems likely that only a reflex decline would take place with FED raising rates. It is widely expected and no surprise should take place.
Small caps (RUT) show 2 steps down. Since this has been a lg cap decline, maybe only lg caps will show 3 steps down?? pic.twitter.com/6MY6fhjY8Q

NYSE Index in 3 steps down since mid-May peak pic.twitter.com/vIvufHYPnH

DJ Industrials in 3 steps down since mid-May peak pic.twitter.com/epiwodvzvY

Some indexes completed 3 steps down . Other indexes show only 2 steps. Scenario – FED raises rates & market quick plunges to double bottom.

Very nice chart showing long term trend line and Fibonacci ratio line Borrowed this chart from Jesse Felder pic.twitter.com/pSbtwRYZ01

Friday’s late rally didn’t make it through the weekend. Will today’s late rally make it through the night and show up on Tues???
All of my indexes are on or below the 60 minute limit channel. Usually some type of rally occurs “near” this area pic.twitter.com/tcLkhgwdEm

Intel, which counts well, appears to be in a step 2 down. Semiconductors “can” be leaders for the economy pic.twitter.com/ebhcDTkYmg

Junk bonds are the canary in the coal mine.
Another junk bond ETF is below its Dec low pic.twitter.com/135QC1gsuf

Highest volume junk bond ETF is near it’s Dec low pic.twitter.com/WAytLoRgUH

We have to wait to determine if we are really in a bear market. Until then (channel break, Dow Theory), assume a neutral to bearish posture.
LONG TERM = SELL DOW THEORY SIGNAL – 7/24 SHORT TERM = DON’T TRADE UPSIDE UNTIL COMPLETED 3 OR 5 STEP – 7/21 wp.me/p1DRwF-332
One is never recommended to short in midst of a bull market, so one shouldn’t go long during a bear market. Don’t fight the trend is safest
It’s the smaller steps that compose a 5 step decline that one should never try to buy. Larger contra steps “can” be short term speculations
If we’re in a valid rally zone, you can play that for short term. A completed 5 step, which we may have is valid reason to speculate upside
60 minute ADX is in rally zone, when the daily ADX is in buy zone (not quite there yet), we will have a good rally pic.twitter.com/I6PetxoXz3

Mike Burke: Conclusion There is no evidence of a bottom and seasonally this period of weakness is scheduled to last 2 more weeks.
Mike Burke: The positives New lows are at dangerous levels, this will make the bottom easy to see because new lows will suddenly disappear.
Mike Burke: The negatives Prices began following the breadth indicators downward last week and there is no evidence of a bottom.
Mike Burke: The good news is: The market is oversold and due for a bounce I agree
No surprise here that new lows shot up today, continuing the trend higher for the lows pic.twitter.com/HwzUFa4trb

And shorter term oscillators are oversold pic.twitter.com/rxoGzGCcaA


In the black background charts, in upper left, identify the index & the time period each vertical line represents pic.twitter.com/ctyCYD9A9s

We ended a step down around 3pm today. If rally doesn’t hold thru Mon, it will be just a sub-step in the future chart pic.twitter.com/TNnbSgShO3

The Rule: Whatever the perceived count, if the channel is broken the entire wave is complete. Extensions are “possible” with a wider channel
Shorter term look at step 3 channel. A penetration in Oct 2014, but has 2 breaks in 2015. Channel has a sick look pic.twitter.com/O7tz1MKrW7

Long term look at the step 3 channel that began in 2012 pic.twitter.com/YsFa7jrxbd

Wave count in the Russell small cap (RUT) pic.twitter.com/oD0liSXpPy

Wonder if this last Fibonacci radial will hold the decline in this area??? We’ll see as it unfolds. pic.twitter.com/b3sUxyLJGt

Is this what’s happening ??? If true: Worst case is a waterfall during step 3. Best case is an upcoming double bottom pic.twitter.com/O5VzGMbdhZ

Wonder what the crash potential is ??? Never know the answer to that until it arrives.
The SP500 is at 62% retracement. If the decline doesn’t stop in this area, nothing to stop it unitil prior bottom pic.twitter.com/xcnkJOUKhW

LONG TERM = LONG TERM SELL WILL BE ISSUED UPON DOW THEORY SIGNAL – 7/24 SHORT TERM = 3 STEPS UP FINISHED – 7/21wp.me/p1DRwF-332
SP 500 futures chart barchart.com/chart.php?sym=…
Step 3 down since 7/20 could be ending, won’t know until the channel breaking rally, anyone can tell that happens by looking @ chart
Appointments today during the time the market is open, so no comments until later????
Those daily lows are continuing higher, not a very comforting thought pic.twitter.com/X2PNCtiXM3

3 steps up completed and correcting presently. After that will we get steps 4 and 5??? pic.twitter.com/x4GdhKCxlG

LONG TERM = SELL UNDER PERFORMING ON RALLIES – 6/1 SHORT TERM = 3 STEPS UP FINI, SELL OR WAIT FOR STEPS 4 & 5 – 7/21wp.me/p1DRwF-332
What if I’ve miscounted and we have finished the rally phase? I’ll withhold opinion until after we have completed 3 steps down.
Banks in a topping area and almost is a short term sale pic.twitter.com/cz9JuoBoL1

Semiconductors in a topping area and is a short term sale pic.twitter.com/wAaVo77Ee9


Put / Call ratio trending towards a sell signal pic.twitter.com/O7hrCR6oDC


Semiconductors in their 3rd step down pic.twitter.com/QGgtCEmnG3


World indexes are still on the downside today. pic.twitter.com/amfZNw2PXP

LONG TERM = SELL UNDER PERFORMING ON RALLIES – 6/1 SHORT TERM = SELL @ NEXT STEP (NEW HIGH) CONCLUSION – 7/16wp.me/p1DRwF-332
Most of the world indexes are down tonight pic.twitter.com/5rTyAMJlIn

Here’s an interesting article about Monday’s market high …arketobservations.files.wordpress.com/2015/07/the-th…
I labeled step 2 up as complete yesterday before the close & it turned out to be correct. pic.twitter.com/U08RF3SPI5

Have to wait for lower lows to verify that was end of step 2 up, it’s a possibility & that’s why I posted the chart pic.twitter.com/x3TaAuYJse

#6 After that point I will trade frequently and not buy Contract #3, but continue following Contract 1 and 2 rules.
#5 during a major 3rd step, I am unlikely to hold an investment position for long due to the possibility of a significant reversal
#4 That objective can certainly be different for everyone. For me, when the market has reached a “possible” major reversal point,
#3 The purpose of the Long- Term Contract is to comfortably ride with the market until your long-term price objective is reached.
#2 Assuming you have liquidated your other two contracts at a profit will give you breathing room during the corrective phase.
#1 Contract No. 3: The Long-Term Profit Objective Contract Purpose of the Long-Term Contract is to keep you in the market for the BIG moves
It’s not different this time. One problem is you never know exactly when this will end and it usually goes farther than you think possible.
Russell indexes, only large caps are doing well plus overpriced high PE NASDAQ stocks, Google, Amazon, Netflix, etc pic.twitter.com/1qMBGFNWas


SPX is at its prior closing high. Of the indexes that I follow, only NASDAQ at new highs, non-confirmation presently pic.twitter.com/cIZU7TLtAT

World indexes are still going higher, but at a slower pace. pic.twitter.com/gTKvx4gF6Z

Mike Burke Conclusion Last weeks rally had all the marks of a top, it was unconfirmed by everything that matters.
Friday was a mostly neutral day, but the number of new lows jumped dramatically. Not normal for a continued uptrend pic.twitter.com/qxaOHa7oA4

Nasdaq 100 performance after worst breadth on a day it gains >+1%. $NDX pic.twitter.com/4KokfHIrjW

VERY POOR INTERNALS NASDAQ Composite up .91% NASDAQ 100 up 1.45% NASDAQ Diary Advancing 1143 Declining 1690 Up Vol .81 Dn Vol 1.02
@MichiganMan_2 We are probably in the process of ending a step up, which “could” be step 1 of 3 . . . OR it could be the whole ball of wax??
@MichiganMan_2 Everyone has to choose for themselves. I would do what you’re comfortable with, or sell what allows you to sleep at night


This could be the 2nd time $NDX up 1% to a 52wk high with more decliners than advancers. h/t @jessefelder pic.twitter.com/2dNl87A7GH

If rally carries over into next week without a correction, I would be surprised and I would watch carefully for a significant new high.
NASDAQ alone has a new high. This occurs at beginning of a big step up, or at the end of a frothy move, frothy it is pic.twitter.com/05rhdr1eec


Russell small cap wave count, looks like a 3 count completed, but could be followed by a 5 count total pic.twitter.com/JWaimVX400

Money Show Few presentations dedicated to managing risk and how to avoid losses, while there are numerous workshops catering to greed
Look at the numerous contacts on the line from the bottom labeled 3 up to the present high. pic.twitter.com/zW9ZWKn99H


Here’s an example of an index that makes you think there is going to be another step down before it comes to life. pic.twitter.com/kDn4om4yMl

Today SPX closed on one of the Fibonacci radial lines pic.twitter.com/0gnx5ypPX8

The lower highs trend line has been broken pic.twitter.com/6z79dvwkgI

The perceived wave count since the Oct 2014 bottom pic.twitter.com/DLL9c1u94d

Watch the upper line for a possible stopping point, this would mean no new highs if it’s a valid resistance level. pic.twitter.com/Xr9ivffLGt

LONG TERM = SELL UNDER PERFORMING ON RALLIES – 6/1 SHORT TERM = MARGINAL NEW HIGH POSSIBLE, SELL ON APPROACH – 7/16wp.me/p1DRwF-332
Only if we breakaway SIGNIFICANTLY from prior peaks will I believe downside risk has changed. I believe this rally may be the last hurrah
Where might this rally terminate . . . somewhere near the solid yellow line is a good possibility pic.twitter.com/xRNvGOt4wF

A 15 minute chart showing the likely step count from the recent bottom on 7/9 pic.twitter.com/HPL1V1zuLf

Take a look at my charts if you’ve never looked. And if you’ve looked before, then look again. stockcharts.com/public/1169350/
Most of the world indexes are up tonight. The market must be out of breath, but it doesn’t want to give up an inch pic.twitter.com/jaXXELLQVR

A pitchfork for gold that doesn’t look good IF it’s valid ???? pic.twitter.com/lZoT85noCj

We got a 60 minute sell signal from the ADX today. The ADX is correcting the sell signal pic.twitter.com/n6T9AQEJNb

This indicator has a decent record for peaks and lows pic.twitter.com/fXRvLfyWR2

This indicator targeted the low nicely pic.twitter.com/GYaYeHHwnD

Equal weight SPX isn’t keeping up with the cap weighted SPX. Keep close tabs on this one for any change pic.twitter.com/hZdvqKG2jR

Short term overbought, but if it stays overbought, that would be a good sign for future gains pic.twitter.com/tE3QAPLhp8

Fibonacci ray that is working for the moment pic.twitter.com/Dws7OXpwR4

Reiterating: LONG TERM = SELL UNDER PERFORMING ON RALLIES – 6/1/15 SHORT TERM = BOTTOM IN PLACE – CAUTIOUS SPECULATION – 7/10/15
Greece Prime Minister was given 3 days to push new austerity measures through parliament and keep alive chances of staying in the euro.
Prior tweet is why I sold my buy position late Friday. Didn’t want to deal with Germany dealing a death blow to Greek plan over the weekend
European hardliners led by Germany damped expectations that a deal with Greece was at hand, questioning if Athens can be trusted
Mike Burke Good News May be a few days left in the countertrend rally that began last week. Bad News Game is over, the clock has run out.
Mike Burke Market has been unusually weak for the 3rd year of the Presidential Cycle & seasonally next 3 weeks have been, on average weak
LONG TERM = SELL UNDER PERFORMING ON RALLIES – 6/1/15 SHORT TERM = BOTTOM IN PLACE – CAUTIOUS SPECULATION – 7/10/15wp.me/p1DRwF-332

The area that the market has to overcome. This is where we really get the higher highs and breakout of the downtrend pic.twitter.com/zJ2KTzXsfT

But when the buy orders overwhelm the pro’s shorts, the market can continue up and that’s appears to be what happened now.
Sometimes a new high in the indexes is followed by a reversal? This peek above the high draws breakout buy orders that are shorted by pros

Yup, we are extending further. That’s looking good if it keep going
If I’m wrong that would be a good sign because it would mean we have further extensions to the upside and that’s what we need.
It’s not obvious that we have a peak for today, if I’m right, we should wander downward for the rest of the day. I DEFINITELY COULD BE WRONG
Is the ride over for today or was that all of it????
SP 500 futures rallying tonight, we’ll see if it turns into more, such as a hoped for reversal pic.twitter.com/aphTGeiXHK

The last down on the chart is why I’m watching its wave count closely. Reversal without a new low is positive pic.twitter.com/06NhCQMUfn

A possible wave count and Fibonacci support and resistance rays pic.twitter.com/z0GmRP7FLW

SP 500 on Tue had an outside day followed by two inside days on Wed and Thur pic.twitter.com/9CS2kkpPci

I’m interested in the 3 step down taking place late today. Higher highs & lower lows will be important – BIG CAUTION pic.twitter.com/GquIFVGfdT

LONG TERM = RAISE CASH, SELL UNDER PERFORMING – (JUNE 1) SHORT TERM = BUY POINT POSSIBLE SOON – CAUTIOUS SPECULATION wp.me/p1DRwF-332
Worst case scenario for the wave count. I don’t know if the end of this count is valid, but it’s certainly possible. pic.twitter.com/HjPqSSrvVK


Recent decline broke deeper below pitchfork than it did in Oct 2014. Breaking trend line is significant, BUT NOT YET pic.twitter.com/hgrgtoCehe


Put Call Ratio since 2011 and it’s the farthest into the buy zone since 2012 pic.twitter.com/BWY0vGrDSX

Put Call Ratio is well into the buy zone pic.twitter.com/Dh7Wjl5tQQ

When we get above SP 2085, we should have broken the downtrend since 6/22. But what does that mean overall??? pic.twitter.com/aPwtMfYjJr

Waiting for step 3 to end. Question: are we in step 3 of 3 steps down?? OR are we in step 3 of 5 steps down?? ????? pic.twitter.com/sLAtgxblK0

So far there is a triple bottom over the last 4 days in the Sp500 futures. pic.twitter.com/6VjNieuJ9a

Small bounce since NYSE reopened could be short covering
Stocks may be closed, but futures are trading (lower) NASDAQ has lower lows, but yesterday’s low is still intact pic.twitter.com/wzlEwTespn

The sky is falling, the sky is falling pic.twitter.com/PAf1LAXM0g

Everythings OK in China, just exit the market in a calm manner and then run like hell to avoid the falling bodies. pic.twitter.com/CgppztxxPQ

3 hours later and China is in a steeper decline, down -5.5% for the China H shares. pic.twitter.com/Yz61ClKdbd

CBOE skew chart indicates we are close to, or at, a low pic.twitter.com/0mnETTecA1

Hong Kong and China H shares Green clock on right indicates that their futures market is open. pic.twitter.com/7rLdZ6uQTr

Looking at online charts and we could have finished a 5 count to the downside. Worst case is we only finished 2nd step down. ????
Sorry but my charts are not available today because I’m on the move. That means I’m unsure what the rally means to the overall wave count.
Bloomberg The fallout of a Greek exit from the euro could wipe out as much as $1.4 trillion in future mergers and acquisitions
I’m still wondering if we’re in August 2007? If so, the large caps rallied to a new high in Oct 2007, while everyone else stayed away.
Global markets today, in order of percentage loss. I guess the China plunge protection team must have stayed home. pic.twitter.com/GRquFVk4ju

Jeff Saut “the potential for collateral damage if a Grexit was successful is too serious for the EU to even risk.”
Micro caps have a little more breathing room to stay inside the trend lines pic.twitter.com/w1qYlqbF8U

Last gasp to stay inside the trend line pic.twitter.com/662F91Onou

Hong Kong is down -4.3% Guess the China Plunge Protection Team didn’t include Hong Kong.
Will Merkel come down hard or soft on Greece? Likely hard, which is her typical no nonsense attitude. I would be surprised otherwise
Germany is -3.4% & London is -2.3%, SP500 is down 25 points (-1.2%) and up 7 points from its panic opening level. See more when NYSE opens
Greece Heads for ‘No’ Vote, Raising Risk of Exit From Euro Projections show a convincing victory for opponents of a deal with creditors
Bloomberg “China Brokers Dust Off Wall Street’s Playbook From Crash of 1929”
Bloomberg “Greek Pollsters Forecast Narrow ‘No’ Win in Austerity Vote”
WSJ “China’s Central Bank to Provide Liquidity to Help Stabilize Stock Market”
Mike Burke “The market is oversold and due for a bounce, but the breadth indicators have all gone south. Risk is high.”
WSJ “China is suspending initial public offerings and establishing a market-stabilization fund to fight the worst equities selloff in years”
WSJ “China is establishing a market-stabilization fund aimed at fighting off the biggest stock selloff in years” Crash Protection Team
Put / Call ratio is into buy territory pic.twitter.com/bPZRD5Z2RP

WSJ China Shares Fall Despite Beijing’s Moves to Curb Losses
How the world stock markets are performing today. World markets will be open tomorrow including our futures market pic.twitter.com/t8ij5sleYh

Maybe we could get a 4 and 5 out of this rally, but I’m not counting on it. Don’t like the weakness in smaller caps. pic.twitter.com/fQ1U119ppc

It wouldn’t be surprising to see the market close on the low side today with no rally on the close
DJ Industrials trying not to make a lower low at this moment. From other indexes, I don’t think it will be successful pic.twitter.com/hiRy6R5mhE

There is always the possibility that this may be a whipsaw, but I choose to play it safe at this point.
Russell small cap (RUT) & Russell micro cap have made new lows for this decline, entering step 2 down pic.twitpic.twitter.com/5f1mYlAonP


#2 There should be a successful rally (new high?) after this decline. At worst this is Aug 2007 decline & at best the extended top of 2000
#1 I looked at indexes & how they performed in 2000 & 2007. There doesn’t appear to be anything other than the BEGINNING of a long term top
I think we can buy back stocks at lower prices than presently.
I REALLY DON’T LIKE WHAT I’M SEEING. I’VE ISSUED A SHORT TERM SELL pic.twitter.com/Dwo5CadngK

LONG TERM = RAISE CASH, SELL UNDER PERFORMING!!! SHORT TERM = SELL wp.me/p1DRwF-332
WSJ “A dearth of Treasurys will limit the Federal Reserve’s ability to affect long-term interest rates.”
The 3 step down chart I showed a few minutes ago is now 5 steps down and not 3
A good headline – “Tsipras vows to hold Greek referendum, wants to stay in the euro”
If Greece walks away from Euro, can you spell inflation??? If not, then it will be austerity as with staying with the Euro
Probably not going to get a powerful rally before Thur close cuz of Greece, only a Greece resolution would produce power rally
Power of rally probably won’t occur until 3rd step, if the rally doesn’t produce power on the 3rd step, hope for 5 steps, otherwise problems
We have higher highs & higher lows & the bottom was exactly where I said it occurred, but market made a triple bottom & almost faked me out
Looks like 3 steps down since 2 AM last night, but if it doesn’t rally soon, it’s probably 5 steps down & then rally pic.twitter.com/j19pYrY5vs

Yen has been rallying nicely since the triple bottom of the 28th and the 30th pic.twitter.com/58uNi2DJcI

Jun 2015 – 327 TWEETS
This short term Fibonacci ray is working well for the moment pic.twitter.com/As580Zqa5g

2 steps down in the decline late in the day. A reversal after hours could be possible, we’ll see pic.twitter.com/36MjrgQsND

A possibility that we could have another bottom in the area of the “5”. A significant lower low wouldn’t sit well pic.twitter.com/NXRvRH0Opc

Nuts We’ll see where we’re at after 3 steps down & then see if a buy is possible or just suicide???? pic.twitter.com/hE9qchONU1

All I want to see now is higher highs and higher bottoms!!!
This is a bigger retracement after the 1st 3 steps up after a good bottom, did I made a mistake???? We’ll see pic.twitter.com/SYcbGfDwUY

We have a deep enough oversold over the longer term for a decent rally as the oscillators dip below the green line pic.twitter.com/QjahgUvwM6

Confirmation of the bottom, notice the vertical movement, just what we want to see on a good rally pic.twitter.com/yuioFElwg5

Good sign the NASDAQ is much stronger & almost back to its high for today, where the Dow & SP are about ⅔ to the high pic.twitter.com/cqIGLudstU

If you don’t understand my wave counting method, please read the following link. stock-market-observations.com/category/3-rea…
If we make new highs on this rally, it will mark the TOP upon reversal. As said before it’s possible we have already made the top, We’ll see
Good news, we have a completed 5 count, which means we rally into a 3 or 5 count up. pic.twitter.com/WJZleHrXLR

Daily ADX is not deeply oversold as it was on the Oct 2014 low. Daily ADX oversold always points to bigger rallies. pic.twitter.com/EB3IaIH8gO

60 minute ADX is as deeply oversold as on the Oct 2014 low. Asia is rallying & that “could” point to rally tomorrow pic.twitter.com/d2OYmhLPj3

LONG TERM = RAISE CASH, SELL UNDER PERFORMING!!! SHORT TERM = Is this like Aug 2007 followed by the Oct 2007 high??? wp.me/p1DRwF-332
John Murphy It may just be that global stocks were in need of a correction, and Greece provided the catalyst. Bingo
I’m going to go play now.
#9 Continuing #8 We would have what appeared to be a new bull market after the correction, but it would be a continuation of bull from 2009
#8 I think it’s likely that when step 3 up ends, we will have a large correction and then resume the bull market with step 4 and step 5 up
#7 But I’m not overly concerned abut 3rd step down since 2000 until more channels are broken and then I’ll be Chicken Little just like 1999.
#6 Worst case Waiting for a 3rd step down that began in 2000. The 3rd step may never take place, but its possible pic.twitter.com/fOzkcvb9MC

#5 Best case Step 3 ends & we have a 25-30% decline and then resume the bull market with step 4 up Worst case Worst than 2000 or 2007 peaks
#4 That’s what bothers me, a significant decline that may have started or will start in the near future.
#3 3 large steps up since 3/2009. When step 3 ends, a large decline will take place. I get skittish thinking about it pic.twitter.com/T3bgqza6DV

#2 Step 3 up since March 2009, which makes the last step up in this larger step very important. It declares the end. pic.twitter.com/BeNCEijKsg

#1 Channel that has existed since Oct 2014 low has been broken or is near broken. This is an important development pic.twitter.com/sUX3Ra23tY

Today is the first break of the pitchfork since Oct 2014. Pitchfork is based on 2012 market action pic.twitter.com/KPDifvih6e

Every hour was down today, that’s definitely a trend day.
Market is peaking now at a Fibonacci level from the 2008 peak pic.twitter.com/ByMfaZENMb

Everything is on its low going into the close. Not a good sign. pic.twitpic.twitpic.twitter.com/daCYs4jSjc


There really isn’t a big problem if Greece pulls out of the Euro. It’s whether the Euro will survive because Spain, Italy, et al, may follow
Equity markets don’t care about the absolutes of good or bad, but only if things are getting better or worse. Are things worse or better???
Best case at this point: Deep over-sold & then rally back to token new highs & begin bear market Worst case: We have begun the bear market
We put an emoji on a chart to show you what’s happening to the stock market today -> stks.co/p2Ocx $SPY pic.twitter.com/1GDkiJPsQO


NASDAQ has penetrated its Sunday opening panic low (yellow line) pic.twitter.com/cq1EjlFzHZ

60 minute ADX has moved into buy territory, but the daily ADX would be safer to wait for a buy signal pic.twitpic.twitter.com/p8fDWUt6NB


Best case at this point: A serious over-sold develops & we rally back to token new highs. Worst case: We have begun the bear market.
Have I made a miscount on step 3 beginning on Oct 2011? When large step 3 ends, there are serious consequences & I will call a BEAR MARKET!!
Small penetration of the lower trend line in effect since February. pic.twitter.com/iXihR5nfQ6


LONG TERM = RAISE CASH, SELL UNDER PERFORMING!!! SHORT TERM = Bottom miscounts from downside wave count subdivisionswp.me/p1DRwF-332
The market has rallied since the Sunday opening bottom. The rally is over & is declining. As I said earlier, this is going to be interesting

Stock index futures are bit sick tonight and a lot of markets aren’t open yet. pic.twitter.com/TbJzu4oDhD

Today’s decline in the ES futures (SP 500) stopped exactly at the early May bottom pic.twitter.com/rYAjN8WdJq

Wave count subdivisions continue to take place on the downside. What happens after the rally will be very interesting pic.twitpic.twitter.com/RYDRFqqwDh


Bears close watching to make sure it doesn’t decline further. If it doesn’t fall deeper, this might be as bad as it gets? 2,062.45 -33.70
Joseph Granville “If it’s obvious, it’s obviously wrong.” Pro traders are always ahead of little guy, they price market changes B4 the event
LONG TERM = RAISE CASH, SELL UNDER PERFORMING SHORT TERM = Bottoming errors due to downside wave count subdivisionswp.me/p1DRwF-332
Mike Burke “Historically the next 2 weeks have been very strong.”
“I made my money by selling too soon. – ”Quote from Bernard M. Baruch Baruch sold prior to 1929 peak and went to Europe. He kept his fortune
Soros, Icahn & Rogers warn of BIG problems for US stocks A few astute rich guys sell near market TOPS (usually EARLY) & keep BIG profits
BIG DIFFERENCE BETWEEN ELLIOTT WAVE & MY METHOD, I always allow large trend breaks to rule my wave count. Elliott fails cuz this difference
Russell mid cap shows a completed 5 count since Oct 2014 pic.twitter.com/dGcjDjlFmz

Russell small cap remains in a normal uptrend pic.twitter.com/gG50KuIdDJ

Peak trend line is still intact after recent touch and then declining pic.twitter.com/NP2h68ulEw

Preferred wave count yellow count since Oct 2014, cyan count since Oct 2011 cyan count is step 3 since March 2009 pic.twitter.com/0Lc45YCmgm


NASDAQ remains within normal upward trend pic.twitter.com/pW8f2Mx58G

Upward wedge broken to the downside in NYA, lower wedge line now acts as resistance pic.twitter.com/1rxMFECE8x

Notice the gap down as price broke through the trend line pic.twitter.com/nbLB8jmhgI

LONG TERM = RAISE CASH BY SELLING UNDER PERFORMING STOCKS SHORT TERM = Bad market to trade due to counting errorswp.me/p1DRwF-332
Greece SHOULDN’T be another Lehman Bros unless the long term view is the Euro will fail. Without common money the EU could fail also????
Breaking the channel trend is far more important than the perceived wave count. Channels breaks always rule over wave counts.
If we get a token new high, I will likely declare a long term sell signal. Getting that last token new high is VERY frustrating.
You SHOULD have BIG profits since 2009, if not, you have problems. Everyone stay away until we have a definite signal . . . up or down
Wave count shows a rally is not far away. pic.twitter.com/HQwCcHIG5W


LONG TERM = SELL UNDER PERFORMING, HOLD OTHERS SHORT TERM = Trying to aim for token new highs??? wp.me/p1DRwF-332
In 2013, the government garnished about $150 million in Social Security benefits from Americans to pay back their student loans,
Stock-trading volume is expected to surge @ Friday’s close as Russell indexes go through their annual routine of adding and removing stocks
China is going down as fast as it went up, hopefully it’s not in free fall. Large China losses could be infectious pic.twitter.com/aPxi4OsJu2

That could be the end of the decline, but we won’t know for sure until we have significant higher highs pic.twitter.com/GlUokS8k7x

Unfortunately we probably have to wait until tomorrow (or later) for a resolution to the downtrend. Just waiting for SIGNIFICANT higher high
#TheNewTen Move Hamilton to the $20 bill & put Harriet Tubman on the $10 bill. Hamilton is the father of our financial system.
The low for today was at 2098.25 Sep ES futures. I would think it’s likely that the final step would stop somewhere close to this level.
Yen turned up a little while ago. Usually a good sign. pic.twitter.com/xce34kWQ3d

I think I miscounted and there is one more tiny step down and the decline will be finished. I concluded that after looking at other indexes.
Unless the last small step subdivides, I would say the decline is over. We’ll see about that?
We are probably in the final stages of the 5th step down since 6/22. I’m waiting for the last step to complete pic.twitpic.twitter.com/9Qezbe1iJW


2nd largest loss in the world today is the DJ Industrials. Hmmmm pic.twitter.com/txOxAUsIkq

Since Oct it looks like 5 steps up with 1 small step left in #5. Breaking 2040 would probably end the Oct step pic.twitter.com/PaqfvbKTRP

The high level consolidation has a little depth now. The 4 step has a comparative waterfall look to it, common to a 3 pic.twitter.com/XFqKcw17mb

At the moment, it looks like a high level correction, but we’ll see if that works out by late in the week. pic.twitter.com/nfxdPa27KN

Russell micro caps are at the top of their channel, doesn’t mean it can’t go higher, but maybe expect a correction pic.twitter.com/0ucbwJgTVG

If Yen is still in lock step with our market, it’s looks like it’s going through a correction pic.twitter.com/B2lCA3zTty

Only 22% of Americans have at least six months of emergency savings (that’s what advisers recommend)
Nearly one in three (29%) American adults (that’s roughly 70 million) have no emergency savings at all
My wave count says there is more rally before we end step 3 since 2009, but a break in the channel for step 3 says the step is finished !!!!
Ragged advance, but it is an advance with likely more to go


Another pitchfork channel and long term count pic.twitter.com/ZMVbGhhy6x


Another channel to keep close tabs on pic.twitter.com/GX67n75Ubs


A possibility that the market has been moving through a rising correction in recent months, seen it before & only happens in STRONG markets
Showing a significant peak in intel, did intel begin its bear market early??? pic.twitter.com/FjCSCpcmbq

Junk bond sentiment has been moving to the downside for some time after double top in 2014 & 2013 pic.twitter.com/YDHrYk7ctK

Moving closer to a significant correction after small yellow 3 completes, but still has a ways to go on the upside pic.twitter.com/5oMMO2w97u

NASDAQ channel watching for a break, an upside penetration could take place just before a real downside penetration pic.twitter.com/TbcKqpxbEs


Yen back in lock step with our stock market pic.twitter.com/GoqeqBgStJ

SPX may have completed 3 steps up in a larger step 2, also hit a Fibonacci measurement level & reversed pic.twitter.com/qhq5j5QNnI

Link for my blog. Although not time relevant, it is a very useful teaching blogstock-market-observations.com
Sorted 1 month loss/gain for different countries. Also listed & not sorted are daily, 1 week, YTD, 1 year & 3 year. pic.twitter.com/sYFaDv2dtx

A link showing my method of counting the wave/steps. stock-market-observations.com/2011/07/02/odd…
That 3 step down turned into 5 steps. Market is getting a head start on the 1.1% loss for next week. pic.twitter.com/3lkol5g24d

Jeff Saut said bull has years to run & will double the SP 500 index in the forthcoming years. If true, advice is to buy strategically & hold
I’m not pulling the plug on this market just yet, as there is slightly more money to be made. But the risk is greatest to the downside.
Market continues to grind ponderously higher with nothing more than a 1 day impulse. Count plus this action is bearish intermediate term.
Jeff Saut is advising to withhold new money from the market until a breakout takes place.
Quadruple witching today. The week following a quadruple has seen a 1.1% decline on average. That’s not very thrilling.
This is a link I check every trading day to see how the rest of the world is doing. I sort by % change. investing.com/indices/indice…

Looks like 3 steps down in current step (#2). Should rally & then form step 3 down. pic.twitter.com/Jp1xOqwdtu

China’s latest 12,612.80 -676.41 -5.09% That’s a big 1 day correction. Hopefully it’s a normal zig zag, but . . . pic.twitter.com/AkNNYKPgyn

60 min ADX correctly warned of correction. Red & green horizontal lines aren’t rigid, only approx past turning levels pic.twitter.com/SQ3GTf62Eu

Put / Call ratio has hit the lower edge of the sell envelope, ignoring that for a moment pic.twitter.com/9Fxd7GJjXo

New highs burst higher today and the new lows have been trending down since June 9th. pic.twitter.com/TrYmm83pXe

LONG TERM = SELL UNDER PERFORMING, HOLD OTHERS SHORT TERM = Bottom in place & aiming for token new highs wp.me/p1DRwF-332
The count for the correction in the yen appears complete. It should rally now. pic.twitter.com/7zuOTBkquw

Yen turned weak at same time as ES futures. Are they back in sync?? pic.twitter.com/wtA4Gt1Z2k

Compare ES futures with the next chart of the yen for today. pic.twitter.com/oWtcDQLiza

First resistance and now support levels of the ES futures (SP 500) pic.twitter.com/Z92RBdXN2v

A measurement from Oct 2011 indicating that THE peak should be somewhere near the previous all-time high. pic.twitter.com/DFuomxBMxY

A measurement as to where this rally may go. pic.twitter.com/E20zNnvfNu

The daily ADX has a long ways to go before it’s over-bought. It just achieved an over-sold recently. pic.twitter.com/vLdYrkiVvf

The 60 minute ADX is nearing an over-bought status. pic.twitter.com/ouZqxsaWkz

Close up of wave count since March 2015. pic.twitter.com/BPPo8P5LcZ


NASDAQ composite has made a new all-time high pic.twitter.com/mOkxIYx0Mc

SP 500 is aiming for a new all-time high pic.twitter.com/dmkV0vdVIC

Russell micro cap index has made a new all-time high pic.twitter.com/4iIcDNxcFr

Russell small cap index (RUT) has made a new all-time high pic.twitter.com/3sHIUoKCuU

Took awhile for everyone to believe the following statement, which I made on June 9th “SHORT TERM = short term bottom “should”be in place”
Prior chart just posted is the inverse of yen, so yen is actually rising not falling. pic.twitter.com/YDhakomGK9


Support & resistance for Fibonacci ray pic.twitter.com/TSA6Kr1w61

Buyers in SP500 contract tonight indicating the FED will be a non-issue on Wed. Not often the SP 500 rises prior to the FED announcement
Slow stochastics are at a common reversal level. pic.twitter.com/QY09ympEhF

Wave count since Oct 2014 bottom. Cyan color is long term count since Oct 2011. Cyan 5 is STEP 3 end since March 2009 pic.twitter.com/Df7Uye4wJU

Russell micro caps made a new all-time high today pic.twitter.com/3JU8kt8HGC

Yen daily chart has formed a small triangle the last few day. pic.twitter.com/J8N66ZJUZr

Make no mistake, I am intermediate & longer term bearisht. I believe a correction of significant magnitue will take place this year.
So far it looks like we have a double bottom and recovery should be on its way. FED speak should resolve to the upside tomorrow
In the Russell indexes today, large caps made a higher low, small caps made a recovery high and micro caps made a new all-time highs today.
Measurements for this decline, which have been verified by some support and resistance. pic.twitter.com/ArnszRwoEO

Still no help from the Yen. It’s again neutral today. pic.twitter.com/x4Y67RFTaT

If the market keeps rising into tomorrow before FED speak, that means the market will keep going up afterwards. Has been an almost safe bet.
Obviously we have a double bottom, but can we trust this bounce. Tune in tomorrow and see what happens. pic.twitpic.twitter.com/Ya9H4RmLNy


The US manufacturing six-month drop in output, adjusted for inflation, puts the sector in a technical recession
Slow stochastics is now reaching into the buy zone (below green line). pic.twitter.com/pYbpwpBe4v

New lows did NOT increase as the market declined today pic.twitter.com/9x6i77SZ0w

Large caps showing weakness in category PAGE 1 CHART 2 – – (PRESENT) – AVERAGE PRICE RELATIVE TO 52-WEEK HIGH LOW pic.twitter.com/GEKj4Mwnrn

Large caps above 200 day MA are weakest PAGE 1 CHART 3 – – (PRESENT) – PERCENTAGE ABOVE 200 DAY MOVING AVERAGE pic.twitter.com/uZPZ7G0HCK

Large caps showing single step down from 5/20/15 to 6/9/15. Significant low will indicate more decline to come pic.twitter.com/BRXkM0D9M2

Large caps look like they have only completed one step down since their peak on 5/20/15. If TRUE, more decline ahead pic.twitter.com/dGRxo44n2r

LONG TERM = SELL UNDER PERFORMING, HOLD OTHERS SHORT TERM = short term bottom in place ??? wp.me/p1DRwF-332

No help from the Yen today. It’s about neutral today. pic.twitter.com/tKUhzYi3Bw

Utilities wave count since 2009 & the end of its bull market. Stocks will follow this same pattern sooner than later. pic.twitter.com/d6Sfy0p4dq

This is FED week & the volatility that comes with it. Some think the FED will raise rates this week, but later in the year is more likely
LONG TERM = SELL UNDER PERFORMING, HOLD OTHERS SHORT TERM = short term bottom in place, new highs will tell the talewp.me/p1DRwF-332
Mike Burke: “Seasonality has been very strong for the coming week.”
Articles printed the day & week after the 1987 crash. Scroll down & you can’t miss them. Great history lesson. stock-market-observations.com/2013/11/25/sen…

Link for Federal Reserve’s report on the crash of 1987federalreserve.gov/pubs/feds/2007…
The count on the 15 minute closing chart shows only 2 completed steps down. 3rd step is underway in this chart. pic.twitter.com/LB97SWyMBX

New lows didn’t increase yesterday & today. That’s good indication for more advance, but we need expanding new highs pic.twitter.com/rTWPYRd2HA

Yen had 3 steps down today & is rallying. Would expect stock market to follow, but they haven’t been in sync recently pic.twitter.com/laPVOL38zb

Is this a bottom retest? It has had 3 steps down & not rallied to break the channel. Is it setting up for a 4 & 5 pic.twitter.com/NnmDqeoBrG

Investors have been loading up on portfolio insurance all year & they’ve turned their attention to VIX options as a hedge
The last time speculators favored VIX calls over puts this much, their timing was prescient. A month later, the S&P 500 plunged 9.8 percent.
Investors use VIX calls as a tool to protect holdings from losses or to speculate on market stress. There are 4 VIX calls for every VIX put.
In 1987 stock index futures were called portfolio insurance. Do the VIX calls represent insurance today? In 1987 the tail wagged the dog.
We’re probably starting 2nd step up this morning. 2 good days in a row, that’s meaningful. See how long it takes before we’re overbought
1987 prices and interest rates. I’ll post a link to the FED’s report on the crash of 1987. pic.twitpic.twitter.com/GmXnw7usla


I’ve put bond prices on first page of my charts. PAGE 1 CHART 5 – – (PRESENT) – SPX ENVELOPE, SHORTER TERM OSCILLATORS, BOND PRICES & RATES
The idea that hit me. I’m not sure that its correct analogy. Regardless I’m becoming more bearish for other reasons marketwatch.com/story/get-read…
“Recall seeing same situation several decades ago” Forget about it, cuz situation is not quite the same. If banks start declining then ???
Today has seen a new all-time high for Russell micro cap index. pic.twitter.com/cytPjfzjdX


Fibonacci support and resistance lines pic.twitter.com/bjc4hXAa8q

Confluence of “3s” coming together on next significant peak. That’s what make things dangerous for signifiant decline pic.twitter.com/wQdHyIB3B6

I’m probably going to be super edgy on the next rally peak with new highs. The bull market count may be complete on the next peak. We’ll see
@focus1234567 Haven’t done enough research other than some late night reading and the situation isn’t identical. Gotta read more and think
Yen & SPX may have reversed relationship. Needs further evaluation, but things appear to have changed for the moment. pic.twitpic.twitter.com/6zF81hNtKu


LONG TERM = SELL UNDER PERFORMING, HOLD OTHERS SHORT TERM = short term bottom is in place, new highs tell the tale??wp.me/p1DRwF-332
I had been sweatin’ the recent bottom a little, it seemed count was right, but things seemed a little bit “off” to me. Just me being weird
Possible head and shoulders formation in the Value Line Index. Not valid until neckline is broken. pic.twitter.com/kwwCICvQMg

Another index with the same wave count pic.twitter.com/k6hkCbmEBu


Recall seeing same situation several decades ago, interest rates rising rapidly & market rolling over. Ended badly. More later after confirm
Audio link below, Jeff has some interesting thoughts stock-market-observations.com/?attachment_id…
Small & mid cap new highs are rising, while large caps new highs are declining pic.twitter.com/ohGOhwpGzl


McClellan oscillator oversold, but not deep as Mar or May, far less deep than Dec, Oct & Aug. It’s a muted oversold. pic.twitter.com/76wSnPvCrE

All 3 charts are large cap indexes and show lotsa weakness in their advance – decline lines. pic.twitter.com/tj8A90oPBz

Deeper oversold=powerful rally. No deep oversold since 10/14. Came close Dec & Jan. Is this another muted oversold??? pic.twitter.com/D1b0E4jpqT

Fibonacci support/resistance lines in the NASDAQ pic.twitter.com/D45bMriee7

Measurement shows next possible stopping point, 2066 June futures. Lotsa support on these Fibonacci measurement lines pic.twitter.com/RUtXGOzRoC

60 minute ADX is in the buy area, daily ADX is near the buy area. Any rally must now be treated with respect pic.twitpic.twitter.com/1oAypH1WSV


NASDAQ futures made a higher high while SP500 futures were making a lower high pic.twitpic.twitter.com/0zv9ltEuHJ


On the retest decline, NASDAQ is stronger than the large caps. pic.twitter.com/eVXGJS4WXG

You would want a retest to occur on low volume. pic.twitter.com/go4mn5N3gQ

After 2 steps up since the morning bottom, we might have a retest of the bottom. pic.twitter.com/yMJtOzGRWd

Other charts don’t support the previous idea. Future market action may prove the previous chart correct . . . or not. pic.twitter.com/JFpGDsuNAC

Chart leads me to believe an intermediate or long term top has formed and the advance decline supports that thought. pic.twitter.com/j1785opvmQ

Yen made a bottom this morning and is rallying. This bottom coincided with our market bottom in the index futures pic.twitter.com/oIzFLZn4sy

Daily chart of DJ Ind, 3 steps down in dotted white. 3rd step is not far enough away from bottom to call complete. pic.twitter.com/91emA7jQw9

LONG TERM = SELL UNDER PERFORMING, HOLD OTHERS SHORT TERM = short term bottom “should”be in place, new highs ?????wp.me/p1DRwF-332
Cyan “3” would be complete with a channel break (trend line break) of cyan “3” pic.twitter.com/hspTx21BoI

Presently, appears to be the count. After extensive decline, it wouldn’t be surprising to see more bottoming action pic.twitter.com/AvvQ7M09Rb

Lotsa congestion in this area. If it makes it through this area, new highs are certainly a possibility. June Futures pic.twitter.com/eEZNEvFcaf

Dow Ind RSI is in the area of prior rallies pic.twitter.com/eq8lLMqHm6

Dow Ind broke through earlier lows. We have a minor Dow Theory sell signal. These have been close to prior reversals. pic.twitter.com/geqMM03iHA

A Fibonacci measurement stopped today’s market decline. pic.twitter.com/plQmODAEbm


Approaching lower limit of SPX pitchfork in force since late 2012. Correction in Oct 2014 broke this trend line pic.twitter.com/Pe4HyG496A

Earlier said that decline could end at, or below the May 6 low. It’s close to that level now. Trend line is close too pic.twitter.com/tIfZ6Kv1H3


Support from one of the Fibonacci lines. Presently It becomes important to see if it’s going to hold back the decline pic.twitter.com/uH7f2YQu8X

On 1st chart, looks like we’re in step 4 – futures On 2nd chart, looks like we’re in step 3 – SPX trading day pic.twitpic.twitter.com/SK6RS6DexL


Gotta exceed the circled area otherwise could be more trouble ahead. pic.twitter.com/96ABnVAb5j

@tomandprisha @17_6YrStockCyc True, but the present pain may be over. Longer term is another subject for bigger pain.
The wave count as I see it. Last little step down probably finished & should rally from here. See for sure later. pic.twitter.com/08E47tfcy6

LONG TERM = SELL UNDER PERFORMING, HOLD OTHERS SHORT TERM = retesting the bottom, looking for another entry pointwp.me/p1DRwF-332
Highest volume of the day came near the close. pic.twitter.com/llLa4mwDbW

High volume coming in on this retest
LONG TERM = SELL UNDER PERFORMING, HOLD OTHERS SHORT TERM = retesting the bottom, sold with small gain wp.me/p1DRwF-332
Looks like the market wants to retest the bottom OR it isn’t finished on the downside.
Whether we have finished 3rd step down isn’t clear, but I will react accordingly. 3rd is “probably” finished, but I won’t know until later.
The quickening decline around 1:30 am EDT and rising volume attracted my attention and I bought when the market just stopped and sat still.
LONG TERM = SELL UNDER PERFORMING, HOLD OTHERS SHORT TERM = I bought very, very close to today’s bottom wp.me/p1DRwF-332
It’s possible the decline that began on Wednesday “may” finish tonight (Sunday). Significant higher highs are needed to end the decline
I think this Fibonacci ray should define the end of this decline with its support and resistance. pic.twitter.com/m6CTJRv4Jm

Valeant Pharmaceuticals (VRX) envelope since 2005 pic.twitter.com/hPcAwoJm6U

Sequoia Fund is closed, its largest holding is in Valeant Pharmaceuticals (VRX). Sequoia’s price reflects VRX closely pic.twitter.com/Az8ydZQfyt

Shanghai is going parabolic since early March, moving from 3000 to 5000 in 3 months pic.twitter.com/FkaPfXaXmU

Moving down the chart from small cap to large cap pic.twitter.com/GrBTQT4hqv

Auto sales are better every month, 2nd chart show what auto stocks are doing, going down. Anticipating higher rates? pic.twitpic.twitter.com/XeN8li6UiJ


William McChesney Martin, FED Chairman – he famously said, the FED’s job is “to take away the punch bowl just as the party gets going”
Charts showing a little bit of inflation has perked up. The FED doesn’t like this & will raise rates this year. pic.twitter.com/IaNtcPNlev

Ratio of consumer discretionary sales to consumer staples is forging ahead, money is being spent for unnessary things pic.twitter.com/wgIjrQppRm

Weekly job claims (inverted) is staying well above it’s 6 month average, as jobs picture continues to get better pic.twitter.com/vHVXiGKh4a

Showing 3 steps down in DJ Ind. I would buy the next significant reversal. The DJ Tran have likely already reversed. pic.twitter.com/68STGBbqAJ

Put / Call ratio clawing its way upward nearing a buy signal pic.twitter.com/TPkeXuVONu

If the count is correct on this chart, we “could” have lotsa fireworks before the up move is finished. pic.twitter.com/W6RrZztLuk

SPX ENVELOPE, SHORTER TERM OSCILLATORS short term oscillators are oversold too, but again that’s a relative term pic.twitter.com/8ijjt4wiob

SUMMATION INDEX, SPX McCLELLAN OSCILLATOR, LONGER TERM OSCILLATORS oscillators over sold, but it can be relative pic.twitter.com/0q0W25RcXi

PERCENTAGE ABOVE 200 DAY MOVING AVERAGE – small cap, mid cap, large cap charts strengthen moving upward to small cap pic.twitter.com/kJhdptaBrF

AVERAGE PRICE RELATIVE TO 52-WEEK HIGH LOW – All of these charts are large caps and showing lotsa weakness. pic.twitter.com/sHqjf01w5F

All large caps in these 3 charts, Wilshire 5000, SPX, DJ Ind. All performing badly as small caps have turned upward pic.twitter.com/zceCanm7xO

Chart – small cap, mid cap, total cap advance decline lines From bottom to top each cap becomes a better performer pic.twitter.com/EAtSc8HO3F

Mike Burke Seasonality for next week has been negative so this period of weakness probably has a few more days to run.
Mike Burke Secondaries are stronger than blue chips & NASDAQ breadth has been stronger than NYSE. Market direction should resolve to upside

Support from Fibonacci line since May 29th pic.twitter.com/jDJGXahNgV

Lotsa volume late yesterday and early today. Usually means we’re near a turning point pic.twitter.com/bCK831PPpf

Changed the trend line to reflect this morning’s low. The low may be in pic.twitter.com/u2J1WHHdfH

Daily ADX is getting close to a buy signal pic.twitter.com/yWUfdNNi4j

LONG TERM = SELL UNDER PERFORMING, HOLD OTHERS SHORT TERM = Should be getting close to an upside reversal wp.me/p1DRwF-332
Shouldn’t see significantly higher highs than occurred early this morning. If larger higher highs occur, it’s a buy pic.twitter.com/1jcEVYvRd6

Wave count in DJ Ind since its late May peak showing waving count. It appears we are in last step down of 3 steps pic.twitter.com/SapMGayuL0

I haven’t made a short term trade in weeks due to the ragged wave count. Makes me wonder if the TOP is in & I’m waiting for confirmation

Hit the one purple Fibonacci level and rallied. pic.twitter.com/IAPVwToD6y

Same as prior chart but with Fibonacci retracement levels. pic.twitter.com/2GKUJLCHSj

Possible stopping levels and support from Fibonacci lines pic.twitter.com/Ws4p3u8X8p


The Yen and our market have temporarily gotten a divorce. It would seem likely they will get back into sync. pic.twitter.com/kyYmiaPv6c


Russell indexes decline for today. The large and mid cap are doing slightly better than small and micro cap. pic.twitter.com/CmQRLVfHog

Support levels on the Fibonacci ray. Look for rallies to begin at these levels. pic.twitter.com/T8mJyyGkYK

LONG TERM = SELL UNDER PERFORMING, HOLD OTHERS SHORT TERM = step 3 ugly termination of decline??? B4 upside reversalwp.me/p1DRwF-332
Red/green trend lines. We have begun 3rd step down from late May peak. If Fri employment < 220K it could be ugly. pic.twitpic.twitter.com/XTkxFE6OvA


LONG TERM = SELL UNDER PERFORMING, HOLD OTHERS SHORT TERM = expected to resolve to upside before SIGNIFICANT declinewp.me/p1DRwF-332
17. Forgot to emphasize that a short term up is expected before we finish the 3’s. So short term is expected to resolve itself to the upside
Latest Thomson Reuters/PayNet Small Business Lending Index chart. STRONG upsurge in latest results. pic.twitter.com/w5jICJAspq

16. These 16 tweets should be referred to for future reference due to long term nature of these tweets. pic.twitter.com/KMKKAO4mMp

15. I am much more “CONSERVATIVE” with signals under long term. There shouldn’t be flip flops under long term. pic.twitter.com/aXOK2B0eTx

14. If I believe that we are in the “middle” stages of downtrend, Under long term, I would say “SELL” the rallies.
13. If I believe that we have begun early stages of downtrend, I will likely call it a “HARD SELL” under short term. pic.twitter.com/GLw5nhv8XQ

12. Been a very long time since we had a 10% or > correction. 2011 we had a > 10% correction. That’s been 3.3 years pic.twitter.com/0QfZwfiC1K

11. Favored wave count is the count presented in the earlier number posts. pic.twitter.com/PbAJdM4y8m

10, Resolution of alternate vs favored wave count should take place this year. This is a long term wave begun in 2009 & moves slowly
9. Alternate wave count based on my “channel theory”. A step isn’t broken until its channel breaks pic.twitter.com/YvObGk60gc

8. An ALTERNATE wave count since Oct 2011. Although “possible”, this wave count would not end until “years later. pic.twitter.com/XJvQMfj3ml

7. If this wave count is correct, a long/intermediate term correction will result after the “3s” are complete. pic.twitter.com/XtsxsWAosT

6. Chart showing the count since Mar 2009. Notice the confluence of “3s” coming at the next peak of consequence. pic.twitter.com/NwjXBoIako

5. Chart showing the count for the last step up that begin in Oct 2011 pic.twitter.com/8f1D865Axh

4. Overall wave count shows this bull market since 2009 is old and needs a large oversold to rejuvenate itself. How oversold is the question
3. If upper wedge line is SIGNIFICANTLY BROKEN on HIGHER volume, this invalidates upward wedge. I have seen “some” wedges broken to upside
2. Upward wedge should be resolved to downside. BUT it is not unusual to penetrate the upper wedge line at wedge termination.
1. Long/intermediate term thoughts in multi-parts Longer term downside risk exceeds upside gains. Upward wedge . . . pic.twitter.com/guZBAWYYch


If more decline is coming, expect it to end at or below the low on May 7th. That would make the correction look right pic.twitter.com/rypb5Jb8Fg

Likely there should be more decline after the step ending at purple 3 & cyan 2. If true, this decline may not be over pic.twitter.com/IvrmY4UFhs

If count correct, needs 1 more rally for cyan 3, which completes yellow 5. Yellow 5 completes move since 2011 & 2009 pic.twitpic.twitter.com/eT3ERoxy1h


Interesting NYA charts, 1st is the 2000 peak & 2nd is the present. They have similar looks with upward wedge at end pic.twitpic.twitter.com/oydjEouXUH


The red/green trend lines both turned green. If we hold today’s reversal gain, it should remain green. pic.twitpic.twitter.com/ktCmjECCQL


The newer Fibonacci ray (dotted yellow) provided perfect support on one of its lines today. pic.twitter.com/LOwzF7ELnV

Today the Russell small cap (RUT) and micro cap (RMICRO) are performing much better than the large and mid cap stocks pic.twitter.com/uqupdKNAG4

I’m going to call this morning’s dip a double bottom. Some indexes made a lower low while others didn’t. pic.twitter.com/PdZ36eURtU

Pitchfork from 2012 to present, parallel line (dashed) shows recent support. Watch for a break above or below lines pic.twitpic.twitter.com/P4jw3VlbF6


See how much easier the count is revealed on a 15 minute close chart, versus a 15 minute trading range chart. pic.twitpic.twitter.com/hdspXphawN


DJ Utilities count since 2009 shows completed count pic.twitter.com/mxt446rG95

Upward wedge in effect since 2011, bearish formation when completed pic.twitter.com/grWUwm61ZK

Fibonacci rays derived from Oct 2008 bottom has shown good support and resistance pic.twitter.com/4d42TDSFYn

Projected top from inverse head and shoulders formation was achieved and has been correcting since then. pic.twitter.com/n07NxqFpi5

Russell micro cap index rallying into 3rd step up pic.twitter.com/5KDc7tLNxG

Count since October 2014 correction. Market has lost dynamic upthrust characteristic, but can muddle upward for while pic.twitpic.twitter.com/AjafrHLG3P


Red Green trend line with expectation of seeing a green line turn today in both methods pic.twitpic.twitter.com/CpfHdZtXAM


LONG TERM = SELL UNDER PERFORMING STOCKS, HOLD OTHERS SHORT TERM = rally underway to SPX 2135+ wp.me/p1DRwF-332
Latest 3 step down for 3 Russell indexes. The Russell small cap index (RUT) has already achieved higher highs pic.twitpic.twitpic.twitter.com/Sb4Ayl8O40


60 min and daily ADX almost hit the buy lines, good enough to rally for awhile pic.twitpic.twitter.com/RbE1sPFu8f


The Yen continues to provide an upward pull on stock market. If they are still locked together, market should rally pic.twitter.com/L4nIRep9XH

3 ragged steps down. If true the present rally should have higher highs today. pic.twitter.com/EsT9OnNo2U

Fibonacci rays showing support after touching the line that has turned up the last 4 attempts at the line pic.twitter.com/IML7nLXgfp

Market declined and touched the lower white trend line and rallied. pic.twitter.com/gfL2PCN1Fc

May 2015 – 186 TWEETS
Mike Burke: The first 5 months of this year have been a disappointment.
Mike Burke: The first half of the 3rd year of the Presidential Cycle has been, on average, the strongest 6 month period of the entire cycle.
Mike Burke: “With the trend of new lows slowly increasing the positives are getting shaky.”
LONG TERM = SELL UNDER PERFORMING STOCKS SHORT TERM = CAUTION, might rally to SPX 2135 wp.me/p1DRwF-332pic.twitpic.twitpic.twitpic.twitter.com/vnYmGUGscB


Market is weird and counts weird. 60 minute ADX is nearing a buy, but needs more decline to move red to red pic.twitter.com/2mhZHxMkRL

THE CHART THAT BOTHERS ME. If the step count is CORRECT, a significant correction is ahead of us. Watch carefully pic.twitter.com/2ffMQwFQsj

Yen had 12 day rally and US market went nowhere during that Yen rally. Did they get a divorce and not tell the kids?? pic.twitpic.twitter.com/gzMA77lgg6


The Yen should now start running into overhead resistance pic.twitter.com/Uw5wwXA9Dv

China A shares are trading much lower tonight. Trouble in their rocket ship stock market??? pic.twitter.com/dwuqAOXtMG

Put call ratio has moved from sell to just past neutral line. Interesting to see if it can make it to the buy line?? pic.twitter.com/1fptAUZXui


“A billion here & a billion there, pretty soon you’re talking real money.” – Sen Everett Dirksen Words floated out of his mouth like bubbles
Dow Jones- 4th tightest trading range in 115 years

Must-see lessons from hedge fund wizard Paul Tudor Jones. Great visual @EdMatts -> stks.co/r2AMU $STUDY pic.twitter.com/IcCeZFXWmZ

GDP Fri consensus -0.8% consensus range is -1.0% to -0.2% Will bad news be good news for market?? Thinking FED will delay raising rates????
Stocks traded narrowly while highly overvalued signaled major stock market peaks, including 1929, 1937, 1965, 1973, 1999-2000 and 2007-2008
Tonight we “may” have finished step 1 in last step up of rally that began on Tue. Should see new high before DECLINE pic.twitter.com/77H4wSPguC

Going up into 3rd step. Needs to go 12 points further to make a new high pic.twitter.com/PJ80lQvBJr

CHARTS PAGE 1-5 = INDICATORS PAGE 6 = INDEXES – 30 MINUTE, 2 HOUR, DAILY CHARTS PAGE 7 = INDEXES – MONTHLY, WEEKLY CHARTS PAGE 8-9 = MISC
My Chart link has lots of indicators showing the present & the peak in 2007. Comparing the 2 gives a cautionary note stockcharts.com/public/1169350
ADX rules & how to use them can be found at the bottom of my charts “PAGE 3 CHART 4 – – (PRESENT) – ADX, VORTEX, TICK, SPX ENVELOPE, & TRIN”
Roy Ashworth Report: . . . but the next big move will probably be down after a false breakout above the weekly bearish rising wedge.
LONG TERM = HOLD; intermediate/long term top forming SHORT TERM = advance to large cap new highs, SPX around 2135 wp.me/p1DRwF-332
The 60 minute ADX showed the rally just before it began pic.twitter.com/ecJb1zLRJs

3rd step up is missing. 3rd step down appears complete Upward progress could hesitate at the upper down trend line pic.twitter.com/TNpzUzq8iL

Russell small cap (RUT) is beginning its small 3rd step up after the May 6th bottom pic.twitter.com/x1aKeS5iaQ


Market came down and bounced off the white dashed trend line (second chart) pic.twitpic.twitter.com/G7nBk0RFK7


Consumer Discretionary ETF has been stuck sideways since March 2nd. pic.twitter.com/JDarM8vzX7

JNK bonds are trapped in a triangle waiting for a breakout. pic.twitter.com/sfr7tFu4vb

The step count would look better in the large caps with another rally to old highs, but perfect doesn’t always happen near peaks

60 minute ADX shows we are oversold, but the daily needs further for a daily oversold. ES futures show rally underway pic.twitpic.twitpic.twitter.com/DG4L7jfkZs


DJ Utilities wave count since March 2009 pic.twitter.com/sguvE3SjzE

This pitchfork is probably the final arbiter for the end of this phase of the bull market. pic.twitter.com/o708njHZNI

Yen provided upward pressure Monday & Tuesday for our stock market. Although Yen has been weak since this morning. pic.twitter.com/cvqojkozMr

Russell mid cap appears to have made a peak, needs lower lows to confirm. pic.twitter.com/ds6bFRwk8k

The NASDAQ appears to have possibly made a peak, need lower lows to confirm pic.twitter.com/RuteGr5xx2

Russell Micro Cap appear to have peaked pic.twitter.com/SxX4dw9pbp

Russell small cap (RUT) indicates that step 3 counting from March 2009 is finished. pic.twitpic.twitter.com/EIMYVmqOJw


The other red/green trend indicator peaked last Monday. pic.twitter.com/LkR0Mc1bPS

Upward wedge broken, watch for significant break of white dashed trendline, then lower lows & that’s a peak or a PEAK pic.twitter.com/rgDo6V9N4H

Remember “Peak Oil”? Now there’s “Peak Food”. Next will be “Peak Air”. Buy the leading air franchise, Bob’s O2 Shack, only $1.5 million
Not the small decline I visualized late last week. This is a channel buster & I will do a step recount to see where we are re: the peak
On 5/22 “A small decline next week, followed by a dull rally to SPX 2135+ peak” This is much bigger channel buster decline than I visualized
Mike Burke Breadth deteriorated a little at end of last week, but seasonality for the coming week has been quite strong past 20 – 30 years
FUTURE SIGNAL Due to 05/06 miscount of steps, I waited for another step upward before I could declare an end to large step 3 in late 2007
FUTURE SIGNAL Cautionary note. In 5/06, I thought it was the end of step 3 from 2003 bottom. It was due to a miscount on step 10/02 to 03/03
FUTURE SIGNAL Often longer term sell signals arrive at a turning point for a rally. This becomes the rally for longer term holders to sell
FUTURE SIGNALS Short term sell signal could turn into an intermediate and long term sell signal when channel since Oct 2011 is broken.
FUTURE SIGNAL A small decline next week, followed by a dull rally to SPX 2135+ peak. After peak, a short term sell signal “could” be issued
Red/Green trend indicators No penetration today of the wedge lower boundary. Lower low needed for a penetration. pic.twitpic.twitter.com/d51xNFDbo8


The Yen was providing a lift to the market today?? What would stocks have done today without the lift from the Yen??? pic.twitpic.twitter.com/0WTu3U7HdX


SPX hit 2134 momentarily, but has spent time around 2132. See SPX peak estimates on May 21st for a top in the 2130s pic.twitter.com/DmTqh2dkzS

LONG TERM = HOLD; intermediate/long term top forming SHORT TERM = dull advance to new highs, breakout or breakdown?? wp.me/p1DRwF-332


SPX short term Fibonacci measurement levels are targeting in the 2130s. Closed at 2131 today. Fast breakout from 2130s “could” be bullish.
LONG TERM = HOLD; intermediate/long term top forming SHORT TERM = churning advance to new highs breakout or breakdown wp.me/p1DRwF-332
A valid pitchfork in force since 2012. Downside penetration of the pitchfork will declare large step 3 up over. pic.twitter.com/rr10XcTfQs

Yen has been trending down since release of FED minutes Wed. The Yen is exerting downward pressure on our market pic.twitter.com/2kWymErvYd

Two different red/green trend methods with valid trendiness and an upward wedge. pic.twitpic.twitter.com/ZO1gLNFdEl


Fibonacci measurements are made from a valid bottom & a peak. They yield possible stopping points far in advance of reaching these levels
Fibonacci measurements on 60 minute SPX from May 6th bottom. Predicting short term peak around 2132 SPX pic.twitter.com/Qmd3KEBMXe

Short term Fibonacci measurements show SHORT TERM stopping points. Long term Fibonacci measurements show LONG TERM stopping points.
Different Fibonacci measurements on 60 minute SPX from April 1st bottom. Predicting short term peak around 2134 SPX pic.twitter.com/iDKXntRF1r

Different Fibonacci measurements on 60 minute SPX from March 26th bottom. Predicting short term peak around 2132 SPX pic.twitter.com/3qtNKQyqqz

Fibonacci measurements on 60 minute SPX from mid-March bottom. Predicting a short term peak around 2138 SPX pic.twitter.com/cFxc1w8eSR

Intel Fibonacci levels measured from the late 2012 bottom. An excellent example of valid support and resistance. pic.twitter.com/MBlDMVgSQd

Russell small cap Fibonacci measurement levels from March 2009 bottom & Fibonacci ray lines from Oct 2011. pic.twitter.com/r5LIfjtSgW

A Fibonacci measurement from the March 2009 bottom. Presently we are at the 161.8% line and running into resistance. pic.twitter.com/42PYmq5avQ

John Murphy In the past, however, that big a divergence between the two Dow Averages usually led to some kind of a correction in the other.
John Murphy The growing or divergence between the economically-sensitive transports & the rest of the market is truly amazing & worrisome
Trendlines and an upward wedge in SPX daily pic.twitter.com/BnXByTuulf

LONG TERM = HOLD; intermediate/long term top forming SHORT TERM = No significant rally above SPX 2120, needs breakout wp.me/p1DRwF-332
Has correction begun? Don’t know, but if we have small correction & extend into steps 4 & 5, there is more rally ahead. Not likely to happen
Large caps will bring up rear in the beginning & end of a correction. Presently mid, small & micro caps are weaker. SPX must breakout or …
Lower lows, lower highs, breaking Oct 2014 low will confirm end to wave 3, which began in Oct 2011. pic.twitter.com/fYMAHxociQ

Wave count for Russell small caps (RUT). It may be complete, but if it subdivides into 5 step, there is more to come pic.twitter.com/hWsL359J6m

Two different methods of red/green trend action. The 2nd method did turn red as I had noted the possibility on Monday pic.twitpic.twitter.com/veeFC6FemD


Put/Call ratio has reached upper limits of the sell area. More extreme movements generate safer predictions pic.twitter.com/J2b05O2E9B


The white ADX line is very low & this usually precedes a change in volatility, either a forthcoming rally or decline pic.twitter.com/qikWvbXz2O

The Yen is providing upward fuel for our market pic.twitter.com/PPYVYXITUB

Short term wave count in the SP futures pic.twitter.com/6pu9cAy8PO

Two daily red/green trend line methods When the 2nd trend chart has risen above the daily prices, a reversal is near? pic.twitpic.twitter.com/QDnaVyS7zd


Obviously the place to be presently is in the larger caps as smaller caps are under performing
Russell large cap, mid cap, small cap & micro cap Smaller caps are lagging far behind the larger caps pic.twitpic.twitpic.twitpic.twitter.com/lH3o8zk7F4


Haven’t had time to study my charts to determine if a tactical change is needed. So far, all looks unchanged longer term since last week
Short term wave count since Feb 2015 peak pic.twitter.com/8gSpdA4nbg


LONG TERM = HOLD; intermediate/long term top forming? SHORT TERM = Ponderous rally has broken through SPX 2120 wp.me/p1DRwF-332
Big divergence, the DJ Industrials are a whisper away from a new closing high, while the DJ Transports made new lows? pic.twitter.com/hsB0c4DRb1

Today’s rally has definitely broken the downtrend channel in effect since the May 26th peak. pic.twitter.com/sT9IEOvhGD

The Yen is still not providing any good news for our stock market.
We had a Dow Theory sell non-confirmation today. The Transports hit a new closing low and the Industrials failed to confirm.
Retail quits are seen as a sign of strength in labor market. Workers will quit if they can get a better paying job. pic.twitter.com/1SwTaJB4TO

Top line is what concerns me & if that continues: “Well, ya got trouble, my friend, right here, I say, trouble right here in River City”
“Percentage of companies beating earnings estimates has fallen to 60.3% this quarter with revenue “beats” declining to 49.7% for S&P 1500”
For the 2007 peak showing weakening internals, see my charts atstockcharts.com/public/1169350
2000 peak, there was the 1998 decline (Asian monetary crisis) and a smaller mid-1999 decline. Each was followed by deteriorating internals
Before a bull market ends, there is a significant decline, followed by a rally to new highs. Rally will be unconfirmed & have poor internals
Fibonacci levels stopped the decline & rally @ 62% & 23.6%. Best scenario is a consolidation & then another step up pic.twitter.com/apPfx7WolL

The Yen is still not providing any love for our stock market. Yen, or our market have to turn soon and get into phase pic.twitter.com/4MJTHcopl4

I realize that no one understands my wave counting method, because all my friends go “HUH??” Never explained to anyone in person that got it


SP 500 bottomed last night. DJI & NASDAQ bottomed at opening today. Count starts @ different points but is same @ end pic.twitpic.twitpic.twitter.com/MXTHlbsrh4


Current trading in the SP futures, 3 minute bars pic.twitter.com/9QiF8iUHzY

Decline stopped on 62% retracement line & began to rally. If 3 steps down since 4/26, more rally “should” be coming. pic.twitpic.twitter.com/DnrUB5J2sX


Recent Yen action isn’t positive and isn’t giving a boost to stocks. Presently a 3rd step down may be forming. pic.twitter.com/qgssU2NwBY

Market Update France’s CAC 40: -1.96% Germany’s DAX: -2.22% UK’s FTSE 100: -1.74% Spain’s IBEX: -1.82% Italy’s FTSE : – 1.42% S&P -10.75
Timing is uncertain, but the Feds interest-rate increase will usher in a “regime shift” that will stir financial markets when it occurs
From Bloomberg “What’s new in this is that now it seems to be the U.S. side of things driving things lower,”
From Bloomberg Overblown expectations for ECBs QE pushed global debt valuations to extreme levels, triggering big selloff in European bonds
From Bloomberg Bonds Extend Global Rout as Europe Stocks Slide, Dollar Weakens
OR We could be testing the prior bottom. If true, there won’t be any damage on this decline except scare you badly. pic.twitter.com/As5FnWsBhC

This doesn’t look good. Makes me wonder if the count on the NASDAQ was correct and we are going into step 3 down??? pic.twitter.com/dE0Rnh6cdk

No tweets from me Thursday through Monday. The market can struggle along quite nicely without my help for a couple of days.
Looks like we’re in 2nd step down since last Friday’s peak. 2nd step could reverse tomorrow if nothing upsets market pic.twitter.com/Ac7Z6jOIAK

New charts were posted on my public StockCharts. There are dual charts of the indicators showing the present & 2007 stockcharts.com/public/1169350
Did we see a bottom late today??? I wouldn’t bet the farm on it, but it’s possible. The count is pretty hazy here??? pic.twitpic.twitpic.twitpic.twitter.com/nFzhZQgGnT


“Almost $100 Million of VIX Options Traded Hands in a Split Second Today” ” . . . the trades had characteristics of someone hedging stocks.”
Close up view of the SP futures, 17 minute bars. pic.twitter.com/ibG9g997LY

5 point discount on June SP 500 futures. Seems high with 1 month till expiration. Is it telling us someone thinks we decline more soon???
Step count possibilities Have we already made the top, or is there some more left on the upside? Soon it’ll be clear pic.twitter.com/Qiw3hoSS33

by Carl Swenlin Short-Term Signal Flashing Strong Warning Stunning loss of momentum, considered a strong warning sign pic.twitter.com/fgaOS2VoLN

From Mike Burke: Breadth deterioration is accelerating. Seasonality indicates a final top is still 2 months away
Gotta be aware of a possible breakout turning into a fakeout after a few days into new high territory. That’s the short term caution problem
The DJ Ind broke above their declining tops line today. Now they need to make an all-time high pic.twitter.com/4BMMqvJPVw

LONG TERM = HOLD intermediate/long term top forming? SHORT TERM = Rally best chance to break SPX 2120, be careful wp.me/p1DRwF-332
1st chart holds the possibility that 4th step is taking place, OR it might be 3rd step based on an error on 1st step pic.twitpic.twitter.com/ZTqDpX7eIL


24 HOURS AGO I SAID: “3 steps down and ready to try for 2120 again. Should be a good rally (more than what we’ve already seen today).” A+
Fibonacci support and resistance and perspective on what’s happened since yesterday morning. pic.twitpic.twitpic.twitter.com/CpZi7Lr0aV


If we have finished 3 steps down, we have to break the channel begun on 4/26/15. Breaking channel calls for 2120 or + pic.twitter.com/nNXn9B9NWZ

Finish 3 steps up followed by a small 3 step decline and then on to bigger 4th and 5th steps up. pic.twitter.com/St3z8UNtg0

@focus1234567 long term top forming, best scenario is decline 30% then steps 4 & 5 up; worst scenario is continue bear market begun in 2000

LONG TERM = HOLD, intermediate or long term top forming? SHORT TERM = Rally to SPX 2120 and breakthrough??? Or not wp.me/p1DRwF-332
@focus1234567 it was a rhetorical question, but the conventional thinking agrees with you. I just don’t believe it.
NASDAQ has a fuzzy count or it’s showing 2 larger steps down to today’s low. Regardless, enjoy the rally for now pic.twitter.com/UU37ANG3cv

3 steps down and ready to try for 2120 again. Should be a good rally (more than what we’ve already seen today). pic.twitter.com/XNj49y1uqQ

FED QE ended October 2014 Where is the fuel coming from for continuing stock market inflation???
Inflation = Too much money chasing too few goods Stock market inflation since 2009 = FED created too much money for chasing too few stocks.
Just a note that I’m going to revamp my charts on StockCharts. I’ll keep only those charts that showed the 2007 peak before it occurred.
LONG TERM = HOLD, intermediate or long term top forming? SHORT TERM = Decline began near critical level SPX 2120 wp.me/p1DRwF-332
Current wave count SP500 & DJ Ind agree on wave count, but the NASDAQ has a very different take on the wave count pic.twitpic.twitpic.twitter.com/f3lXapdoKD


Is that a double bottom or another step down. A little more trading should reveal the truth. pic.twitter.com/2grT8LJAUi

Watch for the possibility of stunted rallies for sign of worst things to come. Big rallies are signs of better health, but gotta thru 2120
Micro caps touched the bottom of the envelope today. Small caps didn’t quite touch the bottom edge of envelope. pic.twitpic.twitter.com/E7ibfi7gTz


Possible wave count since 4/27/15. If true, this “could” be the breakdown move I’ve been waiting for. pic.twitter.com/DKKraegrDX

Just keeps making new lows. The Dow Industrials is stronger than the SP 500, but it might catchup at some point. pic.twitter.com/3ZIp7HmbCb

Greece Says Compromise Not Possible Under Current Conditions Is the Greece situation overblown, or is it bigger than imagined???
An alternate wave count since 2011. I don’t put much faith in this count. This count does leaves lotsa room to upside pic.twitter.com/xb7thJYv25

Pic #1 Wave count since 2009, violation of pitchfork is end of count Pic #2 Wave count since 2011, ditto on pitchfork pic.twitpic.twitter.com/lc2Ijxaj78


Since late last night the NASDAQ composite futures show only 5 steps down to the present. pic.twitter.com/kUgHMgye3A

LONG TERM = HOLD, long term top forming? SHORT TERM = Decline began at the critical level of prior reversals wp.me/p1DRwF-332
Although we aren’t down that much (<120 DJI), this looks like bad mojo pic.twitter.com/KXhOfnC6pv

Since last night, appears to count as a 6 step down in the ES, although it may actually be in a 5th step presently pic.twitter.com/RIokLwkBOG

LONG TERM = HOLD, long term top forming? SHORT TERM = Rally is at the critical level of prior reversals wp.me/p1DRwF-332

Banking stocks are doing well and that’s always a good sign. pic.twitter.com/7KCrlLLp1X


Dow Industrials at upper edge of triangle pic.twitter.com/2u44ezseOe

Russell 2000, small caps, showing possible wave counts and trend lines pic.twitter.com/Lb36o2BLvc

2 different 5 day moving averages and their slopes. Both have been green for last 2 days pic.twitpic.twitter.com/Oloy6FjRy3


SPX has not been able to close 2120+. Significant reversals take place at 2120. Watch carefully for any difference pic.twitter.com/ZGUR6UA9Gc


NASDAQ has an inside day forming today pic.twitter.com/nXC7UzuM27

Russell micro cap is still tangled with the bottom edge of the envelope, while small cap has moved slightly away. pic.twitpic.twitter.com/6dUt33T29Y


60 minute ADX almost gave a clear buy signal yesterday, close but no cigar. pic.twitter.com/Iyu58g6ABx

A possible wave count since last October’s bottom. pic.twitter.com/ZHvzB9qMfm

Expect small caps to complete their peak before large caps. If true a continued uptrend in large caps is expected pic.twitter.com/v59S5pt9oO

Is the Russell small cap finished with its uptrend? If white 5 is complete, then cyan & yellow steps are complete pic.twitter.com/W6BItvpahx

Yen may have broken out on daily chart, Yen uptrend is seen on the intraday chart pic.twitpic.twitter.com/fNd3AwwiCX


3 day moving average (MA) slope with trend lines to watch. The 5 day slope just turned green using this MA method. pic.twitter.com/TshkkFeFqI

2nd step has largest rally in a 3 step down, but new highs or several days of powerful rallies will make this bottom formation complete.
LONG TERM = HOLD – long term top forming? SHORT TERM = Rally “may” give way to a double bottom wp.me/p1DRwF-332
On a short decline, it’s not unusual to miss seeing all of the steps. Steps can be seen clearer on intraday charts. pic.twitter.com/oZIwwwnpx6

Two different methods of slope interpretation using 5 days for the MA line. Daily chart only shows 2 steps down pic.twitpic.twitter.com/zv6Wc7zb7g


Larger cap indexes show 2 steps down. A double bottom could occur that would clarify situation between sm & lg cap pic.twitpic.twitter.com/5xVWI8OKRO


Nasdaq & smaller cap indexes appear to have completed 3 steps down. There is a possibility another step may occur ??? pic.twitpic.twitter.com/W46kJIQSGR


Apr 2015 – 174 TWEETS
LONG TERM = HOLD (long term top forming) SHORT TERM = Short lived rally soon, mid-day Friday ??? MONEY MANAGEMENT – wp.me/p1DRwF-332
Fibonacci lines for the Yen Posted the wrong chart earlier pic.twitter.com/HJ2dpn6LPa

Stochastic RSI for Russell small cap and micro cap are at the lowest levels since last Oct bottom pic.twitpic.twitter.com/nepO5v4BeX


RSI for midcap, small cap and micro cap are low and could rally pic.twitpic.twitpic.twitter.com/dEKS6nq1YF


Closing figures for Dow Industrials show small break of trend line on downside pic.twitter.com/NroLJS3uGq

Today’s extreme readings in the envelopes of Russell small cap & micro cap makes me think there will be a rally soon pic.twitpic.twitter.com/Ez997cL2iJ


Today shows a significant breakdown of the smaller cap advance decline lines. pic.twitter.com/Spi4UyX3kb

The Russell small cap and micro cap indexes are getting slammed today. pic.twitpic.twitter.com/FI9GbFAUby


A slightly different version of the prior chart. Red and green are slope based. pic.twitter.com/hijfr4RAkG

The SPX trend color is red for its second day. pic.twitter.com/xJJgluWhe6

A rising yen after a double bottom. If the yen rally continues, it could mean better things for our stock market pic.twitter.com/qrTzia0Jmb


Trend line slopes on Russell 1000, mid cap, small cap, & micro cap pic.twitpic.twitpic.twitpic.twitter.com/uQSaaoV0e9


Is this structure complete? Probably not. pic.twitter.com/3Yj2X5b7tm

Reversal on one of the Fibonacci lines. We won’t know if the rally is really over for awhile. We’ll see. pic.twitter.com/YYNY3mRQFM

Yesterday I said we had a reversal day & tonight the market is still falling. If this continues, we will have a gap opening in the morning.

I’m a huge $AAPL fan but this report underscores the fact that it’s now a 1 product company, a risk shareholders may not fully appreciate.


Some of the Fibonacci lines provided support or resistance. We are presently at one of those points in both SPX & DJI pic.twitpic.twitter.com/41BNFzuE9q


A precipitous drop today, we’ll see how long it lasts.


Yen continuing down after a Sunday and early Monday rally. pic.twitter.com/Z0d2wHiVC8

Early trend chart that “could” change color later today. pic.twitter.com/ZxA8f6grvu

If the market closes at a loss today, it will be a reversal pattern. New all-time high today & then close at a loss pic.twitter.com/bChJAsCYGb

First-quarter GDP will be unveiled on Wednesday, April 29, 21015 The consensus is 1.0% and the consensus range is 0.2% to 2.4%
A pitchfork beginning in 2011 First couple of weeks of May, I’ll have sporadic internet contact with few or no posts pic.twitpic.twitter.com/Q7gzM4z6ff


You could keep it simple & follow the red green signals on this chart. I’ll try to post it near the close each day. pic.twitter.com/jEaWyyCqFQ

SPX LONG TERM = HOLD (long term top forming) SPX SHORT TERM = ? (short significant lower low) MONEY MANAGEMENT – wp.me/p1DRwF-332
Yen continues down as stock market rallies. Unusual divergent action between yen and US stock market pic.twitter.com/6mHv4mVnND

Possible wave count on latest rally and trend lines pic.twitter.com/uwI2FJI59Y

The Yen is not leading our market higher. Unusual for these markets to diverge??? pic.twitter.com/0ZOnOsK97P

SPX LONG TERM = HOLD SPX SHORT TERM = NO POSITION (risk is high, reward is limited) BRESSERT’S MONEY MANAGEMENT – wp.me/p1DRwF-332
Russell 2000 since 2009 and a shorter term look of the last 9 months This index “could” peak before the SPX pic.twitpic.twitter.com/ZVAAgDgEWN


The sky is almost falling, the sky is almost falling said Chicken Little. Chicken Little and I can ALMOST see the end pic.twitpic.twitter.com/m24TooqaxB


Step 5 needed one more step. I wondered if we were going to get the last step? 3rd & last step in step 5 is underway pic.twitter.com/0YCm8hENTZ

Nasdaq Rises Above Closing Record from 3/10/00 3/10/00 = 5,132.52, 5,039.35, 5,048.62 3/10/00 Intraday high = 5132 pic.twitter.com/EgSN5qTWDz

The triangle, can SPX close above the upper yellow trend line. Next barrier is a significant penetration of Mar high pic.twitter.com/v8ICCxqhQw

After several days of rally, the Yen is falling and has a lower low. That means our market “should” fall soon. pic.twitter.com/h7aNIe9CM0

Put Call ratio (red line) is in the sell area. Blue dotted line is the signal area & orange line is extreme pic.twitter.com/7OPsMYMrmB

Upside triangle breakout must be watched closely for an upside failure within a few days of the breakout.
Russell indexes from large cap to micro cap Wave count indicates a correction may be coming in the smaller caps??? pic.twitpic.twitpic.twitpic.twitter.com/MpyEm3UMOJ


SPX LONG TERM = HOLD SPX SHORT TERM = SHORT cover short on upside triangle breakout BRESSERT’S MONEY MANAGEMENT – wp.me/p1DRwF-332
Still stuck in the triangle, but pushing the upper trend line. pic.twitter.com/WRoKL6hZP5

SP500 & DJ Ind futures have lower lows. NASDAQ futures have higher highs. pic.twitpic.twitpic.twitpic.twitter.com/MNwDgwk9Kx


Maybe the wave count goes like this ???? pic.twitter.com/nPyWjya98F

Reversal right at the downtrend line, the next decline will be the 3rd step down, will that step be the breakout? pic.twitter.com/jH1Na7GCn7

The Yen has been rising since late yesterday showing 3 steps up. Is the 3 steps valid and a correction is near? pic.twitter.com/B3R5IJ7HKJ

Running out of options to stay afloat, Greek Prime Minister Alexis Tsipras ordered local governments to move their funds to the central bank
While the large caps have been stuck in a triangle, the small caps have continued upward. pic.twitpic.twitter.com/8LOtjaZRAr


When Europe starts trading tonight, market could have legs? Watch for higher highs & breaking the triangle pic.twitter.com/YLosOugQ5a

So far the Yen is going sideways on Sunday pic.twitter.com/CleB8mynEg

So far, the China rate cut rally has been shallow. We’ll see what happens later tonight. pic.twitter.com/lJlgfQ7wjW

What’s the biggest story on Monday, Greece or China? SP500 futures start trading at 6 PM EDT.
Triangle measurement shows a significant move (up or down) after breakout from the triangle. pic.twitter.com/n7yRhb7z60

For those who don’t have access to real time SP500 futures, this is a good link investing.com/indices/us-spx…
China cutting bank reserves, will we get a Mon morn flash rally, or a sustained move upward? Watch the triangle pic.twitter.com/ejzcqb0j0q

China cut bank reserve requirements showing they’re worried about the economy. It also shows they aren’t concerned about stock market bubble
Mike Burke Last Wednesday’s highs were pretty well confirmed suggesting the decline that began on Thursday will not amount to much.
Mike Burke There are problems, new highs have been deteriorating for a long time & are at levels that are not indicative of a robust market.
Mike Burke Tops take forever to develop. So long it’s hard to believe it. This one developing for a long time and I still do not believe it
Credit Managers’ Index from Feb 2003 to the present pic.twitter.com/qFlOWBoLzP

I’m tired and glad the week is over. Need to rest and get ready for what happens next.

Credit Managers’ Index is pretty skittish pic.twitter.com/FIooRZpNM1

It will be interesting to see if bargain hunters come in on Monday to buy the dip. Who gains control, bears or bulls, will be fun.

@focus1234567 Look at the history
Fibonacci support & resistance at work. Notice how one of the lines targeted truncated 3rd step. Now I notice that !! pic.twitter.com/iz1IOr7wW5

The ADX line (black line), 2nd chart) is very low. This usually precedes a significant move in the market. pic.twitter.com/vK7LNLhnYS

For now this is just another down draft unless we break the triangle on downside, then put more shorts on. pic.twitter.com/BvkUnv4WJ4

Watch & see if messy step 5 is complete. If completed we will see penetrations below late 2014 low, then big shorts pic.twitter.com/fs7rMZQMza

That 3rd step never made it to a higher high above step 2. Need to watch carefully to see if this decline is for real pic.twitter.com/fdzMnmFS12

SPX LONG TERM = RAISE CASH POSITION SPX SHORT TERM = SHORT after a truncated 3rd step BRESSERT’S MONEY MANAGEMENT – wp.me/p1DRwF-332
Russell 2000 with bond market risk appetites – note the divergence again this week at these new highs: $IWM pic.twitter.com/8UJCGLkEkg

Jeff Saut has said many times, triple tops rarely hold back the assault. I need to post some measured moves tomorrow. Hopefully I remember
SPX couldn’t close above the top’s trendline, penetrated it like yesterday but no close above it. pic.twitter.com/dkXxNRXYZj

I would have to see it happen, but I might think about going short on a significant lower low.
Is gold at a bottom or just getting near a bottom?? We’ll see. pic.twitter.com/cA7YVkcRQU

Jeff Saut pointed out a head & shoulders in oil, with a target of $68 basis CL 201505 NYMEX pic.twitter.com/gAYPVsQc6R

Russell 2000 (small caps) bumping against an upper trendline pic.twitter.com/2RHsaQzQBU

What will make me change my position? Confirmed significant breakout by all of the major indexes, then it becomes “don’t fight the tape”.
Jeff Saut is expecting an upside breakout and run to the upside, but has the warning of watching for an upside failure
SP500 (SPX) is having problems breaking tops trendline pic.twitter.com/3pdRPNIfK5

DJ Industrials broke tops trendline. Next up should be a new high pic.twitter.com/wie8kRyX3f

I think I’ll watch RUT for weakness. It has an easily understood wave count at the moment. pic.twitter.com/rfKi2Fr01o

A little longer term view of the Yen (inverted) pic.twitter.com/EOecge6kVW

Yen decided it didn’t like going up, so now it’s going down (yen inverted in all of my charts) pic.twitter.com/xX0OtUPYdN

Alternative to chart’s count is that step 4 is incorrect. Pitchfork may be 1 long step with NO other steps within it. pic.twitter.com/wARdE6nPoy

SPX LONG TERM = RAISE CASH POSITION SPX SHORT TERM = ONE MORE STEP UP & THEN SHORT BRESSERT’S MONEY MANAGEMENT – wp.me/p1DRwF-332
Longer term view. How step 5 ends could be a surprise, or it could end peacefully and predictably. We’ll see. pic.twitter.com/RMyrKe7NYr

Shorter term view of count. End of white 3 is also end of yellow 3. pic.twitter.com/TBABIuC9oQ

Looking for a repeat of those past 5 of 9 occurrences. Insignificant peak & then decline. A significant decline is possible, more than 15%
Dana Lyons: market’s upside “breakout” resulted in tops shortly afterward that would predominantly hold for the following year
Dana Lyons: 5 of the 9 occasions, the new highs were very small and very short-lived
Dana Lyons: 2 months later, 8 of the 9 instances saw the S&P 500 not only higher but at a new 52-week high.
Dana Lyons stated: This (formation) is a historically rare feat as there have been just 9 other similar periods in the S&P 500 since 1950.
The urge to short has passed for now. Dana Lyons’s stated: Similar S&P 500 Ranges Have Always Resulted In New Highs, But…
If Yen is reversing, perhaps stocks are ready to breakout to upside? We’ll have to watch the yen closely for signals pic.twitter.com/rpc6yGNzum

Yen taking a time out, perhaps a turn in the trend of recent days?? I could call this a 5 count. pic.twitter.com/9QoHxqKxyD

Yen rally 90 minutes before market close. pic.twitter.com/hiXNoR0XZM

I’m doing nothing as I wait to see if the short is triggered or not. Patience is a great virtue on Wall St.
Define myself as more skittish than bearish. Bull or bear confirmation should not take long


SPX LONG TERM = HOLD SPX SHORT TERM = ALMOST SHORT (see notes below) BRESSERT’S MONEY MANAGEMENT – wp.me/p1DRwF-332

Short trigger may never be pulled by a burst upward through the upper limit line.
Chart of SPX futures. Present move appears to 3rd step up, but step not finished. Waiting and watching for a reversal pic.twitter.com/gMjlhePcZv

Gotta say that I get crazy sometimes and take chances, but they are always backed by stops to limit the loss.
Forthcoming weakness could be confined to large caps with some sympathy moves by smaller caps. Smaller caps are much stronger than large cap


A short with a stop above the upper line, short placed AFTER reversal of NEXT approach to the line – CRAZY MOVE pic.twitter.com/yIoTzAEh41

Why do I have short term “Stand Aside”? Because of the “possibility” we could have another leg down in the correction pic.twitter.com/K2EeDgwLWL

Why do I have a long term hold? Because of the possibility that the uptrend that began Oct 2011 is “almost” finished.
Longer view of the Yen. It looks like we should a 3rd step up, which could have begun today ??? pic.twitter.com/qrkW7DHtj1

Yen had a reversal mid-day. Reversal took place after a 3 count downside. If not a 5 count, we should rally more. pic.twitter.com/ECuqFnnLox

1973-1974 SPX earnings up, market fell 50% 1975 33.66 1974 40.21 (4th quarter earnings decline, market reversed) 1973 41.46 1972 35.46
SPX LONG TERM = HOLD SPX SHORT TERM = STAND ASIDE TWEETS UNNEEDED WITH STATIC MARKET BRESSERT’S MONEY MANAGEMENT – wp.me/p1DRwF-332
Inflation is too much money chasing too few goods Conversely Deflation is not enough money for too many goods
China’s exports negative -15% year over year, Imports negative -12.7%
Today’s statements regarding inflation & earnings are fundamental viewpoints, which can take a long time to affect the market (if at all)
Switzerland’s inflation rate since 2007 pic.twitter.com/Bpk3j9P0ML

Euro area’s inflation rate is negative pic.twitter.com/qWkOrNaU3S

United Kingdom inflation rate is zero pic.twitter.com/QmljOIX0oB


France’s inflation rate is now negative pic.twitter.com/l5dJIyq6Pb

Developed countries have low bond rates, inflation is falling dangerously low threatening deflation, have central banks lost control ???
Solid line Japan inflation rate, dotted line US inflation rate Yen devaluation pushed inflation up, but now falling pic.twitter.com/BoF278wDhG


Small caps (RUT) are having a good time while large caps wallow. pic.twitter.com/gHxqdxv4i3

Messy looking step 5, probably indicative of a SLOW saw tooth topping formation. Lesser gains likely ahead. pic.twitter.com/7EPzQsVjm0

We’re watching the overhead resistance line. Looks like a triangle has formed pic.twitter.com/ftdV3vRbfm


The Yen is indicating that we could have weakness in our market. They’ve been in lock step for a very long time pic.twitter.com/mC3aaMBB8C

The lion’s share of the uptrend that began in Oct 2011 is behind us. We are “probably” in a long term topping phase with smaller gains ahead

Fibonacci lines providing support and resistance pic.twitter.com/CPPpT57uQ4

Yen is breaking to the “upside” and should mean the stock market should follow. pic.twitter.com/uKY3jRzipD

Long Term Count – Step began Oct 2011. Yellow 3 probably has further to go, but it’s ragged compared to earlier steps pic.twitpic.twitter.com/KYsTajYgdD


Yen changed direction quickly and isn’t saying market rally anymore. pic.twitter.com/nWt3lCNfVx

Yen direction is “presently” indicating a rally for our market. pic.twitter.com/Ovx0a2oDnF

A dull market trending down. Not much to say about this situation other than wait for any breakout (up or dn) on relatively higher volume.
A consolidating market for the large caps. The small caps “look” OK. When small caps turn south, watch out pic.twitpic.twitter.com/cVtyfZ7Efx


This is an old bull market & somewhere along the line, we always have that interruption that builds pessimism & refuels the bull’s strength
Time out for a correction. It’s taking place just short of the prior high. pic.twitpic.twitpic.twitter.com/2lNckAWNYY


After 3 count, expect a good rally. Rally needs to rise significantly above late Feb high to reinforce bull market pic.twitter.com/VqaIAAGAvw

Book was published in 1917 & it’s a great read today. Not all good stuff is published today. Read it & be surprised amazon.com/One-Way-Pocket…
Yen showing what you “might” expect on Monday. Looking at this chart on Sunday will tell a more complete story pic.twitter.com/f7v85zciLt

Bloomberg headline: “Weak Jobs Gain Gives Fed New Reason to Delay First Rate Rise” Where bad news is good news, but how long is that true?
After jobs report came out, SP 500 was down 20 points and DJ Indu was down 166 points. Monday morning will tell the tale of continuation OR
Dow Theory The DJ Tran penetrated my warning level. The DJ Indu are still above this level. stockcharts.com/public/1169350…pic.twitpic.twitter.com/eklQGBSU3T


Yesterday said: “line & market are merging & might turn line red . . . Impulse is important” Big impulse on Fri morn pic.twitter.com/XqXHbbRCf6

@focus1234567 Thanks, hadn’t gotten around to that yet.
STATUS – CAUTION SHORT TERM BUY CHANGED (3/31 @ 3:30 PM EDT) BRESSERT’S MONEY MANAGEMENT stock-market-observations.com/category/gotta… … …
Char #1 has the best interpretation Chart #2 has the worst. It’s likely we are chart #2, which means more down ahead pic.twitpic.twitter.com/BNNnRUdneu


Indicator still green but the line & market are merging & might turn line red, but for how long? Impulse is important pic.twitter.com/4Z9fg7NIVr

Fibonacci lines at work providing support and resistance. pic.twitter.com/GT6rQeUI89

A POTENTIAL wave count that warrants caution. pic.twitter.com/yvk9m6a0bb

This Yen chart should look very familiar when compared to the SP500 chart (including today’s chart). pic.twitter.com/XAcPEzNQ5D

The 60 minute ADX has used up its buy signal by not doing too much. pic.twitter.com/QtoSsn1Gbx

Sometimes me sits & thinks & sometimes me just sits When unsure what to do, I sit & think & let the market go on by pic.twitter.com/oLvg6AcuvV

I described this as on the knife edge yesterday & it turned green during the night. But how long does it stay green?? pic.twitter.com/8cfbSsFFpX

STATUS – CAUTION could be changing SHORT TERM BUY CHANGED (3/31 @ 3:30 PM EDT) BRESSERT’S MONEY MANAGEMENT stock-market-observations.com/category/gotta… …
Yen moved to the upside late today. Large caps ignored it for now, but small caps liked it. pic.twitter.com/qJ7ZOkXfv5

Small caps ($RUT OR IWM) broke out to the upside today. pic.twitter.com/3ZEm1Tju7a

One indicator sitting on the knife edge of decision. The ADX is using up some of its buying power moving sideways pic.twitpic.twitter.com/srxgh2DuYh


STATUS – CAUTION SHORT TERM BUY IS CHANGED TO CAUTION on 3/31 @ 3:30 PM EDT BRESSERT’S MONEY MANAGEMENT SYSTEMstock-market-observations.com/category/gotta…
The 60 minute ADX lines are in the buy zone, but you gotta have willpower to execute it. I’ll stand by and wait a bit pic.twitter.com/yMB1tKVLhU

Compare the SP 500 futures chart with the Yen chart. Notice any similarities? pic.twitpic.twitter.com/sOHq91OINp


The indicator that keeps showing me up is still in the red except for very short moments of turning green. pic.twitter.com/8avdxWlnx3

Mar 2015 – 113 TWEETS
Finished 2nd step down in larger step 3? 3rd step down could be a double bottom, but I doubt it, something’s wrong!!! pic.twitter.com/gToQ2Cogiw

The indicator below would have gotten you in around 2052 and out around 2068 for 16 easy points. pic.twitter.com/SIJrjRRdop

Once again this #$@&*%$# indicator was smarter than I was. Told you it had a good record. pic.twitter.com/R8YLAvq9lh

Read the following money management system. It’s the BEST system for managing short and long term profits stock-market-observations.com/category/gotta…
BRESSERT’S MONEY MANAGEMENT SYSTEM wp.me/p1DRwF-332
We’ll try another buy after we have finished larger 3rd step down. That one “should” have higher confidence, unless we have a 5 step down???
Yesterday when I said: “We could have begun a correction a few minutes ago” You should have run like hell with your 1 day profits
STATUS – CAUTION SHORT TERM BUY IS CHANGED TO CAUTION on 3/31 @ 3:30 PM EDT
I’m VERY caution here. We are in 2nd step down of larger 3rd step down (began on 3/2/15) or in 2nd step of 2nd step pic.twitter.com/AghxwkfXD9

This indicator is threatening to turn red. We could be forming a triangle after the Monday high??? pic.twitter.com/G3JJs6h9kG

If rally doesn’t rise above yesterday’s high & significantly penetrates 2062 ES contract, status change is likely pic.twitter.com/1SxyL2yjG5

We’ve lost 38% of gain since Sun low. Good point to rally. Step 2 down just completed??? pic.twitpic.twitpic.twitter.com/Ib4LAh9KCv


Read somewhere today, market hadn’t had 2 up days in a row in many weeks. Think we can break the hex tomorrow? We’ll see in few hours
Correction under way. If Fibonacci lines hold, look for support around 2074 or 2066 ES June contract. pic.twitter.com/vmLLfZxGwS

We could have begun a correction a few minutes ago. I think step 1 down already occurred followed with a higher high pic.twitter.com/khc7oSf2gL

Yen began moving in right direction late last night (after my status change). If it continues, it will be bullish pic.twitter.com/10wDpxpB3t

STATUS – SHORT TERM BUY – changed on 3/29 @ 10:30 PM EDT ES futures, stops below correction lows Caution until exceed 3/23 high & 2/25 HIGH
Chart set #2 Same chart as posted earlier but each succeeding chart has less volatility pic.twitpic.twitpic.twitpic.twitter.com/zZD8NvrGsM


Same chart as posted earlier but each succeeding chart has less volatility pic.twitpic.twitpic.twitpic.twitter.com/ORqMNilgoi


Envelope’s downside limit showed the bottom plus it was a double bottom around March 10. pic.twitter.com/1G1LElRSzs

@focus1234567 Not possible because it comes from a Windows data flow chart, I’ll post variations of it showing less and less volatility
Isn’t this irritating? It issued a buy signal before I did & it’s just a dumb robot tool (with a really good record) pic.twitter.com/ELx3HtZ3Cj

NASDAQ is not leading. Perhaps it is bogged down with a wave count correction. We’ll see later. pic.twitter.com/SMviKn62Yv

STATUS – SHORT TERM BUY – June ES futures raise stops below important rally lows Use Caution until we exceed 3/23 high & then 2/25 HIGH
SP500 futures broke out last night. Few were awake or aware of my status change last night, or you’d be richer today pic.twitter.com/ibRcAeycUJ

Chart update after break above Friday’s peak. pic.twitter.com/sjqUKGS3ap

Upside failure is important to watch for. I have seen many breakouts appear to fail & drop back considerably & rise dramatically next morn
Looks like ES futures are breaking out to the upside for resumption of rally, but caution is high. pic.twitter.com/gic7cZDnOO

STATUS – SHORT TERM BUY – June ES futures stop below important prior futures low 2047 or 2040 depending on your risk tolerance Use Caution
The week is over without a calimity. Oil is saying that nothing bad is going to happen this weekend in middle east pic.twitter.com/FAERnedS4b

Another view of the previous trend chart showing only the closing figures pic.twitter.com/6jGjhUQCCE

Since Oct 2011, every correction has been a buying opportunity. This will end & there will be some unhappy people. pic.twitter.com/xnFLu3YLO8

Double Bottom – (1) a higher low, (2) same as prior low, (3) or a fake-out lower low. Fake-out triggers lotsa sell orders & a quick reversal
If nothing goes wrong over the weekend, we are probably headed for a higher low. If true, we should resume the rally pic.twitpic.twitpic.twitter.com/pwplrJ0XVz


The DJ IND adv-dec line didn’t confirm the early March high, but SP 500 adv-dec line did confirm its late Feb high pic.twitpic.twitter.com/Qsoveku1ZW


NYSE new highs are declining as expected for a correction, but new lows are NOT rising, which is a good sign for now pic.twitter.com/szldUOYiq0

DJ TRN are close to warning level & DJ IND are close to “irritation level”. Major DJ Theory signals are further down pic.twitter.com/3hBrtbgoOB

Not big enough rally to qualify as trend break. Watch for another bottom (higher, lower or same) & then bigger rally or LOOK OUT BELOW????
Rally after ending step down today. Rally should break channel formed, 2/23 until today. Must break above Feb highs pic.twitter.com/uKeiYx3y9O

Put Call ratio is neutral at the moment so there is no help here for an overdue rally. pic.twitter.com/xShwzZ6ArA

3 sectors were crushed today. They are: $XBI (Biotech) -5.22% $SOXX (Semis) -4.90% $TAN (Solar) -4.26% -> stks.co/a1wvo
See page 6 & lower highs made by large cap indexes. Higher $ responsible but $ down now with stocks?? See all chartsstockcharts.com/public/1169350…
Mini-Dow Theory signal occurs with 100 pt drop in Industrials. This wouldn’t be a full blown signal, but a warning pic.twitter.com/QCXJeQBmnz

3rd consecutive mini-Dow Theory non-confirmation since Feb. 1. Lower low by TRN 2. IND high 3. TRN lower low today pic.twitter.com/mCK3w3P2My

@focus1234567 wait awhile, you pointed this out and I was going to post the chart in a few minutes.
A lower high and now watching to see if a lower low takes place. pic.twitter.com/AOhBE3m6DK

Two new charts added today PAGE 5 CHART 0 PAGE 5 CHART 1 on my chart page stockcharts.com/public/1169350
I have a status tweet at the top of my page.
CURRENT MARKET TREND ANALYSIS wp.me/p1DRwF-32I

#OFR Valuation measures are nearing extreme highs. Hopes are this time will be different. streettalklive.com/index.php/blog…pic.twitter.com/SHCWbsV1Oc


At 2.1, the median price to sales ratio on S&P 500 stocks is at the highest level in history. stks.co/h210Z pic.twitter.com/tMa22b8tnw

Price to sales (last tweet) is not an outlier. Median P/E also at highest level in history. stks.co/d1w34 pic.twitter.com/bKgek1hAMW


“@edwardrooster: @JLyonsFundMgmt I’m not qualified to call tops but when I see more ETFs (leveraged) + teenage pundits, deja vu does emerge”
This line is a little more accurate and has fewer whiplashes in its signals pic.twitter.com/ZjKPoJwMIL

After double bottom on 3/13, red lines have marked approx correction bottoms. But I’m not a fan of double tops, 3/23 pic.twitter.com/Nk4KNC3qxi

Fibonacci lines based on March 2009 bottom. Current line is providing underside resistance to further advance. pic.twitter.com/uhFoXh0c5N

“Possible” Transports projected peak area using an inverted head and shoulders from 2009 pic.twitter.com/geebpPMPZe

@dwdyck1 YUP, I have the Yen charted to move in the same direction as our market. It makes it easier to relate the 2 charts directions
One “possible” wave count of large step 3 up since late 2011. pic.twitter.com/ygTPhy1jGf

Transportation advance since 2009. It has been correcting since late 2014. pic.twitter.com/AighX092X7

SP500 advance since 2009. There was a violation of the advance in Oct 2014 and the next break could signal the end. pic.twitter.com/Zoq1d03Q8Y

The Yen hit a convergence of two lines recently and slowed its advance, weekly bars. pic.twitter.com/NSudI18kCw


We got a mild sell signal in the 60 minute ADX recently. The daily ADX is much more reliable though. pic.twitter.com/dhjIbG1N3X

Yen is not supporting an advance in the large caps anymore as it moves downward. pic.twitter.com/upaXk5OaYg

Smaller caps are all bumping up against the upper line of their envelope. pic.twitpic.twitpic.twitpic.twitter.com/oHIMCCthI3


Last week I was located in a miserable location for cell reception & couldn’t post. If I could post, I would have had a lot of questions???
I will feel better when the larger caps play catchup to the small caps, but for now I will scratch my head & wonder about the wave count ???
Smaller caps have made new highs, while large caps struggle. Opposite of this situation would make me very cautious? pic.twitpic.twitpic.twitpic.twitter.com/5cLeR3iwI9


Daily gold etf chart says we are close to a bottom, or we have hit it. Watch it closely pic.twitter.com/iX0mmRGCG6

EVERYONE is buying index funds or ETFs. Makes me wonder if there is a flip side to the indexing mania??????? I’m an indexer – index futures
Stats that attracted me to Sequoia fund: Years Up: 38 Years Down: 6 high avg return, above avg performance bad year, management continuity
Sequoia fund is my wife’s investment for when I croak or can’t count my fingers. I got in a few weeks before they closed the fund.
Anyone owns or watching Valeant Pharmaceuticals? Bottomed in 2008 at $7 and is $200. I watch it cuz it’s largest holding of Sequoia Fund
Market is performing as expected, made the double bottom and took off to the upside. Some indexes don’t have far to go to make new highs
WOW!!! Anyone looked at the German DAX recently. It looks like it is trying to go parabolic. London looks sick. pic.twitter.com/59hFKKAh0i


For #Vancouver‘s rich kids, a boring #Lamborghini or #Ferrari is not enough scmp.com/comment/blogs/… @SCMP_News pic.twitter.com/kjjg6oCPhk


CHART: Wealth is rising, but median family net worth hasn’t budged in a quarter of a century. pic.twitter.com/T5r3EnEuu1

Wall Street bonus pool is roughly double the total earnings of all Americans who work full time at Fed minimum wage. nytimes.com/2015/03/14/ups…
@focus1234567 Yet the SPX futures peaked on Feb 25


60 min ES, YM & NQ futures with Fibonacci lines, ES & YM stopped near a double bottom, while NQ went lower pic.twitpic.twitpic.twitter.com/UzaLKcUGry


@focus1234567 As usual it’s not clear, do you start count down at Feb 25 or Mar 3? It depends on index, divergent high by Russell microcap
Double bottom coming? Double bottoms can end higher or lower than the prior bottom. Ending lower generates lotsa bears & lotsa selling
It looks like the Yen is going down into its 3rd step down and taking our market with it. pic.twitter.com/94NzY30wnI

60 minute envelope shows that we are at or near a rally junction. I’m watching for a double bottom. pic.twitter.com/aNzfkbpLEL


BREAKING: Someone leaked a copy of the letter the #47Traitors GOP Senators sent to Iran pic.twitter.com/htFxiiBFO7

Latest data from Thomson Reuters/PayNet Small Business Lending Index pic.twitter.com/HSe6CTMKUu

@focus1234567 Kinda, went to Morro Bay for a week.
@focus1234567 Yup, I got back just in time to not screw it up.
If I only nailed all the highs, that would be perfect. Continues to be a “buy the dip” mentality. Watch out for those lower highs though
Yesterday I said: Market could be bottoming, 5 day TRIN in green, ADX is green, most oscillators are green, wave count looks good for rally
Gonna pat myself on the back because yesterday I nailed another low. I forget how many consecutive lows that I’ve called, but it’s a bunch.
Germany forges ahead with soaring new highs, while London fell out of bed yesterday.
And the wave count looks plausible for a rally. But further bottoming could take place at later date for a longer lasting rally.
Market “could” be bottoming 5 day TRIN in green zone, ADX is almost in green zone, most oscillators are in green zone pic.twitpic.twitpic.twitter.com/fTplFvHoxi


Possible ending to step 3, but need to watch for a stunted rally & more steps down. Could have a double bottom too. pic.twitter.com/jk2nhzHaa5

Looking for higher highs to verify a rally has started pic.twitter.com/8WNspofSe7

Want a rally tomorrow? Actually it’s better if we dive deeper & generate a heavy oversold & then rally. But we’ll take what we’re given
Oversold Oscillators – The advance decline oscillators, short & long term, not as oversold as the volume oscillators pic.twitpic.twitter.com/FzTzLsVF12


3/7 – “but might need a little more oversold to kick them solid green” That was an understatement I’m back and on patrol for another week
Oil production prices throughout the world. pic.twitter.com/wlQ2YEHjs2

Oversold oscillators are in the “area” of a bounce, but might need a little more oversold to kick them solid green pic.twitpic.twitpic.twitter.com/tHYMYVrLWS


It wasn’t a 90% down day on Friday, but it was in the area. pic.twitter.com/ZDGBWKnIHk

STRONG JOBS REPORT PUSHES INTEREST RATES SHARPLY HIGHER AND TREASURY BONDS LOWER pic.twitpic.twitter.com/Hzc1hp1yg3


If prices tumble, that is likely to happen sometime after July 1st, because that is the end of the seasonally strong period. – Mike Burke
If breadth indicators recover, recovery should begin soon because we’re in strongest period of 4 year Presidential Cycle – Mike Burke
Strength of the breadth indicators peaked about a year ago. Either they will recover or prices will tumble. – Mike Burke
Looks like 3 steps down in the Russell 2000 – small cap, but NASDAQ 100 looks like only 2 steps down. We’ll see later pic.twitpic.twitter.com/DoMR4w8FLi


Dow Jones Industrials hit a new high recently & Transports didn’t. Non-confirmation in effect & correction may result pic.twitter.com/bX2C8B18zT

The only thing that could derail this market is a Black Swan Event and you usually don’t see those coming in advance.
We have lower highs & lower lows. That’s a correction. Overbought condition is obviously ready to be worked off. No LONG term top in sight
This rally looks like it has the power to make new highs. I’m basing this on the present wave count since the bottom early today.
Feb 2015 – 122 TWEETS
Market overbought. March which, seasonally, has been one of the best months in the 4 year Presidential Cycle. – Mike Burke
End of the diagonal resulted in a correction pic.twitter.com/OYH4OdVWjT

Fibonacci ray for NASDAQ, lines show both support & resistance with possible termination on 2/26, next line 4 support pic.twitter.com/OpBh4YyU4Q

Dow futures Fibonacci lines. Notice a termination point on underside of one of the lines where the correction began pic.twitter.com/sqLc0esflZ

A longer look at the present activity and step count on the SP 500 futures contract. pic.twitter.com/hl5pNk94oe

The correct step count is ???? If 5 is finished, we will have a decline that will break the yellow upward channel pic.twitter.com/UtolhG2dVu

5 day line is still green, correction in progress, more decline & it will turn red, but for how long & how deep?? pic.twitter.com/G2lICooosb

Yellen says can be patient to normalize policy & it’s unlikely economic conditions will warrant increase for at least next couple meetings
Why global central banks want to create controlled inflation, 39% countries have debt-to-GDP of over 100% – ZeroHedge pic.twitter.com/GhXNHcb0GB


None of this precludes the possibility that correction can’t take place at any time, but it does say buy the dips until important tops form
Mid caps have formed a new upward channel pic.twitter.com/4cfe6F2p7O

Mid caps are very strong. The Russell mid cap index is stronger than the SP mid cap index. pic.twitter.com/lcXFYqRC7t

Today small & mid caps are making new highs. Micro caps lagging but not meaningful until small & mid caps join micros pic.twitter.com/5dOZOmh6zn

Today 3 large cap indexes are making new highs, the mood is buoyant with no meaningful peak ahead. pic.twitter.com/vKkyriUMNR

3 large cap indexes didn’t struggle with a peak in June and all made new highs in Oct 2007. No warning was given. pic.twitter.com/ZHlWCUUufY

Micro, Small & Mid caps shown in 2007. None had a new high in Oct 2007. All struggled with a peak in June to mid July pic.twitter.com/MfrOOtLpif

Micro, small & mid caps are doing better than 3 large cap indexes pic.twitter.com/QDjJRCthQS

A green ride except for the correction from 2/15 to 2/20 pic.twitter.com/a2W2l3YsyR

A possible wave count, although a single correction running from 2/13 to 2/20 with step 2 just beginning is possible pic.twitter.com/iizpWqcF8v

One possible wave count My wave counts explained stock-market-observations.com/2011/07/02/odd… pic.twitter.com/m2omZJ4ddK

The NASDAQ (NQ) has recently been stronger than the SP500 (ES). NQ is hugging closer to its peak than ES. pic.twitpic.twitter.com/CckXtAPasX


Almost the whole world has interest rates at 0% pic.twitter.com/Vq70o1VTRw

Consensus trends on inflation and deflation pic.twitter.com/e53zW2FtN4


Everyone wants to know how low prices can go before oil projects start shutting down, particularly US shale projects. pic.twitter.com/QCX7Bc0MvD

Federal Reserve has cut its policy rate by 3.9 percentage points in the six recessions since 1971. That would not be possible today
Europe has negative interest rates, encouraging spending & CHARGING to put money in the bank. Mattresses instead of banks are looking better
Deflation makes it harder to loosen monetary policy. As inflation falls & turns negative, low real interest rates are harder to achieve
Ultra-low inflation is occurring in USA, Britain & China with inflation rates less than 1% & looking like a sign of entrenched weak demand.
Both of these indicators are now going in the right direction pic.twitter.com/o8i0LgA2hL

Not unusual to follow a Dow Theory buy signal with a small correction within a few days of the signal.
DJ Trans lagging & haven’t made a new recently. Wouldn’t take much to make new high. Consequently, no Dow Theory buy signal affirmation YET
DOW JOINS US INDEXES @ RECORD HIGHS NASDAQ NEARS TEST OF ITS 2000 RECORD HIGH GERMAN DAX HITS RECORD HIGH BRITAIN IS CLOSE TO A NEW RECORD

Junk bond sentiment has declined significantly without a corresponding decline in stocks. Rare but 1995 did this too pic.twitter.com/BrUMLuaZWa

Unemployment claims have lost their luster recently. They’re not bad, just lost their momentum for lower claims. pic.twitter.com/vf5Q0f4EDe

Has the stock bond ratio already written the epitaph for this leg of the bull market??? pic.twitpic.twitter.com/hReIkAJZEO


London FTSE index is “almost” at an all-time. It has struggled for 15 years trying to better the Dec 1999 high pic.twitter.com/0mH4YcphXS

DJ Industrials missed a new high by 6 points recently. DJ Transports are further back from there late December highs pic.twitter.com/ZbrNqGzAiA

Ratio of consumer discretionary to consumer staples indicates risk on attitude. pic.twitter.com/txcqLx3u2k

Is this signaling a correction?? We’ll wait and see. pic.twitter.com/3aaAqJLiBW

Ratio of rising consumer discretionary sales to consumer staples is risk on. Falling ratio is risk off. Slowing ratio is transition period
American Institute of Architects has lower billings with lower lumber prices indicating possible slower housing ahead pic.twitpic.twitter.com/yM2J248UET


New highs are lagging as most indexes are at new all time highs. Give them a couple days to catch up, or fizzle. pic.twitter.com/p41p0Yhs17

Market isn’t open today, but the futures are open (Europe is trading). ES futures are down 7 points for the SP500. pic.twitter.com/MKJvSDg7kw

It appears to be a completed 3 steps up in stock / bond ratio. This ratio can peak many months prior to stock market pic.twitter.com/cTIBuJyT1q

Every time the number of new highs spikes up to very high levels, it’s followed by a correction pic.twitter.com/eQvABqCCd5

Most of the broad indexes are at all-time highs. A laggard is the DJ Industrials. pic.twitter.com/gkyF6CtOmo

Another wave count since the mid-October bottom. Another interpretation is possible, but forget about it for now. pic.twitter.com/McF5Mlqtps

Look at 17 adv – dec lines on Page 8 Charts 0 thru 2? Only 1 is at a new high (Materials). Small divergence in placestockcharts.com/public/1169350…
Hand holding is unnecessary until we’re at reversal point. We’ll watch the future correction for depth & significance to the overall trend
Constant chatter re: stock market is noise to confuse the investor. Investors have too many problems trying to sift through useless chatter.


What appears to be the present wave count. pic.twitter.com/SCrTYghTxC

Bloomberg Re: Jeb Bush “The 4 Percent Solution”. authored by Glassman no stranger to excessive optimism, author of 1999 book “Dow 36,000.”
Bloomberg Re: Jeb Bush Bill Clinton’s second term, the biggest boom in recent memory, saw growth of just about 4 percent
Bloomberg Re: Jeb Bush growth higher than 4 percent has rarely happened in any presidential administration since World War 2
Bloomberg Re: Jeb Bush Policies US could enact achieve sustained 4% GDP growth. Unfortunately, and dangerously, this idea is pure hogwash.
Taking off into 3rd step since 10:50 EST today pic.twitter.com/e999q4jXY8

Going down in a small 3 step currently pic.twitter.com/zDK06WysUy


Fibonacci line in play at the present. Notice how I keep redrawing the termination point on the preceding peak pic.twitter.com/1sVVIcKAkP


Important look at the longer term. Long to short term look at the count. pic.twitpic.twitpic.twitpic.twitter.com/o2U81avWcS


The count resolved itself into my original count. If all is OK, step 3 must exceed high on Feb 6 pic.twitter.com/dNgkSAyB56

Another way of counting the decline since Feb 6. It looks possible cyan 3 down will bottom close to cyan 2 down. pic.twitter.com/MfTPzeWV70

We got the 3rd step down I was looking for, but is it finished? Waiting for a channel break or a perfect count pic.twitter.com/sJESvExJQa

The MA line is undecided, switching back & forth from red to green. The MA line is waiting for breakout or breakdown pic.twitter.com/ROeZrtroYc

4 bottoms at steps 2 & 3 down, and steps 1 & 2 up Is that meaningful?? We’ll see. pic.twitter.com/4ieCkp74R1

1st chart – SP 500 possible wave count 2nd chart – NASDAQ slightly stronger than SP 500, with another wave count pic.twitpic.twitter.com/W26pwq8nDu


Misc charts, Yen rallied Fri declining now, Fiboncci chart lines, 3 count decline fini should have bigger rally ahead pic.twitpic.twitpic.twitpic.twitter.com/8thvoCdx43


I would expect to see new all time highs before the rally is finished that began on Feb 2nd. Then ???? pic.twitter.com/uYAEK3M6tf

The current correction might last longer, such as rally & decline again stopping on another Fibonacci line pic.twitter.com/nBJqBhl3m5

Fibonacci line that looks promising for support. The slope of the MA line has turned negative (red) with Sun decline pic.twitter.com/ZJpl2pj1P2


Don’t you love brokers and their bosses, principles and ethics are so outstanding. reuters.com/video/2015/02/…
The line went red for a short while last night and then turned green at the 3AM EST rally point. Still green for now pic.twitter.com/jvIXfimNjc

After 3rd step up …arketobservations.files.wordpress.com/2013/11/emerge…
I’m gonna be careful Unless we break away to the upside, which although possible doesn’t seem likely
I’ve been looking for another high in the market because that is the 3rd step up since the Dec decline. After 3rd high, I’m gonna be careful
Finish this step and one more and then correct. Just a short distance from the prior high. pic.twitter.com/X2Fr5KHHDr

Was gone all day having a “procedure” done to me. Gave the doc a $10,000 bill (fake) and he stabbed me in the heart. What gratitude.
Market only went a small amount below the Fibonacci line before beginning the rally, which began just before 3AM EST pic.twitter.com/JVo2DMBTcd

Today’s late decline stopped right on a Fibonacci line, but will it stay there? I would guess not. pic.twitter.com/okyOSDhy7D

“ECB Shuts Off Direct Funds to Greece” I think I’ve seen this movie before, but this one may have a different ending.
This line turned red at the close today. pic.twitter.com/gqf3ubIbUh

If I mention corrections doesn’t mean it’s going to happen right now. But it will happen someday & you’ll likely have lotsa long positions
Correction when it comes should last about ⅓ time in rally mode. Almost 6 years up, should have around 2 year decline.
Channel since 2009, breaking middle line will signal significant correction. No idea if lower line will contain it pic.twitter.com/cs8Fr39AQn

Possible wave count. Bull phase ended at 3, extended at 4 & 5. When channel broken we will have a significant decline pic.twitter.com/C9biDrZipt

Walmart Can Crush Amazon on Distribution: Robin Lewis Can Walmart match prices with Amazon becuz of higher overhead costs (brick mortar) ??
World & US economics a constantly moving target & what worked last time doesn’t work next time. This is why economists always get it wrong
Jeb Bush: America Should Achieve More Than Twice the GDP Growth Rate It Had Under George W. Bush – easy to say, hard to accomplish
Greece government may run out of cash on 2/25, said one person who asked not to be named because the figures are confidential.
WTF happened??? I knew someone dropped a bombshell “ECB Says It Won’t Accept Greek Government Debt as Collateral” – big surprise there
Without constant flow of advice I’m useless to some traders, but I KNOW OLD TRADERS & I KNOW BOLD TRADERS, BUT I KNOW NO OLD & BOLD TRADERS
Taking a breather at 78% retracement level & the end of 3rd step up. Also has support from Fibonacci line at present pic.twitter.com/Sb0LT3Bx32

Yen is confined to another down channel. Count for step 5 is iffy, but breaking channel decides when wave has ended pic.twitter.com/xn4AOUdWri

Technical Analysis Investing Trading Small Business Lending Index rallied on the latest reading pic.twitter.com/gAkyoRhLUy

Technical Analysis Investing Trading In the green on these charts pic.twitpic.twitter.com/CFDjm7qNeN


Technical Analysis Investing Trading Extending to the upside after breaking the Fibonacci line pic.twitter.com/LRno6mwd1d

Technical Analysis Investing Trading The Yen is going in the right direction after a morning decline pic.twitter.com/Xt2P4MGgFd

Technical Analysis Investing Trading Might not have much much left for the upside, OR it’s going to have 5 steps pic.twitter.com/8J4Qhm6cdK

OIL The U.S. has supplied 89 percent of the energy it’s consumed this year. That’s up 2 percentage points from 2013.
Technical Analysis Investing Trading Now it’s just as simple as higher highs or lower lows. Which comes first??? pic.twitter.com/yq16mHpmxe

Untechnical Psycho Analysis Get a life Bob
Technical Analysis Investing Trading After close trading in SP500. Don’t know if the count is correct, but watching pic.twitter.com/Cbj0MtQ2zC

Technical Analysis Investing Trading Market turned up almost exactly on the line connecting prior bottoms. pic.twitter.com/D4vFOivhMx

Technical Analysis Investing Trading Gradual retracement of part of today’s rally. Not important until 62% gone. pic.twitter.com/2jE0SyBNpW

Technical Analysis Investing Trading Intraday today, we violated the Dec low, but did not close below the Dec low. pic.twitter.com/3sdCiBMOPR

Technical Analysis Investing Trading Yen is not going in the right direction for a rally in our market. pic.twitter.com/F3WqsAO8kV

Technical Analysis Investing Trading No large put buyers like last big rally. They were right & I was wrong. First time that ever happened!
Technical Analysis Investing Trading Last time rallied big amount, market gave it all back. Be on guard. Bad Voodoo if it happens again
Technical Analysis Investing Trading Should be the end of recent decline. Worst case, it’s the end of step 4 down pic.twitter.com/aCkU33QVtQ

Technical Analysis Investing Trading Higher highs and higher lows pic.twitter.com/6AdiplnfRt

Technical Analysis Investing Trading A close up of today’s action and steps pic.twitter.com/5qo3OBohKq

Technical Analysis Investing Trading This count gives you some reasonable options to watch out for, rally or 5 down pic.twitter.com/qChNLQXhQX

Technical Analysis Investing Trading Wave count, but I don’t like it because 4 and 5 are in the same channel pic.twitter.com/djwKIDN1EN

Jan 2015 – 182 TWEETS
Tweet Update Through 2/1/15 wp.me/p1DRwF-32s
Technical Analysis Investing Trading Dec low (17,067.59) violated during 1st quarter, watch out! by Lucien Hooper pic.twitter.com/yCChMBNus8

Technical Analysis Investing Trading Market declines either end with a BANG or a whimper. A waterfall is a bang and they can fall too far
Technical Analysis Investing Trading From 3 up, I count 5 steps down, which raises fair possibility of double bottom pic.twitter.com/oAOVr7kysy

Technical Analysis Investing Trading Have to wait to see how this saga ends, double bottom or waterfall. Ugly chart pic.twitter.com/tBG6SvXTr6
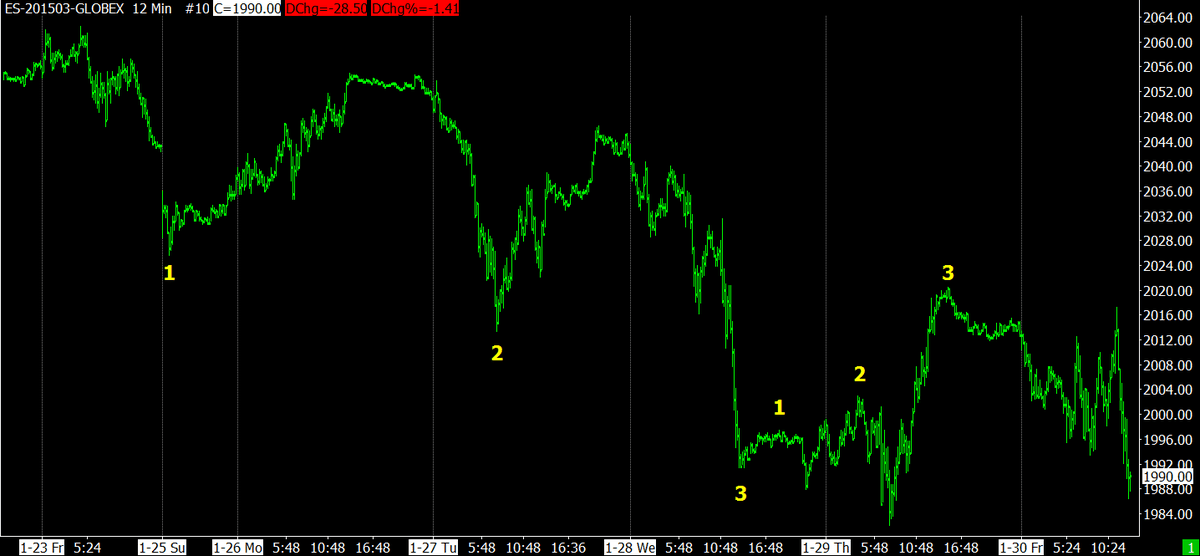
Technical Analysis Investing Trading “The Raging ‘Currency Wars’ Across Europe” safehaven.com/article/36528/… Scary headline, interesting article
Technical Analysis Investing Trading 17.6 yr cycle, dates interesting, 2000 – 2018 has been my projection for years pic.twitter.com/1lAQIiaHUC

Technical Analysis Investing Trading Interesting, never know how true these things are but it makes me stop & think pic.twitter.com/BrXWSe7lWl

Technical Analysis Investing Trading Simple tool that would have you exit market & stay out at 3AM EST last night pic.twitter.com/tg1EKF9A0F

Technical Analysis Investing Trading Yen providing no comfort & might pull US market down. Is yen decline finished? pic.twitter.com/zVIz4zyquE

Technical Analysis Investing Trading A scary count of yesterday’s rally. Bearish if true. Can’t discount possibility pic.twitter.com/janyDpEtxg

Technical Analysis Investing Trading I want to see significant break of yesterday’s peak before the all clear sounds pic.twitter.com/iZ0tYUl6Vm

Technical Analysis Investing Trading A deep correction last night and this morning should be bottoming process, but? pic.twitter.com/SchXrRRJsR

Technical Analysis Investing Trading Until proven otherwise, I’m watching for a rally in bull market, but that attitude can quickly change
Technical Analysis Investing & Trading If we decline SIGNIFICANTLY past yesterday’s low, it will be a bad situation of 4th & 5th step down
Technical Analysis Investing & Trading Hopefully yesterday’s Put buyers established position near close & sold them after GDP announcement
Technical Analysis Investing & Trading We’ll see if most of last night’s slide in the ES futures had already baked in the disappointing GDP
Technical Analysis Investing & Trading Futures are presently near a Fibonacci retracement of 62%. We’ll see if that holds.
Technical Analysis Investing & Trading Only 2 obvious steps up today, but I will call the step complete for now. Next up is . . .
Stock Market Technical Analysis Investing or Trading Wave counting is sticky in extended moves in bull/bear markets. Short swings are easy
#StockMarket #Stocks #Investing #Trading After 3rd step up, correction, or on to 5 steps up. 5 good steps would look good for recovery move
#StockMarket #Stocks #Investing #Trading Today’s rally didn’t break downtrend channel from it’s recent peak. 2 steps up from today’s low.
#StockMarket #Stocks #Investing #Trading GDP revision tomorrow, was reported 5.0% in 4th quarter, consensus says it’s revised down to 3.2%?
#StockMarket #Stocks #Investing #Trading I have called no peaks/tops on Twitter, because I am waiting for an important top to complete.
#StockMarket #Stocks #Trading Have called correctly bottoms 12/16/14, 1/6/15 and 1/29/15. Early & wrong on 1/16/15 pic.twitter.com/TQOnN8FO1V

#StockMarket #Stocks #Investing #Trading Today’s wave count. pic.twitter.com/BXIAEec1yc

#StockMarket #Stocks #Investing #Trading Lots more puts bought than calls. Some don’t believe that was a bottom pic.twitter.com/Pb6myMlpXy

#StockMarket #Stocks #Investing #Trading Have an appointment, gotta go for now. Stops are in for me.
#StockMarket #Stocks Sometimes you don’t see the real rally until step 3, other times nothing really good happens pic.twitter.com/kb5Z6T1ZGp

#StockMarket #Stocks #Investing #Trading Recent trend in the #Yen, propelling our market upward pic.twitter.com/DUxs7Dwzx1

#StockMarket #Stocks #Investing #Trading Touched this line and retreated for now. pic.twitter.com/OGwxWtkvmJ

#StockMarket #Stocks #Investing #Trading Broke #Fibonacci line, which should provide fuzzy support now. We’ll see pic.twitter.com/vDqr2LvFBw

#StockMarket #Stocks #Investing #Trading Breakout and needs to break #Fibonacci line too. pic.twitter.com/dzQhNn7nbm

#StockMarket #Stocks #Investing #Trading Small but labored break of prior high pic.twitter.com/pi2FCCAE5R

#StockMarket #Stocks #Investing #Trading See link for more info on my wave count technique. Blog not updated now. stock-market-observations.com/category/3-rea…
#StockMarket #Stocks #Investing #Trading Don’t use Elliott Wave. I use channel breaks as the final say on wave count pic.twitter.com/2qGM0v9Cuz

#StockMarket #Stocks #Investing #Trading Getting perspective. Longer wave count showing step 3 since March 2009. pic.twitter.com/XzL2G6cr2r

#StockMarket #Stocks #Investing #Trading If low on 12/16/14 is broken, then lower lows will be in effect. Bearish pic.twitter.com/72uKUau9xp

#StockMarket #Stocks #Investing #Trading Waiting for step 3 in much larger step 5 makes me not a BIG bear. pic.twitter.com/jrl5GfFSwL

#StockMarket #Stocks #Investing #Trading FOR NOW, I’ll go with this count. But a lower low switches to other count pic.twitter.com/g5UxHat0i4

#StockMarket #Stocks #Investing #Trading If this wave count is correct, it is undermined how bearish it might be pic.twitter.com/WiDyNcLLkg

#StockMarket #Stocks #Investing #Trading Another wave count for large step 3 down. Higher highs will determine count pic.twitter.com/zR3rvLGy1w

#StockMarket #Stocks #Investing #Trading A step count for larger step 3 down. Stopped on #Fibonacci line presently pic.twitter.com/1XlVE27y2c

#StockMarket #Stocks #Investing #Trading Is step 3 over, has 5 steps down. Now waiting for higher highs to validate pic.twitter.com/kboqGBYpWE

#StockMarket #Stocks #Investing #Trading SPX wave count on downside since 12/29/14 peak. Question, is step 3 over?? pic.twitter.com/icBOk7G6kp

#StockMarket #Stocks #Investing #Trading Thinking step 4 down was decline after step 1 up. In step 2 up presently. Job report was leaked??
#StockMarket #Stocks #Investing #Trading Apple mystique could prevail for a long time. I’m a member of Apple’s unthinking Borg collective
#StockMarket #Stocks #Investing #Trading iPhone falls out of favor, Apple profits crash. Apple’s cash enough give everybody in USA $540
#StockMarket #Stocks #Investing #Trading 69% of Apple’s profit is from iPhone. Apple has turned into a one product company. Dangerous??
#StockMarket #Stocks #Investing Job report increasing recently, bad weather doesn’t raise hopes, good report unexpected & be rally fuel
@Stock_Trend_Chg: #StockMarket #Stocks #Investing #Trading #Futuresare set to rally if jobs report is good, or decline into 5th step down.
#StockMarket #Stocks #Investing #Trading Tonight #SP500 #futures broke the lows made near today’s close. Looks like 4th step down of 5
#StockMarket #Stocks #Investing #Trading See my inflation/deflation charts at stockcharts.com/public/1169350… pic.twitpic.twitter.com/2Odt2D990c


#StockMarket #Stocks #Investing #Trading Duhhhhhh . . . why do we have such absurdly low long term interest rates? Because deflation lurks.
#StockMarket #Stocks #Investing #Trading FED previously described the commodity price drop as “transitory”. Apparently, not anymore.
#StockMarket #Stocks #Investing #Trading Finally someone is talking about deflation, namely the FED, saying inflation is too low.
#StockMarket #Stocks #Investing #Trading Looks like the jobs report tomorrow will tell the tale. pic.twitter.com/lXjxRVC1HQ

#StockMarket #Stocks #Investing #Trading Breaking prior lows & shaking tree to see who falls out. Waterfall here pic.twitter.com/L7vaH0wmWN

#StockMarket #Stocks #Investing #Trading Short term #Fibonacci lines pic.twitpic.twitter.com/zLZMFj9Nc4


#StockMarket #Stocks #Investing #Trading If market penetrates earlier lows & gains momentum, step aside, but if it wanders around – wait
#StockMarket #Stocks #Investing #Trading FED announcements cause schizophrenic trading for 10-30 minutes & then the direction is normalized
#StockMarket #Stocks #Investing #Trading Relative strength on Nasdaq currently, but is it enough to not break low pic.twitpic.twitpic.twitter.com/LLJDtjnyH3


#StockMarket #Stocks #Investing #Trading Watch for #Fibonacci break on current line, breaks diamond too. pic.twitter.com/9zuvVN5qkz

#StockMarket #Stocks #Investing #Trading Watch diamond, 3 steps down & should rally, or continue down with 5 steps pic.twitter.com/Qt95pCwWtl

#StockMarket #Stocks #Investing #Trading We didn’t break the diamond formation that I showed yesterday on this morning’s down thrust.
#StockMarket #Stocks #Investing #Trading 3 steps down & rally. #Fibonacciretracement lines & Fibonacci ray lines too pic.twitter.com/580pzaPNwA

#StockMarket #Stocks #Investing #Trading Diamond occurs at top of long uptrends. Signals retracements with accuracy? pic.twitter.com/hfr6dcrMSR

#StockMarket #Stocks #Investing #Trading Does that vaguely look like a diamond formation? Waiting for breakout pic.twitter.com/UDlMQ36r5y

#StockMarket #Stocks #Investing #Trading Summation index has lower highs since July, while #SP500 made new highs pic.twitter.com/osy2SjZEtd

#StockMarket #Stocks #Investing #Trading Notice % over 200 day MA has shrunk slowly since July 2014 (Mid cap & SPX) pic.twitpic.twitter.com/kW37YTHbw7


#StockMarket #Stocks #Investing #Trading GOLD ETF since 2002 plus #Fibonacci lines pic.twitter.com/eccx15Ayb0

#StockMarket #Stocks #Investing #Trading Chart of VIX since late 2006. Look carefully at some of the early warnings pic.twitter.com/SXxn2mIGMl

#StockMarket #Stocks #Investing #Trading #Fibonacci fan lines from the late 2002 bottom. It appears to be valid pic.twitter.com/rt6kCouhUB

#StockMarket #Stocks #Investing #Trading Informational chart showing DJIA monthly from 1902 to the present. pic.twitter.com/HkPwHh3yt6

#StockMarket #Stocks #Investing #Trading DJ Ind gapped down tonight & is presently down about 120 points (Greece) pic.twitter.com/IMW2xlh5A0

#StockMarket #Stocks #Investing #Trading Greece Effect Tonight – not too bad #Dax is down .74% #FTSE is down .6% #Euro is down .26%
#StockMarket #Stocks #Investing #Trading Long term #fibonacci lines beginning in 1982 pic.twitter.com/sgt5naq8FF

#StockMarket #Stocks #Investing #Trading Long term #fibonacci lines from 2002 bottom pic.twitter.com/CNkwwVHTp1

#StockMarket #Stocks #Investing #Trading DJ Transports projected peak from head and shoulders formation from 2009 pic.twitter.com/zw3yHvZUOu

#StockMarket #Stocks #Investing #Trading #Fibonacci lines for micro cap stocks since Mar 2009 bottom pic.twitter.com/4h5nZI8scq

#StockMarket #Stocks #Investing #Trading Small cap stocks (RUT) in the last step up in this phase of the bull market pic.twitter.com/Y5AJpil9kX

#StockMarket #Stocks #Investing #Trading Two pitchforks defining step 3 up since Oct 2011 pic.twitpic.twitter.com/xrgHhSIAd1


#StockMarket #Stocks #Investing #Trading Step 3 will be finished when the blue line is significantly penetrated pic.twitter.com/hcgrZo2leI

#StockMarket #Stocks #Investing #Trading One possible wave count for step 3, which began in Oct 2011 pic.twitter.com/pgPY3XHJid

#StockMarket #Stocks #Investing #Fibonacci lines at work tonight providing some support pic.twitter.com/nwxzfDr3Wd

#StockMarket #Stocks #Investing Interesting study on weekly #JoblessClaims versus the #SP500pic.twitpic.twitpic.twitpic.twitter.com/JQUxWxQy1R


#StockMarket #Stocks #Investing What effect will Greek elections have on Euro stock markets? Greece now wants debt write-off. Not likely
#StockMarket #Stocks #Investing I see 3 steps down in #London since June 2014 giving validation to current rally. pic.twitter.com/2sMAgEVyFp

#StockMarket #Stocks #Investing #London is close to a break out. London “can” be a future indicator of US markets pic.twitter.com/TQqbT5KQig

#StockMarket #Stocks #Investing Financials are 16% of the S&P 500 & energy 9%. 25% of SP is under pressure & will have reduced 2015 earnings
#StockMarket #Stocks #Investing Germany is at new highs & London is behind & must break through overhead resistance pic.twitter.com/I3o9szOlNn

On Jan 20 tweeted Looks like a small 3 step down today. A rally failure here means 5 down instead of 3 Obviously we never had rally failure
When I say 3 steps down are finished, I’m saying a rally is next. Tweet limitations don’t allow me to say that every time, so it’s inferred
#StockMarket #Stocks #Investing Slow deterioration of stocks over their 200 day moving average as SP500 moves higher pic.twitter.com/TJzqez9593

#StockMarket #Stocks #Investing Markets are working into a good buy spot, but the buy spot does not arrive until Feb or Mar – Jeff Saut
#StockMarket #Stocks #Investing #NASDAQ #pitchfork looks valid & has provided support & resistance since 2009 pic.twitter.com/MUJmOdx5pK

#StockMarket #Stocks #Investing Looks like a small 3 step down today. A rally failure here means 5 down instead of 3 pic.twitter.com/6ynDO9o5fH

#StockMarket #Stocks #Investing Valid #fibonacci trend lines from 2009. Has had predictive value in the past. pic.twitter.com/MTG4kRC8zF

#StockMarket #Stocks #Investing A crude timing #cycle for #JunkBonds(JNK). Is it still relevant??? pic.twitter.com/jgaTVLDa16

#StockMarket #Stocks #Investing Is this #pitchfork valid? A rebound at the moment, but providing further support? pic.twitter.com/m0XwhsOzD5

#StockMarket #Stocks #Investing But watch out for that double bottom in the #SP500. Stay alert as usual.
#StockMarket #Stocks #Investing #Yen warning with lower high on 12/29 We may be in a correction . . . 10% or so, but pic.twitpic.twitter.com/Gs6oyyUBIv


#StockMarket #Stocks #Investing #Fibonacci trend lines since the Oct 2011 bottom Possible #WaveCount since Mar 2009 pic.twitter.com/XsFyFcdual

#StockMarket #Stocks #Investing Since 2009, two different trend lines for step 3 (of 3) pic.twitpic.twitter.com/WZhnRYfVrY


#StockMarket #Stocks #Investing Lately the #Yen hasn’t been pulling the #SP500 into an uptrend. pic.twitpic.twitter.com/Qn80RJdHqB


#StockMarket “An All-Time 1st?: Swiss Market Index Goes From 52-Week High To 52-Week Low In Same Week” – Dana Lyons pic.twitter.com/aT4yjiaFbc

#StockMarket #Stocks #Investing Market is oversold & seasonally the period of weakness . . . should end some time next week – Mike Burke
The Dow Ind & Tran have small lower highs & lows. You can see in the 1st chart on link below. Lots of charts belowstockcharts.com/public/1169350…
#StockMarket #Stocks #Investing One possible wave count since 2009. We have no idea how long step 3 (cyan) will last pic.twitter.com/v9ytOyVaWw

#StockMarket #Stocks #Investing Bank stocks are sick pic.twitter.com/WSDrdhdggB

#StockMarket #Stocks #Investing Large caps made insignifcant lows, smaller caps performed better. We’ll see later pic.twitpic.twitpic.twitpic.twitter.com/gMPNOohVbm


#StockMarket #Stocks #Investing Updated #Fibonacci lines for latest two significant declines pic.twitter.com/5BhYxDHgsC

#StockMarket #Stocks #Investing Another version of the latest #Fibonaccichart pic.twitter.com/tBXIvbBFlU

#StockMarket #Stocks #Investing Updated #Fibonacci chart including the most recent decline pic.twitter.com/OFDxj214Hd

#StockMarket #Stocks #Investing See chart for next #Fibonacci ray for support, around 1970 on ES futures pic.twitter.com/uzxViBdJrv

#StockMarket #Stocks #Investing Jeff Saut is standing aside for the 1st quarter 2015 or until market accomplishes his downside goals (-10%)
#StockMarket #Stocks #Investing Moving envelope shows downside liability for the moment, for short term use only pic.twitpic.twitpic.twitpic.twitter.com/NUS7eH9buG


#StockMarket #Stocks #Investing Moving avg reveals character of market, not big on moving avg, they have their use pic.twitter.com/guT2OHSqtR

#StockMarket #Stocks #Investing Fibonacci downtrend is STILL active, shouldn’t be true if in rally mode since 1/6/15 pic.twitter.com/Y2pbxpXWlU

#StockMarket #Stocks #Investing #SP500 1. Rally from prior low OR 2. 4th step penetrates prior low and waterfalls pic.twitter.com/YbgsYgA2A3

#StockMarket #Stocks #Investing 3rd step down in #SP500, very close to prior low on 1//6/15 pic.twitter.com/r05rHLimSt

#StockMarket #Stocks #Investing Banks are weaker than the rest of the market. That’s never good. pic.twitter.com/KxiG4qj46Y

#StockMarket #Stocks #Investing Junk shows 3 lg steps down, a sm rally followed by a lower high, still INDETERMINATE pic.twitter.com/YNWZexRl3x

I may not be connected to the market for the rest of the week. It’s kinda iffy. If I post, great & if not . . . curses . . . foiled again.
#StockMarket #Stocks #Investing Hmmmm. ES contract was down 44 points in 4 hours (top to bottom).
#StockMarket #Stocks #Investing Market is sub-dividing to downside. Need to re-evaluate count, but presently not connected to market feed.
@focus1234567 trend is up
#StockMarket #Stocks #Investing Yesterday I said “Here we go on the upside after a higher low with a 3 count down” ANOTHER LOW CALLED RIGHT
#StockMarket #Stocks #Investing Here we go on the upside after a higher low with a 3 count down. pic.twitter.com/G1yUTY1zDh

One of the BEST strategists – “weight of evidence suggests the bull market has embarked on a broad topping process that could take its time”
#StockMarket #Stocks #Investing That looks interesting, but we have to see higher highs and lows. pic.twitter.com/Rf7WtiJj0o

#StockMarket #Stocks #Investing “Saudi Prince: Oil will never return to $100” That’s true if they want to keep #shale #oil out of business
#StockMarket #Stocks #Investing Another view of Fibonacci at work. pic.twitter.com/8zesYTVXre

#StockMarket #Stocks #Investing Fibonacci line is “trying” to hold market here. Looks like 4th step down (of 5 down) pic.twitter.com/7FkMxZp07I

Sometimes divorce can be very very expensive. I wondered how you could write all that on a small check . . . 2 lines pic.twitter.com/t6RWjSRLD5

#StockMarket #Stocks #Investing Seasonality: Next week has not been up for over 20 years. – #MikeBurke That says it all except how much???
#StockMarket #Stocks #Investing We’ll see how things go next week. Be watching SP500 futures on Sunday to see if they give any direction
#StockMarket #Stocks #Investing Downtick in “Small Business Lending Index” pic.twitter.com/u0OzCtFdwW

#StockMarket #Stocks #Investing As suspected – since the high made after the jobs report, we have been in a corrrection
#StockMarket #Stocks #Investing Higher high turned out to be a whipsaw and failure pic.twitter.com/EHFmfYkcJ4

#StockMarket #Stocks #Investing Small triangle just broke to the upside, we’ll see if it breaks prior high pic.twitter.com/WDcMhNhHY1

#StockMarket #Stocks #Investing Small triangle forming today, watch which way it breaks out pic.twitter.com/ESPDbYI3Cy

#StockMarket #Stocks #Investing Does this #Fibonacci line mean the decline it’s based on is still alive??? pic.twitter.com/urDNM68nDt

#StockMarket #Stocks #Investing Another #Fibonacci chart, targeted peak on Thursday & approx on Friday pic.twitter.com/8iRJPNJ2S1

No #shale #oil means no #fracking, which means no protests about fracking dangers plus the fracking #earthquakes will eventually subside
Only way to eliminate shale oil is keep prices permanently low. That’s a steep price for OPEC to pay to get rid of shale oil.
Low oil prices “can” eliminate shale oil, BUT when prices rise, shale oil comes right back on the market. Shale is like money in the bank
#StockMarket #StockCharts #Investing Note how the #Fibonacci line targeted the rally peak perfectly pic.twitter.com/lIsmKZMgWA

#StockMarket #StockCharts #Investing I’m waiting for a higher high and above a green line before buying again. pic.twitter.com/5T6dnJb76l

Market didn’t perform right after jobs report, rallied, small decline & failed to make new high, I sold my ES futures pic.twitter.com/lhVzsjbLBM

#Bond #Investing Has #shale #oil #junk #bonds default been factored into price of junk bond ETFs – I don’t think so pic.twitpic.twitter.com/AKhP5MigoH


#StockMarket #StockCharts #Investing #Bond #investors who helped finance America’s #shale boom are facing potential losses of $11.6 billion
#StockMarket #StockCharts #Investing “The $173 billion in U.S. energy junk bonds make up the biggest portion of the high-yield debt market”
#StockMarket #StockCharts One could interpret the chart as a #sawtoothed #top? More of the same makes it true pic.twitter.com/fF7GMr4HOd

#StockMarket #Investor #TrendLines #StockCharts Small caps – 18 months. Mar thru Oct looks like one large correction pic.twitter.com/k4OiLOgHVs

#StockMarket #Investor #TrendLines #StockCharts I might get concerned on the next top because that will be the 3rd top since the Oct bottom
#StockMarket #Investor #TrendLines #StockCharts On our way back to the old highs. Slightly past the 62% retracement pic.twitter.com/Ys694QE2wd

#StockMarket #Investor #TrendLines #StockCharts Reason dollar is rising is that every other currency in the world is falling – John Murphy
#StockMarket #Investor #TrendLines #StockCharts Small caps are performing very well since their bottom on Tuesday pic.twitter.com/StTuEVaECy

#StockMarket #Investors 22 hours ago on Tuesday 1/6/15 I nailed another stock market low. Did the same on Dec 16th too.
#StockMarket #Investors Yesterday I said: “looking for higher highs & higher lows because . . . we’re going to rally” pic.twitter.com/7ZjUwomZWW

#StockMarket #Investors Red trendline has multiple support points & could be a reversal area for the present decline pic.twitter.com/D5HeVHSGug

#StockMarket #Investors Long term #fibonacci lines and wave 3 possible peak pic.twitter.com/B5b6R07HRn

#StockMarket #Investors #Fibonacci lines & count for downtrend. Higher highs above 2017 #SPX could signal reversal pic.twitter.com/S9Z0w35QrK

I would think we would have 1 more peak before anything disastrous took place. Sometimes the best laid plans go awry pic.twitter.com/kpwJ9DL0W5

We could be in rally mode. This rally should be tradable. pic.twitter.com/yu5iSvW6wq

Pay attention to market. Right now I’m looking for higher highs and higher lows because I think we’re going to rally.
“Downside surprises on #inflation are far from over. That’s probably going to be the very important theme for the year.” – #DEFLATION
The out of control price decline in #oil could cause a #FinancialAccident. If the accident is big enough, it could be CONTAGIOUS
#StockMarket #Investors How the count looks in the market. It’s going for 5 thrust channels down and we’re in 4. pic.twitter.com/e1j4y0Nsnn

#StockMarket #Investors Yesterday I said: “Finished last step down . . . it’s rally time” I couldn’t have been more wrong.
#StockMarket #Investors Well . . . the #yen WAS going in the right direction for a rally pic.twitter.com/OWlkOMq3ii

#StockMarket #Investors #Yen is going in the right direction for a stock market #rally pic.twitter.com/CvplXiPiYR

#StockMarket #Investors Finished last step down & that means it’s rally time. It’s a slow start just like last time pic.twitter.com/I7RLxMsqyd

#StockMarket #Investors The next 6 months are, by far, the strongest 6 month period in the 4 year Presidential Cycle – by Mike Burke
#StockMarket #Investors See my charts from #StockCharts at the link below stockcharts.com/public/1169350
#StockMarket #Investors 3rd chart, #NASDAQ is turning up. 1st chart #SP500, 2nd chart #DowJones #Industrialspic.twitpic.twitpic.twitter.com/LnvmiAodbt


On 12/31 wrote #StockMarket #Investors I think . . . most of the step is probably behind us Today had bottom signs pic.twitter.com/TNZ8I2qwXq

Lobbyists . . . the bane of government decisions. Cartoon shows lobbyists are hard at work for the banks. pic.twitter.com/USN2GPwXRJ

I’m a believer in Glass Steagall legislation. 2008 gov’t bailouts teach banks they are invulnerable & needn’t worry pic.twitter.com/J8Tyd9COYe

Cartoon is showing that “History always repeats, only the details change” pic.twitter.com/6N4wK7Xsid


Leave A Reply