Tweet Update Through 2/1/15

02/01/15 . . . by Bob Karrow
- If you aren’t familiar with my unorthodox wave counting method, there is a simple explanation at the beginning of the glossary. The glossary also contains lots of other details (explanations) that don’t appear in the blog.
- My charts consist of various indicators and index charts (short to long term), but the theme is concentrated on the items that Paul Desmond warned about in his paper, “The Warning Signs Of Major Market Tops”, which you can find at the link below.
- Please follow MY CHARTS if you’re a StockCharts subscriber so I’m not relegated to the dung heap of nobody is interested in my crap. You only have to follow once. You click the blue icon seen in the upper right of each page that says “Follow”. After you’ve clicked once, the blue icon should change to “Unfollow”. Leave it so it says “Unfollow”.
- If you want to know what I’m currently thinking (rantings on occasion too)
- A lot of visitors to my blog are looking for information on T-Theory ®. The below link will take you to the index of all of Terry Laundry’s comments during the period Dec 2003 to June 2011. There is a considerable amount of charts and audio material from Terry Laundry in this section.
- If you are looking for the ability to make your own predictions using T-THEORY ®, I would highly recommend Terry’s Encyclopedia on T-THEORY ®
- Order the T Theory® Encyclopedia from Paula
EDSON GOULD
—————————————————
If you haven’t been following my Tweets, take a look at what you’ve missed.
I’m not updating the blog anymore because it’s takes too much time to write, so I Tweet short messages instead.
I hope the charts come through on this blog update. They probably will because Twitter is hosting them and I see them on the blog “Preview”.
—————————————————

Technical Analysis Investing Trading Dec low (17,067.59) violated during 1st quarter, watch out! by Lucien Hooper pic.twitter.com/yCChMBNus8

Technical Analysis Investing Trading Market declines either end with a BANG or a whimper. A waterfall is a bang and they can fall too far
Technical Analysis Investing Trading From 3 up, I count 5 steps down, which raises fair possibility of double bottom pic.twitter.com/oAOVr7kysy

Technical Analysis Investing Trading Have to wait to see how this saga ends, double bottom or waterfall. Ugly chart pic.twitter.com/tBG6SvXTr6
Technical Analysis Investing Trading “The Raging ‘Currency Wars’ Across Europe” safehaven.com/article/36528/…
Scary headline, interesting article
Technical Analysis Investing Trading 17.6 yr cycle,
dates interesting, 2000 – 2018 has been my projection for years pic.twitter.com/1lAQIiaHUC

Technical Analysis Investing Trading Interesting, never know how true these things are but it makes me stop & think pic.twitter.com/BrXWSe7lWl

Technical Analysis Investing Trading Simple tool that would have you exit market & stay out at 3AM EST last night pic.twitter.com/tg1EKF9A0F

Technical Analysis Investing Trading Yen providing no comfort & might pull US market down. Is yen decline finished? pic.twitter.com/zVIz4zyquE

Technical Analysis Investing Trading A scary count of yesterday’s rally. Bearish if true. Can’t discount possibility pic.twitter.com/janyDpEtxg

Technical Analysis Investing Trading I want to see significant break of yesterday’s peak before the all clear sounds pic.twitter.com/iZ0tYUl6Vm

Technical Analysis Investing Trading A deep correction last night and this morning should be bottoming process, but? pic.twitter.com/SchXrRRJsR

Technical Analysis Investing Trading Until proven otherwise, I’m watching for a rally in bull market, but that attitude can quickly change
Technical Analysis Investing & Trading If we decline SIGNIFICANTLY past yesterday’s low, it will be a bad situation of 4th & 5th step down
Technical Analysis Investing & Trading Hopefully yesterday’s Put buyers established position near close & sold them after GDP announcement
Technical Analysis Investing & Trading We’ll see if most of last night’s slide in the ES futures had already baked in the disappointing GDP
Technical Analysis Investing & Trading Futures are presently near a Fibonacci retracement of 62%. We’ll see if that holds.
Technical Analysis Investing & Trading Only 2 obvious steps up today, but I will call the step complete for now. Next up is . . .
Stock Market Technical Analysis Investing or Trading Wave counting is sticky in extended moves in bull/bear markets. Short swings are easy
#StockMarket #Stocks #Investing #Trading After 3rd step up, correction, or on to 5 steps up. 5 good steps would look good for recovery move
#StockMarket #Stocks #Investing #Trading Today’s rally didn’t break downtrend channel from it’s recent peak. 2 steps up from today’s low.
#StockMarket #Stocks #Investing #Trading GDP revision tomorrow, was reported 5.0% in 4th quarter, consensus says it’s revised down to 3.2%?
#StockMarket #Stocks #Investing #Trading I have called no peaks/tops on Twitter, because I am waiting for an important top to complete.
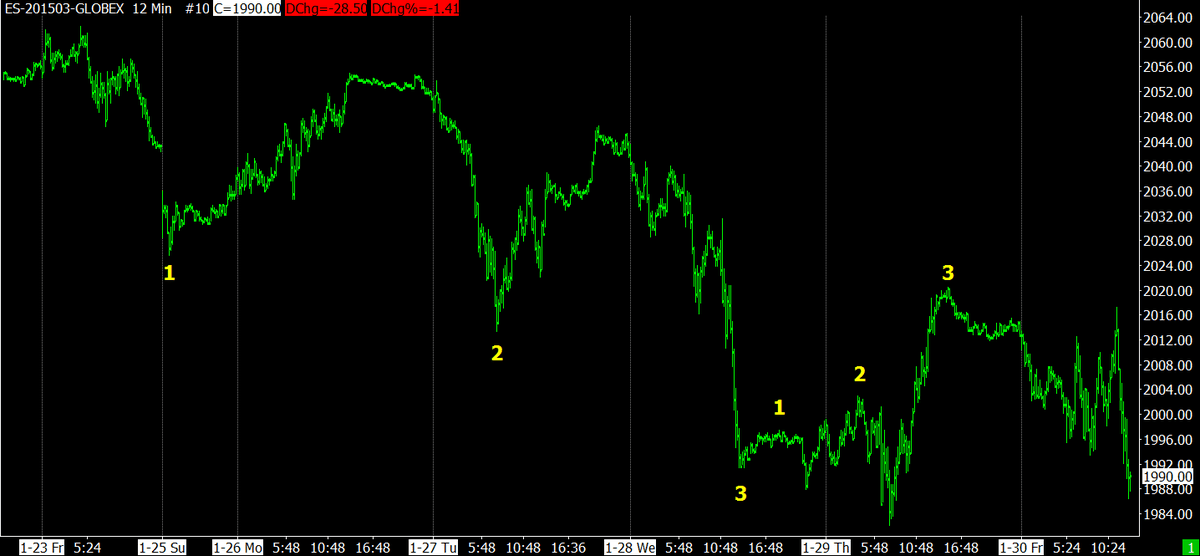
#StockMarket #Stocks #Trading Have called correctly bottoms 12/16/14, 1/6/15 and 1/29/15. Early & wrong on 1/16/15 pic.twitter.com/TQOnN8FO1V

#StockMarket #Stocks #Investing #Trading Today’s wave count. pic.twitter.com/BXIAEec1yc

#StockMarket #Stocks #Investing #Trading Lots more puts bought than calls. Some don’t believe that was a bottom pic.twitter.com/Pb6myMlpXy

#StockMarket #Stocks #Investing #Trading Have an appointment, gotta go for now. Stops are in for me.
#StockMarket #Stocks Sometimes you don’t see the real rally until step 3, other times nothing really good happens pic.twitter.com/kb5Z6T1ZGp

#StockMarket #Stocks #Investing #Trading Recent trend in the #Yen, propelling our market upward pic.twitter.com/DUxs7Dwzx1

#StockMarket #Stocks #Investing #Trading Touched this line and retreated for now. pic.twitter.com/OGwxWtkvmJ

#StockMarket #Stocks #Investing #Trading Broke #Fibonacci line, which should provide fuzzy support now. We’ll see pic.twitter.com/vDqr2LvFBw

#StockMarket #Stocks #Investing #Trading Breakout and needs to break #Fibonacci line too. pic.twitter.com/dzQhNn7nbm

#StockMarket #Stocks #Investing #Trading Small but labored break of prior high pic.twitter.com/pi2FCCAE5R

#StockMarket #Stocks #Investing #Trading See link for more info on my wave count technique. Blog not updated now. stock-market-observations.com/category/3-rea…
#StockMarket #Stocks #Investing #Trading Don’t use Elliott Wave. I use channel breaks as the final say on wave count pic.twitter.com/2qGM0v9Cuz

#StockMarket #Stocks #Investing #Trading Getting perspective. Longer wave count showing step 3 since March 2009. pic.twitter.com/XzL2G6cr2r

#StockMarket #Stocks #Investing #Trading If low on 12/16/14 is broken, then lower lows will be in effect. Bearish pic.twitter.com/72uKUau9xp

#StockMarket #Stocks #Investing #Trading Waiting for step 3 in much larger step 5 makes me not a BIG bear. pic.twitter.com/jrl5GfFSwL

#StockMarket #Stocks #Investing #Trading FOR NOW, I’ll go with this count. But a lower low switches to other count pic.twitter.com/g5UxHat0i4

#StockMarket #Stocks #Investing #Trading If this wave count is correct, it is undermined how bearish it might be pic.twitter.com/WiDyNcLLkg

#StockMarket #Stocks #Investing #Trading Another wave count for large step 3 down. Higher highs will determine count pic.twitter.com/zR3rvLGy1w

#StockMarket #Stocks #Investing #Trading A step count for larger step 3 down. Stopped on #Fibonacci line presently pic.twitter.com/1XlVE27y2c

#StockMarket #Stocks #Investing #Trading Is step 3 over, has 5 steps down. Now waiting for higher highs to validate pic.twitter.com/kboqGBYpWE

#StockMarket #Stocks #Investing #Trading SPX wave count on downside since 12/29/14 peak. Question, is step 3 over?? pic.twitter.com/icBOk7G6kp

#StockMarket #Stocks #Investing #Trading Thinking step 4 down was decline after step 1 up. In step 2 up presently. Job report was leaked??
#StockMarket #Stocks #Investing #Trading Apple mystique could prevail for a long time. I’m a member of Apple’s unthinking Borg collective
#StockMarket #Stocks #Investing #Trading iPhone falls out of favor, Apple profits crash. Apple’s cash enough give everybody in USA $540
#StockMarket #Stocks #Investing #Trading 69% of Apple’s profit is from iPhone. Apple has turned into a one product company. Dangerous??
#StockMarket #Stocks #Investing Job report increasing recently, bad weather doesn’t raise hopes, good report unexpected & be rally fuel
@Stock_Trend_Chg: #StockMarket #Stocks #Investing #Trading #Futuresare set to rally if jobs report is good, or decline into 5th step down.
#StockMarket #Stocks #Investing #Trading Tonight #SP500 #futures broke the lows made near today’s close. Looks like 4th step down of 5
#StockMarket #Stocks #Investing #Trading See my inflation/deflation charts at stockcharts.com/public/1169350… pic.twitpic.twitter.com/2Odt2D990c


#StockMarket #Stocks #Investing #Trading Duhhhhhh . . . why do we have such absurdly low long term interest rates? Because deflation lurks.
#StockMarket #Stocks #Investing #Trading FED previously described the commodity price drop as “transitory”. Apparently, not anymore.
#StockMarket #Stocks #Investing #Trading Finally someone is talking about deflation, namely the FED, saying inflation is too low.
#StockMarket #Stocks #Investing #Trading Looks like the jobs report tomorrow will tell the tale. pic.twitter.com/lXjxRVC1HQ

#StockMarket #Stocks #Investing #Trading Breaking prior lows & shaking tree to see who falls out. Waterfall here pic.twitter.com/L7vaH0wmWN

#StockMarket #Stocks #Investing #Trading Short term #Fibonacci lines pic.twitpic.twitter.com/zLZMFj9Nc4


#StockMarket #Stocks #Investing #Trading If market penetrates earlier lows & gains momentum, step aside, but if it wanders around – wait
#StockMarket #Stocks #Investing #Trading FED announcements cause schizophrenic trading for 10-30 minutes & then the direction is normalized
#StockMarket #Stocks #Investing #Trading Relative strength on Nasdaq currently, but is it enough to not break low pic.twitpic.twitpic.twitter.com/LLJDtjnyH3


#StockMarket #Stocks #Investing #Trading Watch for #Fibonacci break on current line, breaks diamond too. pic.twitter.com/9zuvVN5qkz

#StockMarket #Stocks #Investing #Trading Watch diamond, 3 steps down & should rally, or continue down with 5 steps pic.twitter.com/Qt95pCwWtl

#StockMarket #Stocks #Investing #Trading We didn’t break the diamond formation that I showed yesterday on this morning’s down thrust.
#StockMarket #Stocks #Investing #Trading 3 steps down & rally. #Fibonacciretracement lines & Fibonacci ray lines too pic.twitter.com/580pzaPNwA

#StockMarket #Stocks #Investing #Trading Diamond occurs at top of long uptrends. Signals retracements with accuracy? pic.twitter.com/hfr6dcrMSR

#StockMarket #Stocks #Investing #Trading Does that vaguely look like a diamond formation? Waiting for breakout pic.twitter.com/UDlMQ36r5y

#StockMarket #Stocks #Investing #Trading Summation index has lower highs since July, while #SP500 made new highs pic.twitter.com/osy2SjZEtd

#StockMarket #Stocks #Investing #Trading Notice % over 200 day MA has shrunk slowly since July 2014 (Mid cap & SPX) pic.twitpic.twitter.com/kW37YTHbw7


#StockMarket #Stocks #Investing #Trading GOLD ETF since 2002 plus #Fibonacci lines pic.twitter.com/eccx15Ayb0

#StockMarket #Stocks #Investing #Trading Chart of VIX since late 2006. Look carefully at some of the early warnings pic.twitter.com/SXxn2mIGMl

#StockMarket #Stocks #Investing #Trading #Fibonacci fan lines from the late 2002 bottom. It appears to be valid pic.twitter.com/rt6kCouhUB

#StockMarket #Stocks #Investing #Trading Informational chart showing DJIA monthly from 1902 to the present. pic.twitter.com/HkPwHh3yt6

#StockMarket #Stocks #Investing #Trading DJ Ind gapped down tonight & is presently down about 120 points (Greece) pic.twitter.com/IMW2xlh5A0

#StockMarket #Stocks #Investing #Trading Greece Effect Tonight – not too bad #Dax is down .74% #FTSE is down .6% #Euro is down .26%
#StockMarket #Stocks #Investing #Trading Long term #fibonacci lines beginning in 1982 pic.twitter.com/sgt5naq8FF

#StockMarket #Stocks #Investing #Trading Long term #fibonacci lines from 2002 bottom pic.twitter.com/CNkwwVHTp1

#StockMarket #Stocks #Investing #Trading DJ Transports projected peak from head and shoulders formation from 2009 pic.twitter.com/zw3yHvZUOu

#StockMarket #Stocks #Investing #Trading #Fibonacci lines for micro cap stocks since Mar 2009 bottom pic.twitter.com/4h5nZI8scq

#StockMarket #Stocks #Investing #Trading Small cap stocks (RUT) in the last step up in this phase of the bull market pic.twitter.com/Y5AJpil9kX

#StockMarket #Stocks #Investing #Trading Two pitchforks defining step 3 up since Oct 2011 pic.twitpic.twitter.com/xrgHhSIAd1


#StockMarket #Stocks #Investing #Trading Step 3 will be finished when the blue line is significantly penetrated pic.twitter.com/hcgrZo2leI

#StockMarket #Stocks #Investing #Trading One possible wave count for step 3, which began in Oct 2011 pic.twitter.com/pgPY3XHJid

#StockMarket #Stocks #Investing #Fibonacci lines at work tonight providing some support pic.twitter.com/nwxzfDr3Wd

#StockMarket #Stocks #Investing Interesting study on weekly #JoblessClaims versus the #SP500pic.twitpic.twitpic.twitpic.twitter.com/JQUxWxQy1R


#StockMarket #Stocks #Investing What effect will Greek elections have on Euro stock markets? Greece now wants debt write-off. Not likely
#StockMarket #Stocks #Investing I see 3 steps down in #London since June 2014 giving validation to current rally. pic.twitter.com/2sMAgEVyFp

#StockMarket #Stocks #Investing #London is close to a break out. London “can” be a future indicator of US markets pic.twitter.com/TQqbT5KQig

#StockMarket #Stocks #Investing Financials are 16% of the S&P 500 & energy 9%. 25% of SP is under pressure & will have reduced 2015 earnings
#StockMarket #Stocks #Investing Germany is at new highs & London is behind & must break through overhead resistance pic.twitter.com/I3o9szOlNn

On Jan 20 tweeted Looks like a small 3 step down today. A rally failure here means 5 down instead of 3 Obviously we never had rally failure
When I say 3 steps down are finished, I’m saying a rally is next. Tweet limitations don’t allow me to say that every time, so it’s inferred
#StockMarket #Stocks #Investing Slow deterioration of stocks over their 200 day moving average as SP500 moves higher pic.twitter.com/TJzqez9593

#StockMarket #Stocks #Investing Markets are working into a good buy spot, but the buy spot does not arrive until Feb or Mar – Jeff Saut
#StockMarket #Stocks #Investing #NASDAQ #pitchfork looks valid & has provided support & resistance since 2009 pic.twitter.com/MUJmOdx5pK

#StockMarket #Stocks #Investing Looks like a small 3 step down today. A rally failure here means 5 down instead of 3 pic.twitter.com/6ynDO9o5fH

#StockMarket #Stocks #Investing Valid #fibonacci trend lines from 2009. Has had predictive value in the past. pic.twitter.com/MTG4kRC8zF

#StockMarket #Stocks #Investing A crude timing #cycle for #JunkBonds(JNK). Is it still relevant??? pic.twitter.com/jgaTVLDa16

#StockMarket #Stocks #Investing Is this #pitchfork valid? A rebound at the moment, but providing further support? pic.twitter.com/m0XwhsOzD5

#StockMarket #Stocks #Investing But watch out for that double bottom in the #SP500. Stay alert as usual.
#StockMarket #Stocks #Investing #Yen warning with lower high on 12/29 We may be in a correction . . . 10% or so, but pic.twitpic.twitter.com/Gs6oyyUBIv


#StockMarket #Stocks #Investing #Fibonacci trend lines since the Oct 2011 bottom Possible #WaveCount since Mar 2009 pic.twitter.com/XsFyFcdual

#StockMarket #Stocks #Investing Since 2009, two different trend lines for step 3 (of 3) pic.twitpic.twitter.com/WZhnRYfVrY


#StockMarket #Stocks #Investing Lately the #Yen hasn’t been pulling the #SP500 into an uptrend. pic.twitpic.twitter.com/Qn80RJdHqB


#StockMarket “An All-Time 1st?: Swiss Market Index Goes From 52-Week High To 52-Week Low In Same Week” – Dana Lyons pic.twitter.com/aT4yjiaFbc

#StockMarket #Stocks #Investing Market is oversold & seasonally the period of weakness . . . should end some time next week – Mike Burke
The Dow Ind & Tran have small lower highs & lows. You can see in the 1st chart on link below. Lots of charts belowstockcharts.com/public/1169350…
#StockMarket #Stocks #Investing One possible wave count since 2009. We have no idea how long step 3 (cyan) will last pic.twitter.com/v9ytOyVaWw

#StockMarket #Stocks #Investing Bank stocks are sick pic.twitter.com/WSDrdhdggB

#StockMarket #Stocks #Investing Large caps made insignifcant lows, smaller caps performed better. We’ll see later pic.twitpic.twitpic.twitpic.twitter.com/gMPNOohVbm


#StockMarket #Stocks #Investing Updated #Fibonacci lines for latest two significant declines pic.twitter.com/5BhYxDHgsC

#StockMarket #Stocks #Investing Another version of the latest #Fibonaccichart pic.twitter.com/tBXIvbBFlU

#StockMarket #Stocks #Investing Updated #Fibonacci chart including the most recent decline pic.twitter.com/OFDxj214Hd

#StockMarket #Stocks #Investing See chart for next #Fibonacci ray for support, around 1970 on ES futures pic.twitter.com/uzxViBdJrv

#StockMarket #Stocks #Investing Jeff Saut is standing aside for the 1st quarter 2015 or until market accomplishes his downside goals (-10%)
#StockMarket #Stocks #Investing Moving envelope shows downside liability for the moment, for short term use only pic.twitpic.twitpic.twitpic.twitter.com/NUS7eH9buG


#StockMarket #Stocks #Investing Moving avg reveals character of market, not big on moving avg, they have their use pic.twitter.com/guT2OHSqtR

#StockMarket #Stocks #Investing Fibonacci downtrend is STILL active, shouldn’t be true if in rally mode since 1/6/15 pic.twitter.com/Y2pbxpXWlU

#StockMarket #Stocks #Investing #SP500 1. Rally from prior low OR 2. 4th step penetrates prior low and waterfalls pic.twitter.com/YbgsYgA2A3

#StockMarket #Stocks #Investing 3rd step down in #SP500, very close to prior low on 1//6/15 pic.twitter.com/r05rHLimSt

#StockMarket #Stocks #Investing Banks are weaker than the rest of the market. That’s never good. pic.twitter.com/KxiG4qj46Y

#StockMarket #Stocks #Investing Junk shows 3 lg steps down, a sm rally followed by a lower high, still INDETERMINATE pic.twitter.com/YNWZexRl3x

I may not be connected to the market for the rest of the week. It’s kinda iffy. If I post, great & if not . . . curses . . . foiled again.
#StockMarket #Stocks #Investing Hmmmm. ES contract was down 44 points in 4 hours (top to bottom).
#StockMarket #Stocks #Investing Market is sub-dividing to downside. Need to re-evaluate count, but presently not connected to market feed.
@focus1234567 trend is up
#StockMarket #Stocks #Investing Yesterday I said “Here we go on the upside after a higher low with a 3 count down” ANOTHER LOW CALLED RIGHT
#StockMarket #Stocks #Investing Here we go on the upside after a higher low with a 3 count down. pic.twitter.com/G1yUTY1zDh

One of the BEST strategists – “weight of evidence suggests the bull market has embarked on a broad topping process that could take its time”
#StockMarket #Stocks #Investing That looks interesting, but we have to see higher highs and lows. pic.twitter.com/Rf7WtiJj0o

#StockMarket #Stocks #Investing “Saudi Prince: Oil will never return to $100” That’s true if they want to keep #shale #oil out of business
#StockMarket #Stocks #Investing Another view of Fibonacci at work. pic.twitter.com/8zesYTVXre

#StockMarket #Stocks #Investing Fibonacci line is “trying” to hold market here. Looks like 4th step down (of 5 down) pic.twitter.com/7FkMxZp07I

Sometimes divorce can be very very expensive. I wondered how you could write all that on a small check . . . 2 lines pic.twitter.com/t6RWjSRLD5

#StockMarket #Stocks #Investing Seasonality: Next week has not been up for over 20 years. – #MikeBurke That says it all except how much???
#StockMarket #Stocks #Investing We’ll see how things go next week. Be watching SP500 futures on Sunday to see if they give any direction
#StockMarket #Stocks #Investing Downtick in “Small Business Lending Index” pic.twitter.com/u0OzCtFdwW

#StockMarket #Stocks #Investing As suspected – since the high made after the jobs report, we have been in a corrrection
#StockMarket #Stocks #Investing Higher high turned out to be a whipsaw and failure pic.twitter.com/EHFmfYkcJ4

#StockMarket #Stocks #Investing Small triangle just broke to the upside, we’ll see if it breaks prior high pic.twitter.com/WDcMhNhHY1

#StockMarket #Stocks #Investing Small triangle forming today, watch which way it breaks out pic.twitter.com/ESPDbYI3Cy

#StockMarket #Stocks #Investing Does this #Fibonacci line mean the decline it’s based on is still alive??? pic.twitter.com/urDNM68nDt

#StockMarket #Stocks #Investing Another #Fibonacci chart, targeted peak on Thursday & approx on Friday pic.twitter.com/8iRJPNJ2S1

No #shale #oil means no #fracking, which means no protests about fracking dangers plus the fracking #earthquakes will eventually subside
Only way to eliminate shale oil is keep prices permanently low. That’s a steep price for OPEC to pay to get rid of shale oil.
Low oil prices “can” eliminate shale oil, BUT when prices rise, shale oil comes right back on the market. Shale is like money in the bank
#StockMarket #StockCharts #Investing Note how the #Fibonacci line targeted the rally peak perfectly pic.twitter.com/lIsmKZMgWA

#StockMarket #StockCharts #Investing I’m waiting for a higher high and above a green line before buying again. pic.twitter.com/5T6dnJb76l

Market didn’t perform right after jobs report, rallied, small decline & failed to make new high, I sold my ES futures pic.twitter.com/lhVzsjbLBM

#Bond #Investing Has #shale #oil #junk #bonds default been factored into price of junk bond ETFs – I don’t think so pic.twitpic.twitter.com/AKhP5MigoH


#StockMarket #StockCharts #Investing #Bond #investors who helped finance America’s #shale boom are facing potential losses of $11.6 billion
#StockMarket #StockCharts #Investing “The $173 billion in U.S. energy junk bonds make up the biggest portion of the high-yield debt market”
#StockMarket #StockCharts One could interpret the chart as a #sawtoothed #top? More of the same makes it true pic.twitter.com/fF7GMr4HOd

#StockMarket #Investor #TrendLines #StockCharts Small caps – 18 months. Mar thru Oct looks like one large correction pic.twitter.com/k4OiLOgHVs

#StockMarket #Investor #TrendLines #StockCharts I might get concerned on the next top because that will be the 3rd top since the Oct bottom
#StockMarket #Investor #TrendLines #StockCharts On our way back to the old highs. Slightly past the 62% retracement pic.twitter.com/Ys694QE2wd

#StockMarket #Investor #TrendLines #StockCharts Reason dollar is rising is that every other currency in the world is falling – John Murphy
#StockMarket #Investor #TrendLines #StockCharts Small caps are performing very well since their bottom on Tuesday pic.twitter.com/StTuEVaECy

#StockMarket #Investors 22 hours ago on Tuesday 1/6/15 I nailed another stock market low. Did the same on Dec 16th too.
#StockMarket #Investors Yesterday I said: “looking for higher highs & higher lows because . . . we’re going to rally” pic.twitter.com/7ZjUwomZWW

#StockMarket #Investors Red trendline has multiple support points & could be a reversal area for the present decline pic.twitter.com/D5HeVHSGug

#StockMarket #Investors Long term #fibonacci lines and wave 3 possible peak pic.twitter.com/B5b6R07HRn

#StockMarket #Investors #Fibonacci lines & count for downtrend. Higher highs above 2017 #SPX could signal reversal pic.twitter.com/S9Z0w35QrK

I would think we would have 1 more peak before anything disastrous took place. Sometimes the best laid plans go awry pic.twitter.com/kpwJ9DL0W5

We could be in rally mode. This rally should be tradable. pic.twitter.com/yu5iSvW6wq

Pay attention to market. Right now I’m looking for higher highs and higher lows because I think we’re going to rally.
“Downside surprises on #inflation are far from over. That’s probably going to be the very important theme for the year.” – #DEFLATION
The out of control price decline in #oil could cause a #FinancialAccident. If the accident is big enough, it could be CONTAGIOUS
#StockMarket #Investors How the count looks in the market. It’s going for 5 thrust channels down and we’re in 4. pic.twitter.com/e1j4y0Nsnn

#StockMarket #Investors Yesterday I said: “Finished last step down . . . it’s rally time” I couldn’t have been more wrong.
#StockMarket #Investors Well . . . the #yen WAS going in the right direction for a rally pic.twitter.com/OWlkOMq3ii

#StockMarket #Investors #Yen is going in the right direction for a stock market #rally pic.twitter.com/CvplXiPiYR

#StockMarket #Investors Finished last step down & that means it’s rally time. It’s a slow start just like last time pic.twitter.com/I7RLxMsqyd

#StockMarket #Investors The next 6 months are, by far, the strongest 6 month period in the 4 year Presidential Cycle – by Mike Burke
#StockMarket #Investors See my charts from #StockCharts at the link below stockcharts.com/public/1169350
#StockMarket #Investors 3rd chart, #NASDAQ is turning up. 1st chart #SP500, 2nd chart #DowJones #Industrialspic.twitpic.twitpic.twitter.com/LnvmiAodbt


On 12/31 wrote #StockMarket #Investors I think . . . most of the step is probably behind us Today had bottom signs pic.twitter.com/TNZ8I2qwXq

Lobbyists . . . the bane of government decisions. Cartoon shows lobbyists are hard at work for the banks. pic.twitter.com/USN2GPwXRJ

I’m a believer in Glass Steagall legislation. 2008 gov’t bailouts teach banks they are invulnerable & needn’t worry pic.twitter.com/J8Tyd9COYe

Cartoon is showing that “History always repeats, only the details change” pic.twitter.com/6N4wK7Xsid

#StockMarket #Investors I think we are in last step down since Dec 26 and most of the step is probably behind us. pic.twitter.com/ZLZhAd13Xc

Did you see #investors taking #profits that aren’t #taxable until 2015? I saw a lot of that today. Next up, is the #decline over???
#Yen – Chart 1 – recovery after 2 steps down. Chart 2 – beginning of a downtrend? Watch yen closely for trend changes pic.twitpic.twitter.com/mE4bxyp1mt


#NASDAQ chart looks to be in the final stages of its present decline. In 3rd step down and waterfall taking place pic.twitter.com/QGVvHc9fQl

#futures #charts, #SP500, #DJIndustrials & #NASDAQ have short term lower lows. First lower low since Dec 16 #reversalpic.twitpic.twitpic.twitter.com/y0u7ip0TTl


Jeff Saut is growing cautious looking for a 1st quarter #correction in the #StockMarket. That viewpoint seems legitimate to me too.
Remember small downtrend in the #yen I showed late yesterday. Present look at it. #StockMarket and yen in lockstep. pic.twitter.com/db8fzXijqG

Bookmark the link for the #yen seen below. Us this link to watch movement of the yen. It’s a great reference for our #StockMarket.
#Yen click link below investing.com/quotes/japanes… This #chart is the inverse of MY yen charts. It moves in the opposite direction of our market
#Yen chart in almost lockstep with our #StockMarket. Notice small decline late today. Need to watch for more decline. pic.twitter.com/LSiKobeONW

Likely be a continuation of uptrend for most of this week. Beginning the following week, there “might” be a small decline. More later.
Since there is not much to report on recently, I’ve been working on an automated method of trading. Something I have NEVER done before.
#Yen has small #trend change & a small decline expected in #StockMarket. Count looks like #yen has 2 small steps down pic.twitter.com/qMdaoDV1R8

#Yen chart with an #andrews #pitchfork showing #resistance at the mid-level line. pic.twitter.com/kDqiJqVgVR

Happy Holidays There is no change in the outlook since the bottom signaled on Dec 16th. The surprising result is the speed of the uptrend.
30 minute chart of #YEN & #SPX. Trades in same direction as US #StockMarket. Compare 2 charts for direction & timing. pic.twitpic.twitter.com/r6T4OiydPx


No one likes information overload because it confuses the reader. If I don’t post it’s because nothing has changed, or I kicked the bucket.
Page 8 on my charts at #StockCharts is new. It compares 17 sector #AdvanceDecline lines. Look at the other pages toostockcharts.com/public/1169350
Market rose today & has been rising for 5 days, yet puts dominate. Turning bearish during a strong move upward seems bold & maybe stupid
CBOE PUT/CALL WAS 1.31 (131 PUTS BOT FOR EVERY 100 CALLS) ISE CALL/PUT WAS .70 (70 CALLS BOT FORE EVERY 100 PUTS) ??? pic.twitpic.twitter.com/JqaspSmwVw


Not much to comment on since the recent bottom. No resistance at the old peak of Dec 5. This time of year is hard to beat until after Jan 1
When I say this is the end of a “3” wave count, that’s me saying that a reversal has, or will take place. That wasn’t made clear on Dec 16
After a 4% rally in 2 days, I would have thought the call/put ratio would be higher. 148 calls for every 100 puts. pic.twitter.com/ock5gmxBLk


$SPY hasn’t had back-to-back gains of 1.95% since March 2009. Could happen today.
An interesting leading #indicator of #business conditions. See how it performed at the 2007 peak & 2009 bottom pic.twitter.com/333Grhf6lB

Russell Small Cap ($RUT) is close to prior high in late November. They now have greater relative strength than Lg Cap pic.twitter.com/wN1T3OZ0LZ

I would expect resistance to appear at the old #StockMarket peak (Dec 5). The wave count will determine how long the resistance will last
“If Santa fails to call . . . the #bears will roam on Broad and Wall.” – Lucien Hooper Now the #bears are running for cover on #WallStreet
I nailed the #StockMarket #bottom 2 days ago. Compare today’s #chartwith the chart from 2 days ago (see Dec 16th) pic.twitter.com/k3neCmVGiY

Early yesterday I said, “it must break the downtrend since Dec 5” Duhhhhh, I think we broke the downtrend with Dow up 600 points in 2 days
The decline stopped today at the 38% retracement level measuring from the Oct. bottom. pic.twitter.com/ELmcERmudC

No trend break after step 3. We are in a 5 step up? But when you lose track of the count on the upside, that’s great. pic.twitter.com/6ZYx5Gdd4v

The decline after step 3 should break the trend that began from the bottom near “1”. Then should begin purple 2 up. pic.twitter.com/QunFyvqrSE

Current rally looks like other rallies that occurred on the way down since Dec 5 That’s gotta change for good bottom pic.twitter.com/RODIdlbpyz

If the rally breaks the downtrend, will it go on to new highs??? More on that later. pic.twitter.com/lzTKOaS6QY

For this rally to be the end of a completed step down, it must break the downtrend since Dec 5. Hasn’t done that yet. pic.twitpic.twitpic.twitter.com/7VPkmbBRTo


First objective is to see the #StockMarket rally above yesterday’s highs. The rally is very slow & taking its time to make a higher high
Yesterday, I tweeted “We should have completed the present step down in the #StockMarket“. Market #DoubleBottom after that & rallied again.


#JunkBond are NOT making new lows today. That’s an encouraging theme. pic.twitter.com/yO5GxxUukv

Presently, most of the indexes are trying to make new lows. We’ll see if they thrust downward or wander around near this morning’s low.
This is the completion of 3 steps down. If the rally doesn’t materialize, it would mean we will get 5 steps down. pic.twitter.com/GJTlNowXkU

We should have completed the present step down in the #StockMarketFailure to rally significantly would be a bad omen pic.twitter.com/qYgVMGvcBq

#JunkBonds (JNK) are falling at a faster rate. pic.twitter.com/AHefBwYMsB

Weekly #unemployment #claims are not going in the right direction. In this #chart, the claims are shown inverse pic.twitter.com/GiaxugfiCJ

An expanding triangle (#ExpandingTriangle), or #megaphone in the $SPX #SP500 pic.twitter.com/02CayBM37w

The #ADX is approaching a buy zone. This signal isn’t valid until the ADX reverses direction and moves deeper. pic.twitter.com/QP6uOdutUa

The shorter term #oscillator is in the #OverSold zone pic.twitter.com/VTPSW1lUhe

The longer term #oscillator is in the #OverSold zone pic.twitter.com/1jZEdwtZHl

If Santa doesn’t get his butt over to Wall St. soon, it’s gonna be: “If Santa fails to call . . . the #bears will roam on Broad and Wall.”
One more new low & we should rally. The rally should carry back to the 2055-60 area. If not, things will get worse. pic.twitter.com/RFm20E4q6G

U.A.E. Sees OPEC Output Unchanged Even If Oil Falls to $40
#WaveCount indicates should have 2 more declines & then rally after the 2nd decline. It should produce a decent rally pic.twitter.com/wMtAhjuVPk

PAGE 4 CHART 3 – #RYDEX #SENTIMENT Money not moving into bear funds or money market funds. Sentiment is feeling safe pic.twitter.com/UYt9HyeqgT

PAGE 3 CHART 2 – – WEEKLY UNEMPLOYMENT This weeks #jobs report didn’t make for good reading. Jobs chart is inverted pic.twitter.com/PnyRXyt79h

PAGE 2 CHART 8 – – AVERAGE PRICE RELATIVE TO 52-WEEK HIGH from my #StockCharts at stockcharts.com/public/1169350pic.twitter.com/3pWSaLCY9n

PAGE 2 CHART 6 – – #SPX ENVELOPE, SHORTER TERM #OSCILLATORSShort term #OverSold & almost over sold in long term pic.twitpic.twitter.com/iSsw0XgIAn


#DowTheory warning with a non-confirmation in the #Transportation Index PAGE 2 CHART 0 – – DOW THEORY pic.twitter.com/KPPkW5jdqb

PAGE 1 CHART 9 – – STOCKS ABOVE 20 DAY MOVING AVERAGE from my #charts at stockcharts.com/public/1169350 pic.twitter.com/eRwZVSBMcH

#Chart with a name similar to “PAGE 1 CHART 7” or one that has a white background means it comes from my #StockChartsstockcharts.com/public/1169350
PAGE 1 CHART 7 – – % ABOVE 200 DAY MOVING AVERAGE Lower peaks in these charts while indexes move to higher highs pic.twitter.com/PvICxX351u

Declining #AdvanceDecline line peaks versus a rising #Wilshire 5000 index. pic.twitter.com/0jy1KCJiBl

Lower high in the #AdvanceDecline line versus the #ValueLine price Index. This #chart from stockcharts.com/public/1169350pic.twitter.com/gUKb2SAg3i

#Oil prices plunging, #investors are worried #oil #debt issuers can’t meet obligations, predicts #default rate will double to 8% next year.
Some #hedge fund’s are making money on #oil‘s plunge. Any large unanticipated move can cause #bankruptcy. That can affect the entire #market
The #ruble tumbled to a record low for 2nd day, #Russia’s #CentralBankintervened to slow the rout for an economy verging on recession.
The #FED gets very uneasy when #inflation drops below 1%. We could be seeing below 1% figures in the months ahead.
FED should become more dovish after oil prices plunged in recent weeks. U.S. is NOT moving in the direction of its 2% inflation target.
US oil drillers idled the most rigs in two years as they face oil trading below $60 a barrel & escalating competition from suppliers abroad.
#Inflation #trends measured by #bonds & #commodities. #Trends show here before government figures (lagging indicator) pic.twitter.com/UrL8R0pRE3

The #SP500 has strong relation ship with #Vanguard FTSE All-World ex-USA stock index. When will it get back in step?? pic.twitter.com/Sn1bdiC89Q

While the U.S. economy is in much stronger shape than foreign economies, it isn’t immune from foreign stock trends.
IEA cut its forecast for global oil demand for 5th time in 6 months. It attributed lack of demand to weakening global economic conditions.
Other central banks are beginning to throw money at their economies. See a trend yet??? As long as prices don’t decline, there’s no problem.
The deflation cure is to throw lotsa money at the problem. One hiccup, the US and Japan have been throwing lotsa money for some time.
Central banks like a “little” inflation, but when faced with a hint of deflation, they get frightened. The solution to deflation is to . . .
It’s the out of control decline in oil that has me unsettled. I don’t like looking a gift horse in the mouth, but there could be problems.
Lower oil prices is like a tax cut to the consumer and they should spend more money and create a good Christmas season for business.
BUT when prices are cut to gain market share, because they can afford it due to higher profits, others will follow to retain market share
I’m a technician and this is a fundamental problem (??) Oil has an impact on most products. Lower oil prices translates into higher profits.
Oil just keeps falling. The chart shows the last 10 days where oil fell from $70 to about $57. pic.twitter.com/yJPskV7Rlu

#Yen is falling today & that means that our #Stockmarket is up today. #MarketTiming has been almost perfect recently pic.twitter.com/kl0konXz1a

#Junk #bonds are still declining, probably due to their holdings in #oil#shale. No profits means default. pic.twitter.com/QhIqn9rHFD

Today’s #LargeCap #StockMarket #index decline has not made lower lows. Smaller caps are stronger again today. pic.twitpic.twitpic.twitter.com/Y5dehyVKy7


The #Yen is rallying & the #StockMarket is declining. The opposite move relationship is not exact in time, but close pic.twitter.com/exnRvkx4mb

Oil is having a hard time finding time for a rally. It’s just keeps falling. Don’t try to catch the falling sword. pic.twitter.com/5x7Vo0SyQn

Crude could fall to as low as $40 a barrel amid a price war or if divisions emerge in OPEC, said an official at Iran’s oil ministry.
Energy accounts for as much as half the cost to produce food & metals, commodities will keep dropping, say Societe Generale SA and Citigroup
Small caps are performing better than mid & larger cap stocks. Small & Micro cap have made up all they lost on Mon pic.twitpic.twitpic.twitpic.twitter.com/RVEWFhJOoY


“If Santa fails to call, the bears will roam on Broad and Wall.” – Lucien Hooper
“Think of it this way. Lower oil prices are to America what low labor prices were to the BRICs!”… Sara Eisen
#ISE #Sentiment was tilted towards the put side today. 66 calls for every 100 puts. pic.twitter.com/ALhEr31q09

Small triangle showing at the close today in the #DowJones Industrial futures. pic.twitter.com/JEFBT6mw7z

60 minute ADX “may” need more decline to complete the rally signal. This ADX is less reliable than daily ADX. pic.twitter.com/pPej7pJt2K

I’ve shown this #SmallCap #WaveCount before & still don’t know if it’s valid. It hasn’t been invalidated yet. pic.twitter.com/2UwdQJr7TG

Recent lower high in the #NASDAQ, #Transportation #Index, #Financialindex, #Utility index. Others made recent highs. pic.twitpic.twitpic.twitpic.twitter.com/qdV34MrFQt


#WaveCount in #LargeCaps since Oct low appears different & MAY only have 2 steps up. One more gasp for a 3rd step???? pic.twitter.com/oGAbo8vVxn

The apparent #WaveCount in the small caps since the October lows. pic.twitter.com/WXMkKHV5yx

Daily envelopes showing the longer term boundaries of these indexes. Prior chart envelopes were 60 minute bars. pic.twitpic.twitpic.twitpic.twitter.com/SsNyV0HfZq


The envelopes have done a good job of showing upper & lower boundaries of the indexes followed. pic.twitpic.twitpic.twitpic.twitter.com/eNuE6cZILk


Emerging markets have not shown the same strength since the October lows, lotsa relative weakness. pic.twitter.com/Mf0FFydhjp

Upper left section of chart has symbol, time interval for each bar, price, today’s net change, today’s % change pic.twitter.com/B3gvneQumG

#StockMarket & #JunkBond weakness, while a nice rally is going on in #TreasuryBonds pic.twitpic.twitter.com/KELz4xlLUn


#JunkBonds #Bond are having lotsa weakness & are lower than their Oct low. Likely due to defaults coming in oil shale pic.twitter.com/HztzsmCmQJ

Interestingly, the #SmallCap #stocks #index are not as weak as the #LargeCap. pic.twitpic.twitter.com/mf6Ht9PM6K


As expected, the #Yen is rising. Our #StockMarket has had an opposite correlationship with the Yen for some time. pic.twitter.com/oPoJaO9Q29

NASDAQ doesn’t have a meaningful lower low yet. If it happens, we are only in step 2 down pic.twitpic.twitter.com/dTtuQ2qjMT


Hindenburg Omen has been unreliable at predicting tops, however it has been triggered prior to every major top. – Mike Burke on Hidenburg
High levels of new lows, relatively high levels of new highs has triggered a Hindenburg Omen for the past 6 consecutive trading sessions.
Junk bond ETFs may have a significant exposure to debt in oil shale projects, which may default on their debt because of low oil prices
Advisor who isn’t regurgitating typical market babble from Wall St. Original thinking makes him interesting to me. bloomberg.com/video/milton-b…
I’m unsure how much (if any) I will be tweeting this week. Got lotsa irons in the fire at the moment. That’s why I posted lotsa charts today


Daily #ADX gave a sell signal last week & is now moving away from the signal lines. See ADX rules on Page 2 Chart 7 pic.twitter.com/l38TYf5oZ1

Upper line of #Pitchfork for Russell micro-caps is stopping the advance pic.twitter.com/4bW17ujX4b

#Charts are #Russell large-cap, mid-cap, small-cap & micro-cap. Strength dwindles from larger caps to smallest caps pic.twitpic.twitpic.twitpic.twitter.com/B7MFNNbicx


Many indexes gapped down today. Dow Jones Industrials didn’t decline proportionately today. Charts are #SPX & #DJIApic.twitpic.twitter.com/fmC75Cu7jB


#BankIndex made double top at last week’s high, the recent peak is below September high. Banks gapped down hard today pic.twitter.com/qIiV2Hdl5d

Junk bonds had a heart attack last Friday and today (Monday). pic.twitter.com/uUD96C8lJz

If there is going to be stock market weakness, it should come this week & next week. Seasonality has upward bias after that – Jeff Saut
Freaky Friday: More Disturbing Behavior From The #StockMarket – Dana Lyons
If shoppers don’t turn out for Christmas & after Xmas sales, then Wall St can have a heart attack. Gift cards don’t count in sales figures.
Retail sales disappointed & Wall St had heart attack. Lower gas prices, more jobs means higher sales, shoppers are waiting for the good deal
Looking at charts in last tweet, waiting to see lower lows in small caps to signal something significant is happening (probable).
Small cap shows 3 steps up, NASDAQ has 2 pauses & a correction, SP500 & DJIA show an uninterrupted rally until today pic.twitpic.twitpic.twitpic.twitter.com/SucU9DLLoh


Yen is rallying & IF continues, US market should correct. They have had a close inverse relationship for couple years pic.twitter.com/6P8NCBWLcQ

Funny but sometimes true. I buy big ticket items during a recession when sales are slow and discounts are very big pic.twitter.com/1iTz0rhDtq

Scenario #2 would take years to complete. If true, a great buying opportunity equivalent to March 2009 occurs during correction after cyan 3
Scenario #2: finish yellow step 5 in cyan 3, begin 35% correction, followed by bull market cyan 4 & 5 pic.twitter.com/zYUsLWYBjd

One scenario based on the wave count, finish yellow step 5 in cyan 3 and begin a major bear market pic.twitter.com/suHk4sldgg

This is the wave count as I see it presently, beginning in 2009 pic.twitter.com/2f03eaFVCV

Last 3 days have been small fluctuations, caused by Thanksgiving. Last 3 days were inside, outside and inside days pic.twitter.com/bQ24Hrqcpz

According to Goldman Sachs, for every 0.50% slowdown in the world’s economic growth, it only affects U.S. GDP growth by less than 0.13%
Is the downward #pitchfork going to hold the upper line??? Purple Bar = #OutsideDay Yellow Bar = #InsideDay pic.twitter.com/7l9IU43KJA

The SKEW is rising again and is at warning levels for a correction. pic.twitter.com/94G7uNkfGE

My public chart link on StockCharts is: stockcharts.com/public/1169350/There are some interesting charts at this link that should be followed.
According to Sentient Trader, the Oct low was a 50 month (4 year) Hurst cycle low. pic.twitter.com/T07XBzVsz5

Sentient Trader predicts 80 day Hurst cycle low in Jan & 40 day cycle low within a week pic.twitter.com/BKCSVRzBcJ

Long Term Viewpoint U.S. #Stocks are 2nd Most #Overbought In History – Dana Lyons pic.twitter.com/0dDOxbz7b2

Interesting cycle for peaks, showing a peak anytime presently pic.twitter.com/6k2LDwRv3J

#JunkBonds, #JNK in a downtrend, looks like 2 steps down completed. The latest & smaller decline shows 3 steps down pic.twitter.com/PV2AUoF4BX

Today #SP500 touched the #peak of the envelope. The #rally should slow more, or decline pulling back from #envelope pic.twitter.com/8QdY7XE1Ki

When the small caps show a significant higher high above the 11/13/14 peak, it will signal step 2 up from the Oct bottom.
I was thinking about posting this chart yesterday showing small caps were oversold & could rally, today they rally pic.twitter.com/gWQpLeb26a

See the relationship of 30 year bond rates to the US #dollar on the chart PAGE 4 CHART 6 at #MyCharts stockcharts.com/public/1169350
A strong dollar creates low inflation, but does that carry over to 30 YEAR RATES, which were declining long before the dollar was strong???
After WWII we had low long term interest rates. This created economic growth & stocks that went up for decades. Future deflation or growth??
The long term cost of money indicates that historically something unusual is going to take place. What is it & when does it take place???
Would you loan money to the Treasury for 30 years @ 3% – NO. But if you thought deflation was going to take place, you would loan the money.
THE PRIOR TWEET SHOWS THERE ARE NO INFLATION EXPECTATIONS OVER THE NEXT 10 YEARS.
The 2.32% yield on 10-year Treasuries compares with 0.80% on 10-year German Bunds & 0.50% on 10-year Japanese government bonds.
Small cap showing the end of a step up, while large cap shows no break in trend . . . yet pic.twitpic.twitter.com/I4tCUp26LX


Daily charts of small & micro caps are declining & #SPX is not correcting . . . yet pic.twitpic.twitpic.twitter.com/v1Y1Vs8iNF


Yen chart, 5th step is not complete but it may be forming, which ends larger 3 down. Yen rally should develop at 3 pic.twitter.com/kfFqOMbhoQ

#SP500 above their 200 day moving average have hit a wall and #DJIA is declining. In general most stocks have slowed pic.twitpic.twitter.com/zoHjK27s0X


Other than larger caps, advance decline lines are struggling. Large caps made new highs, showing a selective market pic.twitpic.twitter.com/9U7cZtgkUu


Japanese economy slipped into recession in the 3rd quarter, a surprisingly poor performance. GDP declined by annualized 1.6% in 3rd quarter
Orange County is recycling wastewater into drinking water by 50%. The filtered water is pure, it goes straight to the reservoirs – – YUMMY
Lower gas prices couldn’t come at better time of year for retailers. They should have good Christmas season, if not, it’s big disappointment
World economy is in its worst shape in two years, with the euro area & emerging markets deteriorating & in danger of deflation – Bloomberg
#MicroCaps & #SmallCaps are losing their relative strength in the last couple of days pic.twitter.com/kvTGf5EPUX

Current average price relative to the 52 week high low, expressed as a percentage – This index is still trending down pic.twitter.com/YanC5vb1ni

Current deterioration in the number of stocks above their 20 day average #NASDAQ & #NYSE pic.twitter.com/5BdVka3Jrr

#NYSE & #NASDAQ indicators high / low and high – low for each index pic.twitpic.twitter.com/r4oTkT186Q


Showing dwindling upside momentum in the new highs for various indexes. This is “PAGE 1 CHART 5” of my charts. pic.twitpic.twitter.com/NJaQp6HBdw


My charts on #StockCharts is at stockcharts.com/public/1169350 I update the pertinent red, green alerts & #TrendLines about once per week
4) Thursday’s 0.93% loss in the Russell 2000 was the 4th worst ever on a day the Nasdaq 100 made a 52-Week High – @JLyonsFundMgmt
3) On Thursday NYSE Breadth was the 3rd worst ever for a Dow Jones Industrial Average 52-Week High – @JLyonsFundMgmt
2) On Thursday breadth on the Nasdaq was the 2nd worst ever for a 52-Week High in the Nasdaq Composite – @JLyonsFundMgmt
1) On Thursday breadth on the NYSE + Nasdaq was among the worst ever on an up day in the S&P 500 – Dana Lyons
My thoughts are that the #index #futures could #rally on Sun – Mon one more time & then correct. But nobody bet the farm on that #prediction
Indications that we could get a small #correction in the first half of next week #Market is so strong that predicting a correction is crazy
@Stock_Trend_Chg #yen 30 minute chart looks like it’s in a 5 step #WaveCount
#Russell #Microcap index in both charts with a RSI on #1 and a stochastic indicator on #2 pic.twitpic.twitter.com/SKy3kMg2QC


Possible wave count on the falling #yen The Yen has been falling in perfect tandem with our market rising. pic.twitter.com/Ff3xPRWpNx

I’m cutting down the number of charts that I have in Sierra Charts. If I don’t have the time to look at each chart every day, it’s junk.
An #EMA #MA #trendline for buy and sell points. pic.twitter.com/vOkEm6hfw4

A “possible” wave count, which is probably step 1 of 3. The trend break will determine when this step is broken. pic.twitter.com/KxNn7hKcFv

A disparity is occurring presently. A slowing of the advance is enough to cause this small non-confirmation. pic.twitter.com/kOvs7UNl1A

I posted this chart some days back. When prices met the max envelope line, the advance slowed considerably. pic.twitter.com/hwUWMcqS6K

Not a month since blastoff on Oct 16 & the #SPX has gained more than 12% Not tweeting much lately as I wait for something new & significant
No MAJOR divergences in my charts, but the market is VERY overbought Jeff Saut is cautious short term, but very bullish for the long term
The Yen is falling again. This has translated into higher prices for our market. QE has shifted from USA to Japan. pic.twitter.com/2Q5NmBQBov

Friday was day 17 of the buying panic that began on Oct 16. Buying panics “normally” last 17 to 25 days. Trading top is due – Jeff Saut
Yen chart 1, SPX chart 2 Yen is moving up today. If it continues next week, watch our market’s response. pic.twitpic.twitter.com/R5t7QBt8hJ


Ukraine Liveblog: Intense Shelling In Lugansk Region. interpretermag.com/ukraine-livebl…
Ukraine’s MFA: Russian invasion — 30 trucks, radar equipment, 32 tanks, & 16 howitzers entered Ukraine near Lugansk bit.ly/1wCcCya
DJ Transports have achieved their measurement level from the inverse head and shoulders formation formed since 2007 pic.twitter.com/WikL01jl4H


“& buy an asset in the 2nd currency” They would buy stock & bonds denoted in the 2nd currency. This is important buying power for our market
Carry trade is like shorting the yen. One way is to borrow the yen, trade the yen for another currency, & buy an asset in the 2nd currency.
Large caps are pushing ahead and smaller caps are farther behind. We’ll see if the market can breakout and make significant higher highs???
Long inverse head and shoulders in the transports is almost at the projected level. pic.twitter.com/7h4U7iVVBS

#Futures in recent minutes failed to make new high. “IF” market closes for a loss today, we would have a reversal day
Today’s comparitive market action between #SPX #futures and #NASDAQfutures. pic.twitpic.twitter.com/Bbp78AFf7D


Two possible gold wave counts. Yellow wave counts see an end in sight, but cyan count says bottom is long ways off ?? pic.twitter.com/IkA4ZCX52a

#fibonacci fan line based on 2000 peak and 2003 low pic.twitter.com/1lGzi11BH4

#RUT Russell small cap chart with possibly valid trend line. pic.twitter.com/z4FCGTCHol

Won’t be clear if we are are ending step 3 for awhile. It ain’t over until its over. pic.twitter.com/6P9iW2uGpq

#SPX chart #1, #DJIA chart #2 Touching upper envelope means slower going upward or down. pic.twitpic.twitter.com/kych4vvvVg


Measurement prediction after recent lows. Almost made it to the predicted high & missed by 3 #SPX points pic.twitter.com/Zse5RJJCxp

Going into a small 3rd step up in #SPX #futures. We’ll see if breakdown takes place afterwards or something lesser. pic.twitter.com/hkTJRRsW4d

Junk bond recent weakness. Junk bonds have always been the canary in the coal mine. pic.twitter.com/wbako4kMBu

#LargeCap chart #1, #MicroCap chart #2 Smaller caps are edging downward quicker than the larger caps pic.twitpic.twitter.com/6VJVKjrweZ


Our QE program has ended, but Japan’s QE still goes on with a recent boost upward on 10/31.
Yen chart #1, SPX chart #2 The #yen and #spx since late 2012. Oct 2012 saw the end of a correction. pic.twitpic.twitter.com/EUn6Do52Bk


On a positive note, the #yen is still falling making a new low today. Falling yen is positive to a rising market here pic.twitter.com/Wp76HiQlO5

Junk bonds are falling again. Most indexes haven’t made significant new highs, some haven’t made new highs. Meaningful? Maybe, but be wary
A correction could finally take place in the market. But it’s possible we could be having a high level correction presently. We’ll see later
1st chart is SPX, 2nd chart is SPX futures Look at 2nd chart, the advance has made little or no headway since 10/31 pic.twitpic.twitter.com/lXxIfcx7MG


Lots of pessimism after the strong rally. Ratio calls/ puts was 81 or for every 100 puts bot, there were 81 calls bot pic.twitter.com/9mF4sv39PK

Explaining Quantum Mechanics, with more weird stuff ???sciencedaily.com/releases/2014/…
“emotional low” followed by rally, then 6-8 weeks of consolidation, SPX declines & tests the low & sometimes breaks below low – Jeff Saut
V-type bottoms are rare, & that’s what we saw on Oct 15/16th. Typically what happens is a decline into an “emotional low” – Jeff Saut
Nikkei with downtrend line and 2009 pitchfork. Recent uptrend in Tokyo attributed to declining Yen pic.twitter.com/3tigZQXWnd

Look for Republicans to win back Senate leading to upside blow off in the market, which I would use to take some profits – Jeff Saut
#History always repeats, only the details change – #EdsonGould Edson Gould’s #FindingsandForecasts articles stock-market-observations.com/category/2-eds…
Super Secret Indicator DJUA participated in correction. Previously it rallied during a correction. Attention needed. pic.twitpic.twitpic.twitter.com/9orc4G2Pcu


Super Secret Indicator DJTA participated in correction. Previously it rallied during a correction. Attention needed. pic.twitpic.twitpic.twitter.com/EkDmOC3pFO


Super Secret Indicator DJIA participated in correction. Previously it rallied during a correction. Attention needed. pic.twitpic.twitpic.twitter.com/Dx0saoG30F


Maybe we will have a blowoff phase (lasting months) before we have a market correction. Money trumps EVERYTHING.
The Yen (green area) is shown INVERSE to match the stock market direction. The YEN could be a BIG deal in our market pic.twitter.com/Ytp9pHPOD1

Previous tweet – you can see that the falling yen affected our market for a lot of months. This “could” mean our market will rise for months
Keep your eye on the Yen for direction in our stock market. Yen fell after BOJ increased monetary stimulus 10/31/14 pic.twitpic.twitpic.twitter.com/b8Q0IVrUXY


That’s all my charts and comments for now. youtube.com/watch?v=gBzJGc…
Long term declining #trendline for Tokyo. pic.twitter.com/7O4IBKMcew

Chart of London #FTSE since 1998 with an upward wedge beginning in 2008 to the present. pic.twitter.com/zzUbhSdCaH

Value Line index since 1980 showing triple top, current pitchfork, and descending line for bottoms. pic.twitter.com/dRYRu8YD1U

Long term chart of #SP500 since 1980 with the wave count from 1982 to 2000. Large steps green III, IV & V are labeled pic.twitter.com/vzuEMPyzRH

Either a long consolidation pattern, or the epitome of a sawtooth top. pic.twitter.com/VpMr117Khk

#Russell2000 (#RUT) has a possible #headandshoulders formation with the neckline a little below present prices. pic.twitter.com/8MYrlyjbJp

#SP500 on bottom line of pitchfork. Breaking of this line “could” denote end of step 3 since Oct 2011 ??? pic.twitter.com/ngymzayzgw

Internals on utilities sector is not as weak as prices indicate. Strength ahead for utilities??? pic.twitter.com/dRB1eY3qcF

Internals on materials sector is much weaker than the price indicates. More weakness to come in materials??? pic.twitter.com/C2TKE7DEYS

But some investors are moving into money market funds showing a little fear. pic.twitter.com/6pJqdTOCM6

Chart shows what investors are doing with their money. They are still #Bullish and refuse to move to #Bears funds pic.twitter.com/XGaS6Gatme

GE is still leading the way down amongst the blue chips. pic.twitter.com/618pNTVZxB

Small caps are still leading the way down. I would expect this trend to reverse when we have a good bottom. pic.twitter.com/kwMV1qiWQh

New low without a new low in prices. Negative Divergence. pic.twitter.com/mFMaDYGwSb

#Stocks keep going below 200 day MA while having a tepid #rally. #Chart is percentages of stocks below MA in an index pic.twitter.com/Gv1N3EBJXH

High low difference got better today instead of following advance decline line down. My Charts stockcharts.com/public/1169350pic.twitter.com/2PLltWr7Nc

New lows in adv dec line today without price low in large caps. A negative divergence between adv dec line & prices pic.twitter.com/pVckTtddpG

“Futures on U.S. and Asian stock indexes fell after a slump in oil prices and the worst quarterly drop for global equities since 2012”

It is important to remember that all market cycles have two halves. streettalklive.com/index.php/blog… pic.twitter.com/kYptY0ftcn


We’re now exactly 1 month away from the Oct Fed meeting & end of QE3. Most saying it’s diff this time (from QE1/2)… pic.twitter.com/ckYbgWVFDs

My favorite reach for yield indicator under more pressure after Gross announcement, still much more to go IMO. $PHK pic.twitter.com/JUaXliJwG6

Absolutely stunning reversal in Brazil this month. 20% peak to trough decline. $EWZ pic.twitter.com/ojytf2ZDaf


We had a lower low in small & mid-cap indexes today. Could be showing we haven’t finished current & larger step down pic.twitter.com/VDOO89V56L

Be Aware and Be Cautious – until you know otherwise.
But if we break the decline’s lows, you’ll know step 3 down is underway (scenario 2). It could be a waterfall event. pic.twitter.com/eFvRseeVIe

We haven’t made new low since 9/25 (Thu). The rallies have been muted, but until step 3 up is finished, we are in rally mode. (continued)
2 scenarios likely. 1. We rally up to old highs 2. We have completed ONLY 2 steps down and will decline into 3rd step (continued)
Hmmmmm, I have this decline counted as 3 steps down (double bottom 3rd). No new lows since 9/25 (Thu). (continued) pic.twitter.com/veV5YGko8H

#history always repeats, only the details change – #EdsonGould Many Edson Gould’s #Anametrics #FindingsandForecasts articles are on my blog
NOT A GOOD TIME, BUT I MAY BE BUSY WITH OTHER THINGS FOR A COUPLE OF WEEKS I’ll try to tweet important stuff after each day’s market close
“it is worth mentioning that a stronger dollar is an effective tightening of monetary policy.” – Jeff Saut
Headline: “U.S. Stocks Drop Amid Hong Kong Protests”. Why would the #stockmarket decline because of Hong Kong. Bad reasoning for headline.
Look at difference between the wave count on SP500 futures (here) versus SP500 chart (actual index) in prior tweet. pic.twitter.com/rLwoPMP1oY

SP500 chart shows 4 steps down. The 4th step could be a double bottom. Failure on upside means 5th step coming. pic.twitter.com/20Y3dNP2Hd

“Might” be the end of step 3 down since 9/19. Higher highs needed for confirmation of step 3 ending. 5 down or worse? pic.twitter.com/53OpV0HetX

Since 9/19, large caps have 3 steps down & the small caps are missing a step. That means maybe one more step down of differing consequences
The history of the crash of 1929. The years leading up to 1929 and the stock market’s influence on the country youtube.com/watch?v=_YgzVt…
FED paper called “A Brief History of the 1987 Stock Market Crash with a Discussion of the Federal Reserve Response” wp.me/a1DRwF-32f
The two video clips posted of stock market crashes has NOTHING to do with the present I posted them because I like stock market history
Crash of 1987, news clips throughout the trading day of the largest percentage drop in the stock market since 1914. youtube.com/watch?v=UO-mD9…
Charts & audio from the pits for the Flash Crash of May 6 2010 Fun to listen to the emotional breakdown of narrator youtube.com/watch?v=njwf1F…
During QE3: US National Debt: $16 to $17.7 trill. Fed Balance Sheet: $2.8 to $4.5 trill. Both up $1.7 trill. pic.twitter.com/5bgwDnUpXm

Senator Elizabeth Warren called for congressional hearings into allegations that the FED has been too deferential to the firms it regulates.
9/27/14 – Mike Burke Seasonally there is often a bottom after the 1st week of October.
9/27/14 – Mike Burke New lows are all that matters When a bottom has been reached, new lows will diminish quickly No sign of that now.
9/27/14 – Mike Burke For the past 40 years average returns for the coming week have been negative by all measures.
Short sellers have a 12 million share position in Alibaba, a week after the company priced the world’s biggest-ever initial public offering.
Put in $25, Get $10,000 Back. Your Bank Becomes a Casino US banks of all sizes could start tempting savers with savings promotion raffles
Goldman Sachs is changing a policy addressing conflicts of interest to bar investment bankers from trading individual stocks and bonds.
Trend channel break will indicate that step 3 in larger step 3 (began in Oct 2011) is finished. Significant correction will then take place.
An alternate wave count for larger step 3. If true, this count indicates a return to old highs would take place. ???? pic.twitter.com/QQoetTSUmH

A long term wave count since 2009. The only question is whether larger step 3 is finished. pic.twitter.com/HfWTTlcN2F

Fibonacci lines in effect presently for the SP500 and a wave count pic.twitter.com/rMzkgfOkt2

Russell micro cap decline since July 1. Apparently finished step 2 down, it’s not conclusive with a trend break yet pic.twitter.com/uxUqslEtq9

That should conclude the decline that begin on Sept 19. Rally now to new highs? That’s the big question??? More later pic.twitter.com/fVQRi1vFik

Collusion between the FED & Wall St in “The Secret Goldman Sachs Tapes” Article bloombergview.com/articles/2014-… Audiothisamericanlife.org/radio-archives…


.@TheCreditBubble has requested this cartoon from the Summer of 1987 pic.twitter.com/OhrdZVcXuq

No fear without a rise in assets of the bear funds or a rise in assets in money market funds. Both rise in bad times. pic.twitter.com/iVp0AMTD3B

The wave count since July Read about my wave count method at stock-market-observations.com/2011/07/02/odd… pic.twitter.com/zvp10ezq0w

If this cycle stays in gear, we should rally soon. The predicted low date is tomorrow, but it’s not unusual 2 B early pic.twitter.com/4iz4ZfXdPl

90% of total volume was declining today Declining stocks were 83% of the total traded Should bounce after an extreme day, if not, watch out


Mark Twain and his stock market advice of when to buy pic.twitter.com/UoTE5JZiTR


The short term wave count & did we finish step 2? It’s possible. Notice the Fibonacci lines are providing resistance pic.twitter.com/LQpZBz5T7W

Jeff Saut has support at 1965 – 1970 for the SP 500. We bounced off that level today.
Was the decline ending in Aug step 1 down? Smaller caps show it was step 1 down. We started step 2 down Fri 9/19/14 pic.twitter.com/sgMwMUZFaM

The first step was Fri to Tue & we are in second step down of 3 steps. My method of wave counting can be read here: stock-market-observations.com/2011/07/02/odd…
Surprise, I woke up & saw the market had crashed, I hadn’t been stopped out, but was making money again. Lucky trade on a chancy wave count
Yesterday I counted a poor looking 5 steps up, so I went short again after the close with a stop above the high. My expectations were low.
60 minute envelope in a bottom area early this morn. Rallies usually take place when the index hits bottom envelope pic.twitter.com/8iJOthzhgi

SP 500 futures have recovered 38% of the decline, while the NASDAQ futures have recovered 61% of the decline. Lotsa strength in the NASDAQ.
Triangle formation in oil has been forming since 2011. Downside projection could be $65. That smacks of deflation pic.twitter.com/dg3aLTmEFo


Looking at the percentages, small caps are doing better than the larger caps pic.twitter.com/wxW5e67jZF

We’re obviously breaking the downtrend that began last Friday. If we don’t make new highs, this decline becomes step 1 down (of 3 or 5).
@focus1234567 Yeah I’m going to bed now & reading my Kindle until I fall asleep. I have a wrist lanyard to keep it from falling on the floor
@focus1234567 I’ve been tending in that direction for a couple of years. Jeff Saut says this bull market has years to run.
@focus1234567 makes a man healthy wealthy and wise. You’re getting up and I haven’t gone to bed yet.
@focus1234567 You ever sleep? Don’t say 2008, it scared the crap out of me the 1st time. But someday large 3rd step down will take place!
50 day moving average of the SP 500 is only about 5 points lower. Doesn’t mean much though.
$65 oil in a couple of years??? I’ll post the chart tomorrow that shows the possibility.
Shorter & longer term oscillators oversold. Only if in a serious decline would I expect the oscillators to go lower, otherwise rally soon.
ES futures look like 4 (of 5) steps, but a trend break is the deciding factor whether the complete step is finished pic.twitter.com/PA6u6wMWOf

Large caps have no steps down & if an intermediate term decline has begun, 3 steps down are coming. This matches the prior chart’s count.
The count in this chart shows 3 more steps down. 3 more steps down puts large caps in gear with this chart. (cont.) pic.twitter.com/kGXEU9OraQ


One of these days, the uptrend is going to end and stocks will slice right through oversold readings. Until then, the trend is your friend.
@focus1234567 I’m watching a small time frame decline (Fri to Tue), which could morph into a larger decline. If true, this is step 1 down.
NASDAQ has rallied off of their lows, while DJIA and SP 500 are on their lows of the day.
Market is breaking down and sub stepping into more steps down. I’ll update the count later in the day.
The indicator in the lower window indicates a rally should be expected. pic.twitter.com/5MWhz3I5GE

The NASDAQ Composite is one of the stronger indexes after hitting its 3 count. pic.twitter.com/Yc7yNHAcfd

The DJ Ind may have just finished their 3 count. We’ll see. pic.twitter.com/HNBOdZWkEw

The 3 count as I see it presently in the SP futures. These are 12 minute bars. pic.twitter.com/FASrwh9hAX

Market weakening and we may be sub stepping into 5 steps down instead of 3. Won’t know for sure until we make a lower low.
We don’t have an end to the recent decline until we break the trend line for this decline. This hasn’t taken place yet.
I count 3 steps down in the futures. If “true”, a rally should take place. If we are in a larger decline, this marks the end of step 1 down.
Lots of trend lines on pages 6 and 7 stockcharts.com/public/1169350
First 2.5 pages of my charts have the best indicators. Lesser indicators follow, not bad or unreliable, just lesser. stockcharts.com/public/1169350
Read about the Elder Impulse System, which is used on my index charts.stock-market-observations.com/2012/01/30/eld…
Page 6 of my charts are daily & 2 hour. Page 7 is monthly & weekly charts. All are displayed in Elder Impulse System stockcharts.com/public/1169350
My charts are shorter & if you’re only interested in indicators, see the first 5 pages. For charts, see pages 6 & 7. stockcharts.com/public/1169350
Gann said that markets tend to top on or around Sep 22nd more often than any other day. This is also the date of the Autumnal Equinox
SP 500 trend line since Mar 2009 bottom. This is not a log chart. pic.twitter.com/Z1z3FPUGvR

Jeff Saut says “I think Dow Theory “trumps” everything because it tells us the primary direction of the equity markets,”
@spirocks If you have a multiple personality disorder, you can lie to both of us
@Stock_Trend_Chg Decent record getting MAJOR inflection points correct
All of the charts displayed today can be seen at My Charts linkstockcharts.com/public/1169350 I have also reduced the number of charts
Trend lines and cycles for Value Line Index since 1980 pic.twitter.com/JX9BIlN4VO

SP 500 trend lines, cycles and wave counts since 1980. pic.twitter.com/7QTgJVMht2

Possible trend lines for Russell micro cap index pic.twitter.com/cARWjtqiT9


Russell top 50 trend lines Index is the 50 largest cap stocks pic.twitter.com/dKPk7MpmKA

Russell 1000 trend lines Index is the largest 1000 stocks pic.twitter.com/VJrVySpcII


Russell micro cap Pitchfork trend lines to the downside pic.twitter.com/KRxCqO7ZIS

Semiconductor index Pitchfork trend lines pic.twitter.com/hSdHoNMJIp

The weekly unemployment claims continues to strengthen. The job claims is inverted from its normal downward trend. pic.twitter.com/WTtczpm7CH


Smaller caps went from leaders in July to extreme laggards. Smaller caps are ready to go negative for last 4 months pic.twitter.com/2wdtWR7cc0

Russell index weakness is spreading from the micro caps to the larger caps pic.twitter.com/UGiKM2HfUe

Emerging market stocks are warning of impending weakness pic.twitter.com/GzjMsfOAOZ

Volatility warnings of an impending market decline. The most recent warning was last week. pic.twitter.com/Te1Td0yuV5

This chart says we are in 2nd step down. See this link for an explanation of my wave counts stock-market-observations.com/2011/07/02/odd…pic.twitter.com/nX5yNbZLjw

Percentage of today’s declining volume and declining stocks was about 85% each. 90% represents an extreme figure.
Longer term overbought oversold oscillators are nearing an oversold reading. pic.twitter.com/couNsIDF98

Lotsa weakness in the NYSE stocks above their 20 day MA. The decline just began, but this is closer to recent bottoms pic.twitter.com/AdROQipslE

Finally weakness is showing in the SP 500 average price relative to its 52 week high low pic.twitter.com/oZoRY0nWH9

Also weakness in the SP 500 for stocks above their 50 day MA. pic.twitter.com/EPev2bcFkI

On the recent peak, the SP 500 was showing signs of weakening for stocks above their 200 day MA pic.twitter.com/NXDkkG9G1G

Stocks above 200 day MA on NASDAQ are growing weaker. Ditto for ALL small cap indexes showing 200 day MA weakness pic.twitter.com/cHFl082AXm

The put call ratio isn’t in sell territory. Is it infallible, no, but it has a decent record of getting calls right. pic.twitter.com/zi4SxLXkv9

NASDAQ high low ratio has been in a correction mode for the last 2.5 weeks also. pic.twitter.com/TyUfL17awA

NYSE high low ratio has been in a correction mode for the last 2.5 weeks. pic.twitter.com/veJ5DHZaip

Cumulative advance decline is now leading the market lower. pic.twitter.com/Vom5uM9fTB

Was last week’s breakout a bull trap?? We’ll find out if we break significant lows. If not a trap, we’ll see more upside before a reversal.
Alibaba’s PE ratio is 60 (at $90). Google PE is 31, Amazon PE is 504, Netflix PE is 165. Is Alibaba in the same class as these stocks???
Alibaba IPO price was $68, reached $97 opening day & now trades at $90. Julian Robertson loves Alibaba. Remember when Google IPO was $85????
Breaking the trend since Oct 2011 is the big Kahuna, after that, a significant market correction can take place. When does that happen???
@taxfreelt Hard to tell, large caps are stubborn, small caps are already in decline. When we break trend since Oct 2011 the rout will be on
Not a good day today. The DJIA is down about half of the decline in the SPX. Smaller the cap, the bigger the decline pic.twitter.com/NkIGoZKABO

Do my charts mean the market is going to decline immediately? No, but . . . And markets usually go much higher than thought possible
Is Emerging Market Currency leading the stock market to the downside??? pic.twitter.com/oai0wmzQ3V


Weekly unemployment claims (inverse chart) are moving lower as economy strengthens. QE ends soon & what happens then? pic.twitter.com/YISi3hNYk3

Japanese Yen and the US bond market are almost in lock step. pic.twitter.com/C51vyqm1x5

McClellan Summation Index has been falling while large cap indexes are making new highs. pic.twitter.com/jDlNc9IsM9

New highs in the large cap indexes, but stocks above their 20 day MA were falling instead of confirming indexes pic.twitter.com/BfLvWTDzdb

Bearish divergent action between cumulative advance decline & large cap indexes, AD line failed to confirm new highs pic.twitter.com/EPMaMjqAFi

Breadth indicators very negative, seasonality for the next 2 weeks is negative. Conditions are in place for a cycle top. – From Mike Burke
Hindenburg Omen occurred on Thu & Fri. Signal not been valid in recent years, but conditions are similar to previous significant declines
The SKEW index has been in an uptrend since late 2013. As the index goes up, the odds of a correction go up too. pic.twitter.com/dy2gfS5UQc

Since Nov 2012 SP 500 has had corrections of -8%, -6%, -4% and -4.5%
My Charts can be seen at: stockcharts.com/public/1169350
My Charts are showing that small & midcap stocks are performing poorly Seasonality suggests that they may outperform in Nov & Dec???

Greed and Fear of Markets The excitement over the Alibaba IPO is in direct, opposite proportion to the fear after Lehman’s failure
Russell 1000 (top 1000 stocks) New intraday high with a loss and an outside day – both potential reversal formations pic.twitter.com/zYi0r4Lv92

Today I’m seeing an outside day on many stock market indexes. Some indexes had new intraday highs signifying – reversal day. Double Whammy!!
NO wins in Scotland and that’s carrying over to Wall Street tonight.
Patience is good in the stock market, but some never learn to wait for the right moment. pic.twitter.com/TIM0mlyqbe

In 2008 stocks were a good buy . . . Goodbye Mercedes, goodbye yacht, goodbye vacation home, goodbye . . . Ed Hart (modified for today)
Market Correction – The day after you buy stocks. – Anonymous
Money talks, but all mine ever says is “goodbye” – Anonymous
Those who can . . . do Those who can’t . . . teach Those who can’t teach . . . work for the government. – Anonymous
P/E ratio – The percentage of investors wetting their pants as the market keeps crashing. – Anonymous
Often times WHEN you take a position can be more important than WHAT you take a position in. – Anonymous
The public is right during the trends but wrong at both ends. – Humphrey Neill
Nobody is more bearish than a sold-out bull. – Anonymous
A buy and hold strategy is a short term trade that went wrong. – Anonymous
A bubble is a bull market in which you don’t have a position. – Anonymous
The hardest part of a bull market is staying on. – Anonymous
This is expiration week for Thursday & Friday. We don’t get the crazy volatility like in the old days, but some volatility is expected.
Market is oversold & should rally more, but SP500 is finding it difficult to rally at the moment. pic.twitter.com/en0doAFVWX

4 day Fibonacci fan is working very nicely showing resistance and support on the SP 500 futures pic.twitter.com/GXYfJDv09Z

Close up view of the John Murphy chart immediately below. pic.twitter.com/NL1siwkqtK

John Murphy Favorite for long term signal Above the zero line is a bull market, below the zero line is a bear market pic.twitter.com/GL3NN0PZWT

Stochastic buy/sell signals for the Russell 2000, ETF is IWM pic.twitter.com/TRYgep49pp

Total market cumulative advance minus declines versus the SP 500. Negative divergence taking place presently pic.twitter.com/44yxufeNMC

Putt / Call Ratio showing moving average extremes for a buy or sell point. pic.twitter.com/4BTnl5nzb8

All of the preceding charts seen here are available at the following link:stockcharts.com/public/1169350
Stocks making a 52 week high in S&P 1500 are in a bearish divergence with index prices, slow topping indication pic.twitter.com/cUife90OTT

Stocks making a 52 week high in S&P small cap index are in a bearish divergence with prices, slow topping indication pic.twitter.com/4jbaL1kcjC

Another chart showing loss of upward momentum in the number of stocks above their 200 day MA in the SP 600 index pic.twitter.com/vbGCVWOJB8

Showing loss of upward momentum in the number of stocks above their 200 day MA on the NASDAQ, slow topping indication pic.twitter.com/RSCXZpBtcJ

My Stock Charts stockcharts.com/public/1169350
Follow my blog – Find some different ideas, papers written by Edson Gould, Terry Laundry, unique wave count theory stock-market-observations.com
Paul Desmond wrote an article on market bottoms, which won the Market Technicians (MTA) Dow Award in 2001. mta.org/eweb/docs/2002…
Paul Desmond’s of Lowry Research lowryresearch.com wrote an article on market tops. stock-market-observations.com/2014/05/27/527…
If interested, you can read about the Elder Impulse System at the following link stock-market-observations.com/2012/01/30/eld…
Usually, the first warning sign that a Bull market is losing upward momentum occurs when the % of stocks rising to a 52-Week High contracts.
Tell your friends, neighbors, relatives, enemies, psychos and the homeless to become a FOLLOWER OF MY TWEETS.
Dow Theory Buy Signal – this is 2 days in a row for a buy signal. It’s not yet a significant new high for the industrials
Dow Theory Buy signal will occur today if the industrials & transports close somewhere near present price levels. It seems to be sure thing
The main purpose of the stock market is to make fools of as many people as possible. – Bernard Baruch
If all you have is a hammer, everything looks like a nail. – Bernard Baruch
I made money by selling too soon. – Bernard Baruch
Men, it has been said, think in herds; it will be seen that they go mad in herds, while they only recover their senses slowly, & one by one.
Emotions are your worst enemy in the stock market. – Don Hays
Stock are bought on expectations, not facts. – Gerald Loeb
If you have trouble imagining a 20% loss in the stock market, you shouldn’t be in stocks. – John (Jack) Bogle
The chart possibly shows 3 steps up. What appears to be 2 close steps is likely 1 step. Step 3 may still be ahead??? pic.twitter.com/JX7NHXEU9l

Yup, that’s me staying at the cardboard box suites behind the Four Seasons pic.twitter.com/gLbhKlDLos

“This time it’s different” was prevalent during the bubble of 2000. In 1929 it was called “New Economics”. – Bob
The four most dangerous words in investing are “This time it’s different”. – John Templeton
The rally today was due after completion of a 3 step decline. Rally may see new highs, but significant new highs??? pic.twitter.com/qm2mzhmapN

Today was unusual prior to a FED announcement. Normal is a flat market. If tomorrow morn. is STRONG to upside, expect more of same after FED
Today was a good bounce for large cap stocks. Smaller caps had half of the large cap gains. See – PAGE 5 CHART 7 stockcharts.com/public/1169350…
Dow Jones Industrials and a Fibonacci fan since the 2000 peak pic.twitter.com/tn7uDDEymG

Dow Jone Industrials since Oct 1928 and the overall wave count since 1929. pic.twitter.com/vdKcCzXTKf

Dow Jones Industrials since 1966 and the wave counts during that period. pic.twitter.com/OOlquAPSJ7

HIO junk bonds has been in a downtrend since Jan 2013 pic.twitter.com/8lzp5MmwcT

Junk bonds (JNK) since 2009 bottom, converging triangle since 2011. pic.twitter.com/pNHnUK9VYU

Trend lines, wave counts, Fibonacci lines for Russell 2000 since late 2009 pic.twitter.com/WEuB7zdiOb

Trend line channel since June 2012 in the SP 500 pic.twitter.com/LHxnfeunkt


Gold ETF & we’re looking for a “possible” break of the current trend channel, beware subdivisions extending the trend pic.twitter.com/kwk9iy5wkk

The count since Aug 8. FED announcements can make counts difficult to follow by wild swings in both directions. pic.twitter.com/9ap9f3rUQI

The Russell micro cap index has a downside trend line still intact. pic.twitter.com/KSeAqfTmlo

A “possible” new trend line? Will the top line hold over next few hours. FED announcement may shred this trend line pic.twitter.com/LslqjW0Lev

SHORT TERM CYCLE Recent cycle lows have occurred 1 day earlier than designated. Yesterday’s cycle low was 1 day early pic.twitter.com/byoQrssNcO

Same cycle as below in present. Cyclic lows have been shallow since 2009. Next cyclic low anticipated around May 2015 pic.twitter.com/tOFBx9gaCo

HISTORY: Crude intermediate term cycle of market action before 2007 peak & after the 2009 bottom. RELATIVELY accurate pic.twitter.com/vittPW3W0u

Rule#1: Never lose money. Rule #2: Never forget rule #1 – Warren Buffett
Buy on the cannons, sell on the trumpets. – Old French Proverb
The time of maximum pessimism is the best time to buy and the time of maximum optimism is the best time to sell. – John Templeton
The market prior to FED announcements consist of (1) FLAT TREND (2) Decisive & CONTINUING moves usually carry through after the announcement
The declining channel that existed since Sept 3rd has been broken on the upside. Fireworks begin for real at 2pm Wed. pic.twitter.com/cITxRHLsea

Cell phone only lanes in China Ever wonder if USA is falling behind technologically & isn’t innovative anymore?? LMAO pic.twitter.com/Mf0cOxbSPm

“The essence of investment management is the management of risks, not the management of returns.” – Benjamin Graham
Not good odds for this month. When the SP 500 was up more than 3% in August and at 12-month high, September was up only 8% of the time.
I know old traders, and I know bold traders, but I know no old and bold traders! – Anonymous as retold by Jeff Saut
Minor breakdown on these trend lines today pic.twitter.com/ReA76BcXTS

Very short term count for the SP 500 Several possible trend lines for the current decline (blue and green lines) pic.twitter.com/6WOV9Xn33N

Stocks fell as investors speculated FED may raise interest rates sooner than estimated cuz retail sales climbed at fastest pace in 4 months
The NASDAQ is not really in a down trend. This is a horizontal formation presently. pic.twitter.com/2fU4nUseNA

An early trend line possibility, we’ll see if it holds up for awhile. pic.twitter.com/FmE1pp5Nc5

Credit above tweet to John Murphy at StockCharts
Stocks favorable with strong $ $ – green area SPX / World Index – black line 1999 decline was from asian money crisis pic.twitter.com/BnFbZwkIei

Credit the above tweet to John Murphy
DOLLAR APPEARS TO BE FORMING MAJOR BOTTOM RISING DOLLAR IS BEARISH FOR COMMODITIES STRONGER DOLLAR FAVORS U.S. STOCKS pic.twitter.com/IQLaORwU1z


Is gold extending down into a 5 count, or making a double bottom? 5 count reinforces deflationary scenario in Europe pic.twitter.com/GaaU1ttObb

Russell micro cap index stopping a decline at the lower pitchfork level pic.twitter.com/ASzWWmtagw

SP 500 over the last month with a 5 count and a correction pic.twitter.com/GcopgmQOI2

NYSE index over the last month But many other indexes have gone to new highs well above the prior high. pic.twitter.com/4YoScLQvcg


Jeff Saut remains cautious & we’re in a secular bull market. His “but” is we could have a correction. He mentions things that bother me too
Shallow trend line in the micro cap Russell index pic.twitter.com/ysVDTwAeNb

Worst case scenario is that the megaphone could be ending soon. No clue which long term scenario is in place.
OIL BREAKS TO NEW LOWS AND TAKES GASOLINE WITH IT. More higher dollar repercussions.
“75% of American Adults are concerned about inflation.” – Rasmussen, August 24
“Eight-Year Loans Fuel Car Sales as Debt Warnings Ignored” “On a 96-month loan it takes 80-plus months before you are back in the money.”
“New-home prices [in China] fell last month. In Wenzhoa, 56% of the homes were abandoned due to falling values.” from Bloomberg, August 20
“We have more leverage and more derivatives risk than we’ve ever had.” from the Financial Times, August 20
Historical steps since 1928. Today we are in a very large megaphone formation. This formation “may” take years to end pic.twitter.com/Xl3pCM9MsE

A significant decline within the bull market channel could label the bull market since 2009 as a large step 1. Followed by steps 2 & 3.
A couple of years ago I became aware of a possibility of a significant decline and still continue the prevailing bull market. (continued)
Recent step history. It would take a large decline to break the channel for the 2009 bull market. (continued) pic.twitter.com/fHIGn62hPc

This looks like a bad news is really a good news event. Bad news means FED might not end QE.???? The step up since Oct 2011 is geriatric.
The count up since 8/7/14 “could” be as pictured. Without a channel break there’s no trend break or reversal pic.twitter.com/ldbKgrk91M

Action by the ECB to weaken Euro to combat deflation would push the dollar higher. This would push commodity prices even lower – John Murphy
Look at the plunging Euro. Euro zone has lotsa problems, wondering how their problems will affect USA (trade) ??? pic.twitter.com/2wBbWTfjGf

John Murphy was showing today how the rising dollar is lowering the price of commodities (including oil) pic.twitter.com/BgGA3at17F

“My Charts” – Indicator Explanation – Page 1 has been posted to my blog, use the link below wp.me/p1DRwF-30N
(Putin’s) . . . reminder that Russia is a major nuclear power. To me, it is pretty eerie our markets can ignore such rants. Says Jeff Saut
“My Charts” – Indicator Explanation – Page 1 wp.me/p1DRwF-30N
—————————————————
- Please follow MY CHARTS so I’m not relegated to the dung heap of nobody is interested in this crap. You only have to follow once. Click the blue icon seen in the upper right of each page that says “Follow”. After you’ve clicked once, the blue icon should change to “Unfollow”. Leave it so it says “Unfollow”.
—————————————————
- Click on any chart to enlarge it
- All Rights Reserved © ™
- Leave me a comment just a few inches below, look for:

- If you only see the following:

- Click on “Be the first to comment” and you’ll see:

February 1, 2015 at 9:55 AM
You probably read my Tweets already on Twitter. I was trying to convince any remanent blog reader to come on over to Twitter.
Visitors to my blog these days are coming from Twitter to take a look-see at my stuff, or read Terry Laundry. I have the T-Theory Foundation’s blessing on my reposting of Terry’s free material. After I croak the foundation will pay to keep my blog up for referral purposes. It’s a done deal. But they also could take the blog down if they desired at a later date, but that wouldn’t benefit them from a publicity standpoint. I have a fair amount of visitors to my blog every day looking for Terry Laundry’s writings. From those articles I refer them to his encyclopedia, which is the most complete reference for Terry’s work.
LikeLiked by 1 person
February 1, 2015 at 1:26 AM
Thanks Bob for this update and all the tweets.
Michael
LikeLike