02/05/14 – Bottom News – Watch My Tweets

02/05/14 . . . by Bob Karrow
WAVE COUNTS
- If you aren’t familiar with my unorthodox wave counting method, there is a simple explanation at the beginning of the glossary. The glossary also contains other details that don’t appear in the blog.
TWEETS
- My tweets are like a frequent two line blog accompanied by charts.
BLOG
- My blog is published irregularly. The best way to keep updated on what I’m thinking is through my tweets.
MY CHARTS
—————————————————————————————
- I tweeted late last night:
- Bob Karrow @BobsWaveCounts 13h
- I’m watching tonight’s decline to see if we can get another bottom in the area of yesterday’s low point.
- This morning I tweeted:
- Bob Karrow @BobsWaveCounts 12m
- Looks like we have the bottom that I tweeted about last night. Now we’ll see if we can get a few days of rally.
The market might take stabs #4 and #5 at the bottom before rallying, or it could always breakdown again. You never know for certain as the only confirmation is when you see higher highs on the chart. That’s what I’m watching for on the chart.
At best I think this is “could” be a tradable rally, but not “the” bottom. “The” bottom probably won’t arrive for quite some time.
The following chart is the SP 500 futures showing the last few days of trading.
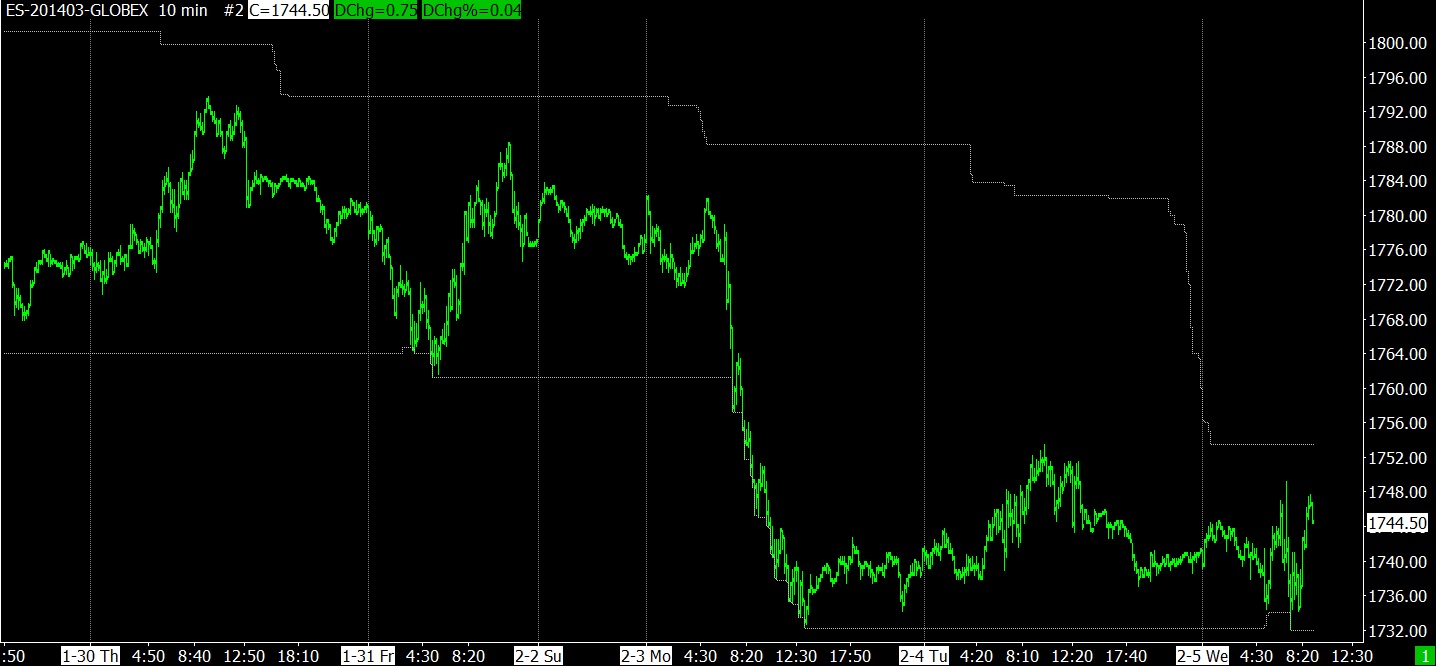
02-05-14 ES 10 MINUTE
And the Dow Jones Industrial futures trading over the same time span.
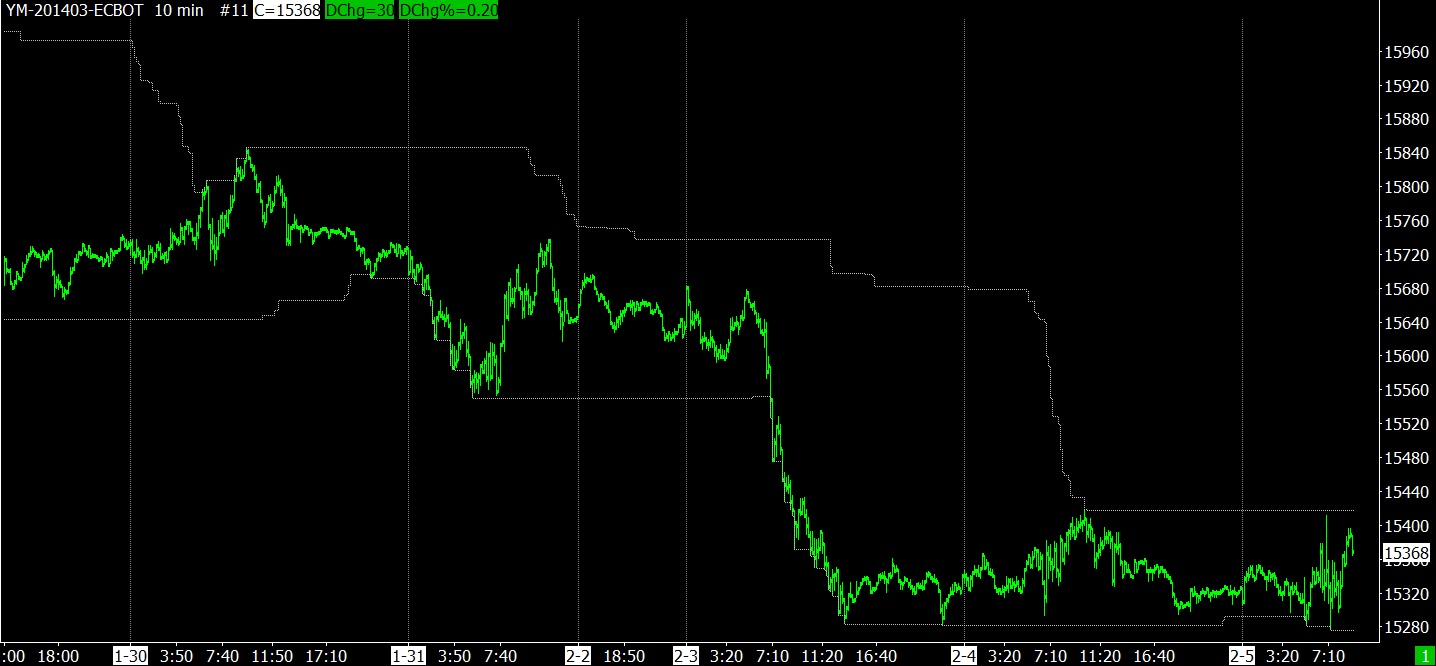
02-015-14 YM 10 MINUTE
—————————————————————————————
- Click on any image to enlarge it
- ES is SP 500 futures
- YM is DJ Industrial futures
- NQ is NASDAQ Composite futures
- All Rights Reserved © ™
- Leave me a comment just a few inches below, look for:
Leave a reply
- If you only see the following:

Comments
- Click on “Be the first to comment” and magically you’ll see:
Leave a reply

Leave A Reply