02/03/14 – Jeff Saut, Hedge Funds, Dow Theory

02/03/14 . . . by Bob Karrow
WAVE COUNTS
- If you aren’t familiar with my unorthodox wave counting method, there is a simple explanation at the beginning of the glossary. The glossary also contains other details that don’t appear in the blog.
TWEETS
- My tweets are like a two line blog accompanied by charts.
BLOG
- My blog is published irregularly. The best way to keep updated on what I’m thinking is through my tweets.
MY CHARTS
- A smaller version of my prior charts is back up.
—————————————————————————————
I don’t think Jeff will swing into a hard core bearish position unless we get a full fledged Dow Theory Sell Signal, which doesn’t come until we violate the June 2013 lows. He appears cautious and probably is looking for something like a 7-8% decline. I don’t have any problem with that outlook, but perhaps we could decline as much as 10% before a sustained rally takes place.
Jeff had remarked last week that this has some of the earmarks of the 1998 Asian currency crisis.
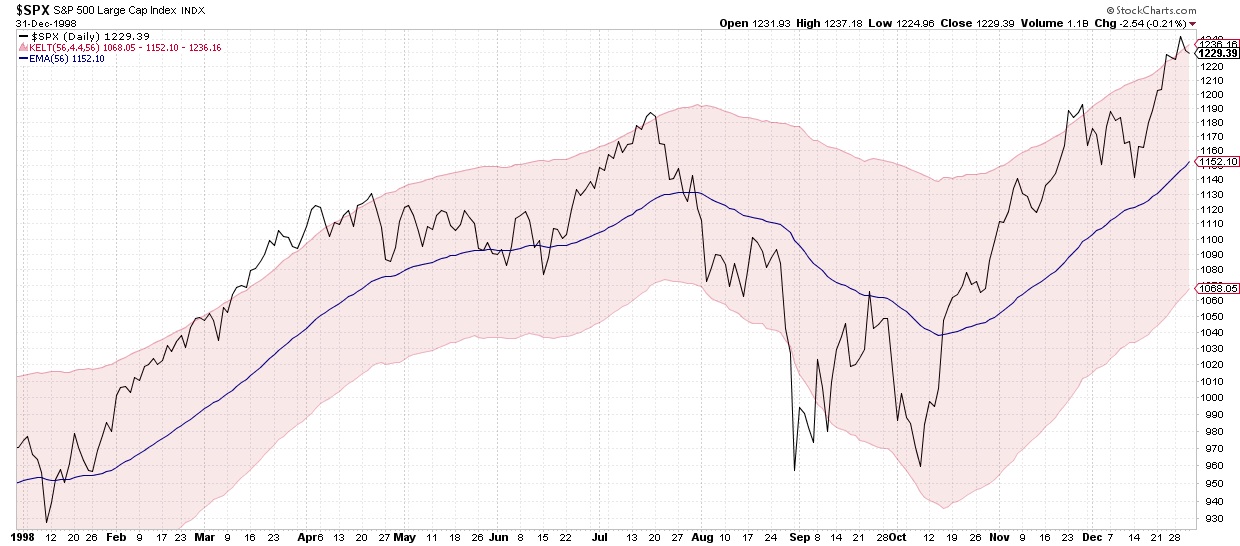
1998 SPX DAILY
One of the hallmarks of that crisis was Long Term Capital hedge fund that was bailed out by the FED to keep an orderly market. More details at: Long Term Capital
With the advent of highly capitalized hedge funds, there is always the possibility that they can induce a crisis similar to 1998 or 2008. I don’t think anyone likes being threatened by lunatic hedge funds that can damage the market and create waterfall crisis declines. Someday the FED or the government will not (or won’t) be able to bail them out and we’ll be back into a 2008 Lehman Bros crisis again.
I have no idea if a hedge fund is in trouble, but with the overwhelming optimism that preceded this decline, it would not be surprising to see a hedge fund having problems. You gotta be in the know and hear the whispers on Wall Street to know that something like this is taking place. Poor idiots like us on Main Street find out after the damage is well underway.
Presently I am on the lookout for some type of repeat of the July to October 2007 scenario (or 1998), where we had a decline followed by a rally to new all-time highs. This was followed by a large decline. Nothing ever repeats exactly, but there can be similarities.
After the Asian currency crisis, the market continued rising for approximately another 15 months. The 1998 peak was the traditional peak in the 1982 to 2000 bull market. There is a possibility in the wave count that we could do something similar to 1998. Perhaps we’ll get lucky and see a repeat of 1998.
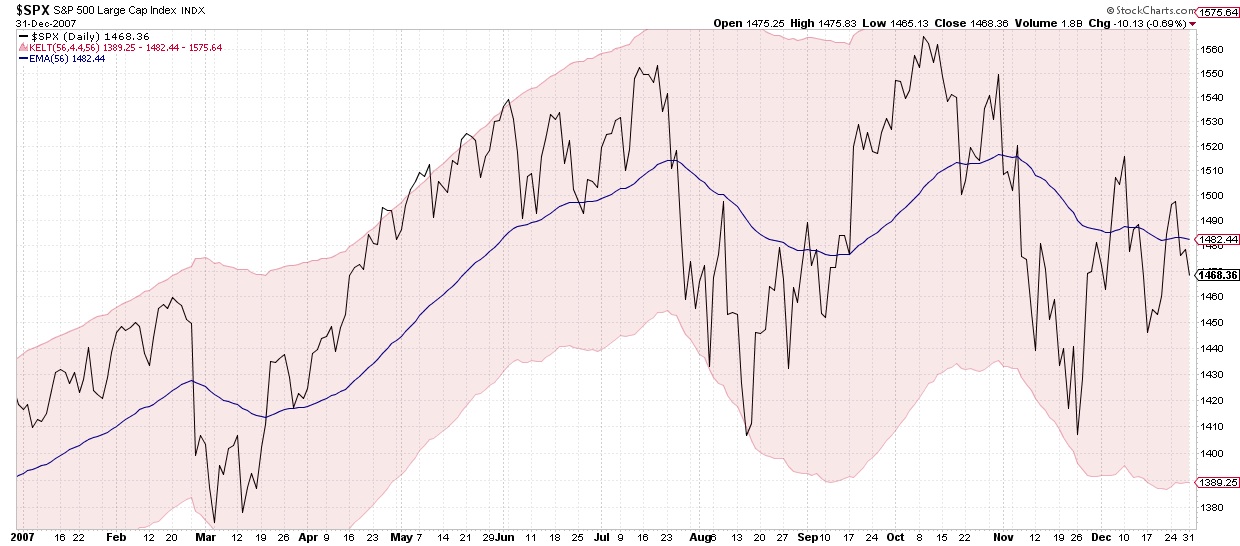
SPX 2007 PEAK
Jeff remarks about good earnings being reported for the 4th quarter and how the outlook is good for 2014. I’m really unimpressed by this metric because every bear market begins with everything rosy and getting better. I’m not saying Jeff isn’t correct, but I am saying it’s not a valid reason to base a prediction. Things happen and usually we don’t have a clue in real-time.
We did have a mini-Dow Theory Sell signal today when the Dow Transports closed below their December low. Prior to today, we had a non-confirmation sell signal.
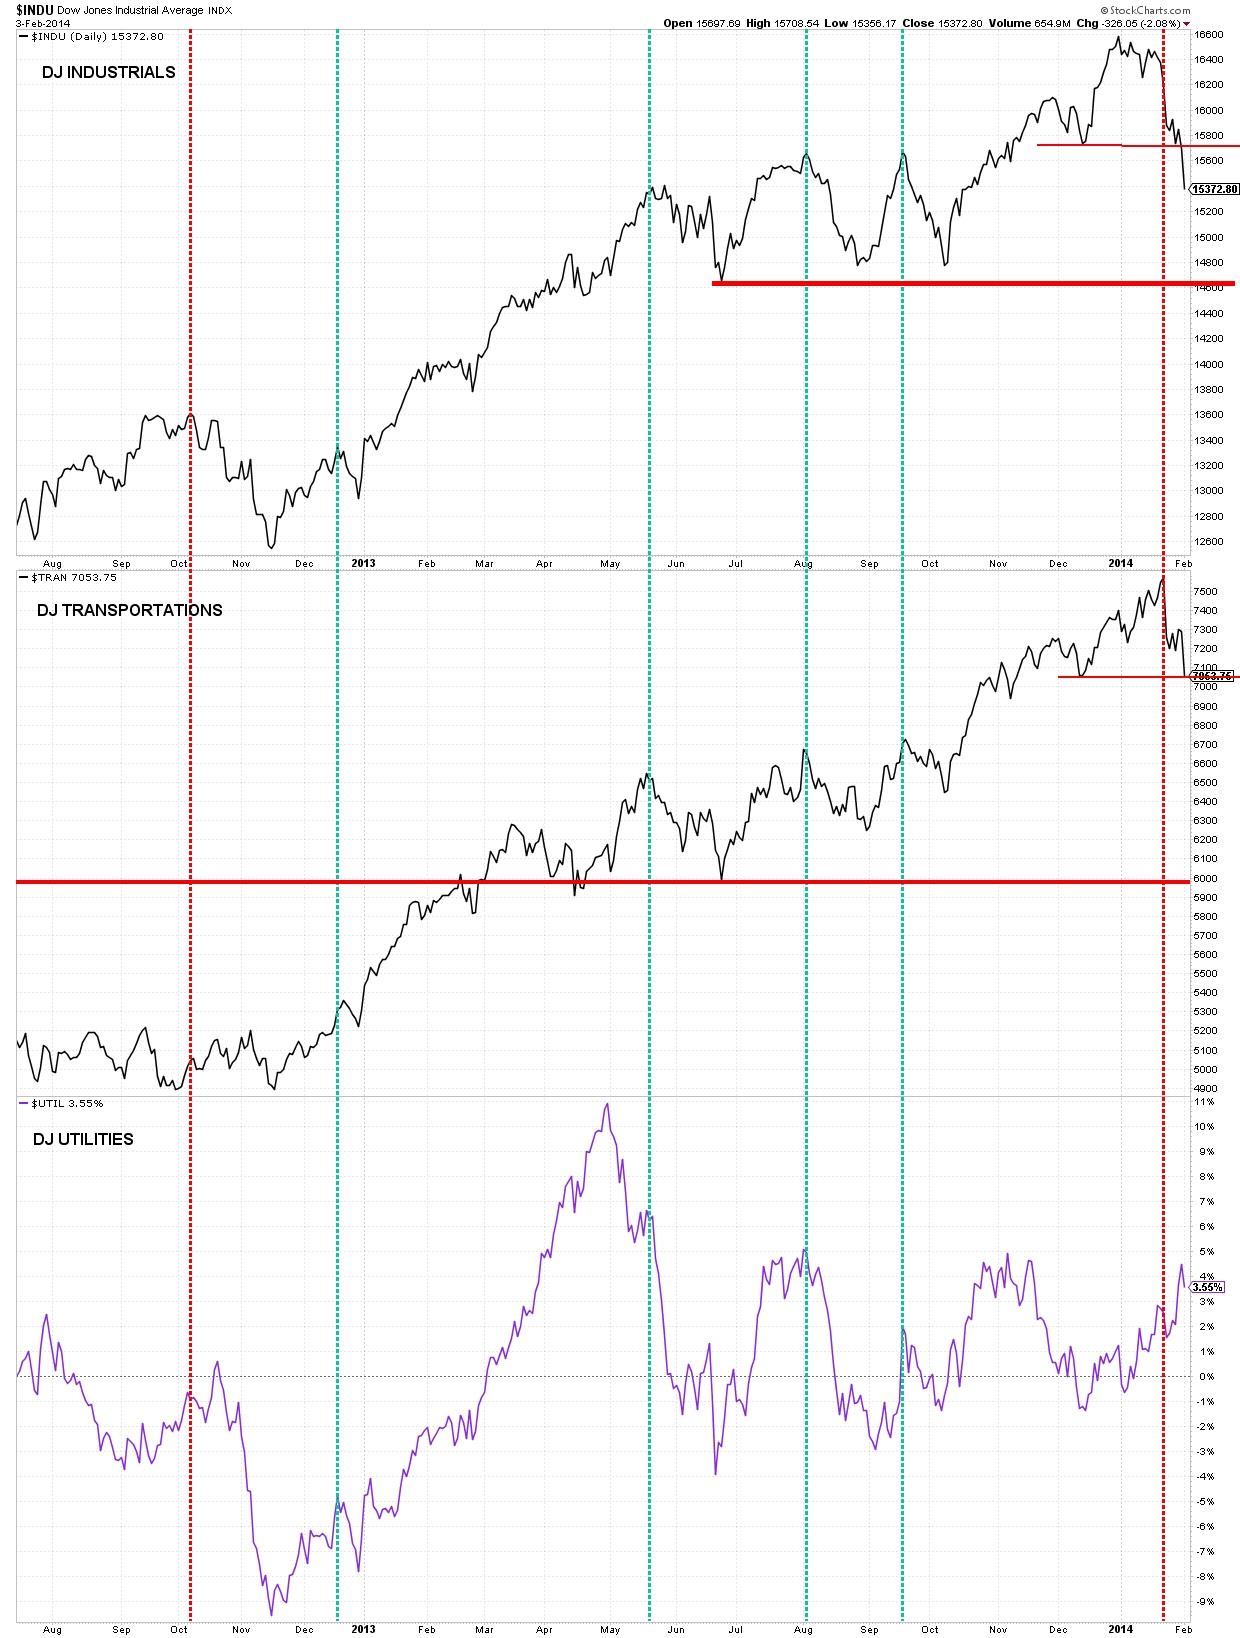
02-03-14 DOW THEORY
JEFF SAUT
“Tinker to Evers to Chance”
February 3, 2014Last week I was inundated with questions from the media about why the rise in our interest rates, and the Fed’s “tapering” announcements, had roiled the world’s markets. After stating the Federal Reserve should likely only be concerned with domestic policy, the reality is the U.S. dollar remains the world’s reserve currency and therefore the Fed is the world’s de facto central banker, I then asked the question, “How can we all eat at the same table and disagree about what’s been served?!” Indeed, at the end of last year the yield on the 10-year T’note was 3.03%. Two weeks ago today the 10-year was changing hands at a yield of 2.82%, 21 basis points lower. So the argument that the rise in our interest rate complex is what started the recent rout is “pretzel logic.” I think thecausa proxima is a perfect trifecta. The trifecta started with HSBC’s Flash China PMI (Purchasing Managers’ Index) report on 1/23/14, which came in below 50 (49.6), suggesting China’s economic growth is still slowing. Second, China is rumored to be considering letting a Wealth Management Product (WMP) default. This is being referred to as China’s “Lehman Moment.” In China, a WMP is a higher yielding alternative to standard bank deposits, but does not have a guarantee. A few years ago there were but a few hundred WMPs; today there is estimated to be more than 200,000. Chinese investors had thought even if the underlying investments in their WMPs went bad, the banks/government/etc. would make investors “whole.” If China sets a precedent and lets this WMP (of only three billion renminbi) go bankrupt, it could start a “run” on the entire Chinese WMP complex. Finally, there was “Tinker to Evers to Chance.”
Now “Thinker to Evers to Chance” was the most famous double-play combination in the history of baseball (Chicago Cubs 1902-1912), so consider this. Hedge funds have been borrowing money in Japan (again) at very low Japanese interest rates, obviously denominated in yen. They then convert those yen to say the Brazilian real, Argentine pesos, Turkish Lira, etc. and buy Brazilian bonds or Turkish bonds using 10:1+ leverage. Accordingly, when such countries jacked-up interest rates overnight their bond markets collapsed. Concurrently, their currencies swooned, causing the “hot money” investors to not only lose on their leveraged bond positions, but on the currency as well (see charts 1-2, on page 3). If you are leveraged when that happens, the losses add up quickly and those positions need to be sold. So the bonds were sold, and the pesos/lira/real that were freed-up from those sales had to be converted back into yen (at currency losses) to pay back the Japanese loans. And as the bonds/currencies crashed, the “pile on” effect exaggerated the downside dive. Verily, Tinker to Evers to Chance!
Of course, such machinations spread over most of the world’s markets as the “risk off” trade accelerated. To be sure, this was/is being reflected in the derivative complex, which is exhibiting many of the same characteristics that preceded the 2008 financial debacle (see chart 3, on page 4), not that I think this will happen again because financial conditions, balance sheets, cash flows, valuations, etc. are in much better shape now than they were back then. It does, however, imply there could be another “leg” down in our equity markets before a meaningful price low is reached. As stated in Friday’s Morning Tack, “Here’s the problem, in addition to the aforementioned cautionary indicators – too much optimism coming into late-January (I wrote about that repeatedly), my timing models calling for a pullback beginning late-January or early-February, my internal energy indicators exhausted – there is this. Since June of 2012 every time the SPX has touched its 100-day moving average (see chart 4, on page 5) participants have been rewarded for aggressively buying. To me that seems a little too pat to play this time.” Yet despite Friday’s Fade the S&P 500 (SPX/1782.59) continues to reside above its 100-DMA, which is at 1769.33.
Even with the survival of a breakdown for the SPX’s 100-DMA , I continue to stay in cautious mode given the fact the January Barometer has rendered a negative signal, as has the December Low Indicator. Recall the January Barometer states, “So goes the month of January, so goes the year.” According to the Stock Trader’s Almanac, “This indicator has registered only seven major errors since 1950 for an 88.7% accuracy ratio.” However, using the same data since 1978 shows a more positive result in that most of the time, following a down January, the SPX rebounded in February into year’s end, leaving it with a yearly gain (see chart 5, on page 5). The exceptions were the recession years of 1981 and 1990, as well as the bear markets of 2000, 2002, and 2008. Speaking to the December Low Indicator, again according to the Stock Trader’s Almanac, “First brought to our attention by Jeffrey Saut at Raymond James, this metric (The December Low Indicator) has proved quite helpful when used in conjunction with the January Barometer. When the Dow’s December closing low is breached in the first quarter of the new year the Dow has fallen further in all but three years since 1950 for an average drop of 9.8%. Combine the January Barometer and the December Low Indicator, and they have been wrong only 4 of the 31 occurrences since 1950.” However, despite January’s “Jam Job,” there still has not been a Dow Theory “sell signal.” For me to get such a signal would require the D-J Industrials (INDU/15698.85), and the D-J Transports (TRAN/7289.18) to close below their June 24, 2013 closing lows of 14659.56 and 5990.79, respectively. Mistakenly, about a week ago, I wrongly stated that those lows occurred in June of 2012; alas to publish is to make mistakes.
As for sector performance, it has been terrible year-to-date with the only positive sector being Utilities (+3.33%), while the Financials (-4.95%) have done the worst. This has left the Utilities well overbought, Technology and Healthcare neutrally configured, and the rest of the S&P macro sectors oversold. Likewise the NYSE McClellan Oscillator is oversold, as is the SPX with the percentage of stocks above their 50-DMAs at a low 39%. Unsurprisingly, 83.9% of the Utilities stocks are above their 50-DMAs, while 0.0% of the Telecom sector stocks are above that DMA followed by 22.5% of the Consumer Staples issues and 25.0% in the Consumer Discretionary sector. Of interest is that the TRAN and the NASDAQ Internet Group remain above their respective 50-DMAs, a pretty decent showing on relative strength. Meanwhile, 65.5% of stocks reporting earnings so far for 4Q13 have beaten estimates and 63.8% have bettered revenue expectations.
The call for this week: Many of the short-term indicators are oversold. That’s like pressing down on a spring; eventually you get a “bong” bounce back. In the stock market’s case you get rally attempts like we saw last Tuesday (+91 points INDU) and again on Thursday (+109 points). It’s worth noting those rally attempts came on reduced volume and none of the indices I monitor were able to gain ground above their respective resistance zones (the SPX’s resistance zone is 1808 – 1813). Further, optimism is still too high as measured by the detrended Rydex Ratio and the AAII Bear/Bull Ratio. This is probably why, as expected, those rally attempts proved unsustainable. Given the oversold readings, we could be in for further rally attempts this week, but the weight of the evidence continues to suggest caution. Manifestly, the Selling Pressure Index has been rising and January 24th proved to be a 90% Downside Day in that more than 90% of total Up/Down Volume came in on the downside and Points Lost was 97% of Points Gained plus Points Lost. Typically, following such days, there are rally attempts, but they tend to fail. And remember, the SPX is only down 3.56% from its recent high. The historical odds called for a 5% to 7% correction sometime in the first three months of the year. A 5% correction (to 1756) leaves the SPX close to within my secondary support zone of 1758 – 1784, while a 7% pullback (to 1719) puts the SPX back into major support between 1700 – 1730. And this morning world markets are relatively flat as PMIs around the world were reported in line, or slightly better than expected. Today we get more information on the ECB bank stress tests, and our ISM Manufacturing PMI (56.0e). This has left our preopening futures slightly higher and should lead to rally attempts into mid-week that again fail.
Jeffrey Saut of Raymond James is a very savvy guy and one of the very few interesting people that I follow. After reading his column over the years, it is obvious that he is smart, insightful and normally right on the mark.
Regarding Jeff’s recommended stocks, some have done well in the past, but quite a few have been duds or outright losers. I think of Jeff as a stock market strategist, a very good strategist, but not a person to follow in recommending specific stocks.
Jeff reminds me of Robert Farrell of Merrill Lynch fame (1970s and 1980s), who achieved a large following and was frequently on target. Bob Farrell was one of my favorites and so is Jeff.
—————————————————————————————
- Click on any image to enlarge it
- ES is SP 500 futures
- YM is DJ Industrial futures
- NQ is NASDAQ Composite futures
- All Rights Reserved © ™
- Leave me a comment just a few inches below, look for:

Leave a reply
- If you only see the following:

Comments
- Click on “Be the first to comment” and magically you’ll see:
Leave a reply

January 14, 2023 at 11:46 PM
Appreciaate this blog post
LikeLike