TEMPORARY REVERSAL ???
 8/15/13 . . .
to help you understand my unorthodox wave counting method.
—————————————————
MY FACEBOOK PAGE – All my Tweets and Blog updates will automatically appear on this page.
—————————————————
We did more damage on the first step down than I thought was going to take place. Presently it looks like we have racked up about 550 points or a 3.5% loss. We should have something closer to a 10% loss when we are finished (that’s just a guess – no valid reason behind that figure). We could go further or less than 10%, but it has a nice ring to it.
Of course if the market has one last gasp left in it (???), the decline won’t be starting yet. We would have to rally back to the old highs and then roll over. BUT if the timing is correct in the Hurst cycle (Oct to Jan), we ought to get going to the downside soon, otherwise we’ll be faced with a waterfall decline. Now that’s a real scary thought.
After this morning’s mini-waterfall decline, we should be ready for a rally (where have I heard that before???). The count thinks a rally is coming but it hasn’t been verified by a higher high. We are probably going to have a secondary bottom later today (Thursday). That “should” be the bottom, unless we are doing some real sub-stepping and that could be packin’ a whole lot more trouble.
I’m thinking we will have a positive rally on Friday and that will be the key day that will show the 3rd step down is finished (for the moment).
—————————————————
LATE ADDITION:
As I wrote this blog the market made a lower low than when I started writing today’s blog. The lows are close to this morning’s low, so all is “reasonably well for a bottom today or tomorrow”.
- If the rally began now, I would call the small rally that was followed by a lower low, step 1 up in a 3 step rally. This is still a possibility because we haven’t made a 2nd low since the mini-waterfall.
- Another possibility is that the market didn’t finish the decline on the mini-waterfall, but needs to trace out 2 more bottoms before launching the rebound rally. I would think the bottom wouldn’t occur until Friday under this scenario.
- Another possibility, no bottom is taking place and we have lots more damage still in store for us.
—————————————————
I think we have more damage to go, but all of it in one continuous step down seems a little bit radical. If that’s true, there could be another message involved in a decline like that. We’ll have to wait and see how it plays out, but for now, I’m looking for a nice orderly 3 steps down ending somewhere in the time frame proposed by the Hurst cycles (Oct to early Jan). Perhaps the 3rd step could be messy and scary. That’s what often denotes 3rd steps.
The 3rd step down that began on 8/13. I updated the following 3 charts about 45 minutes before today’s close.
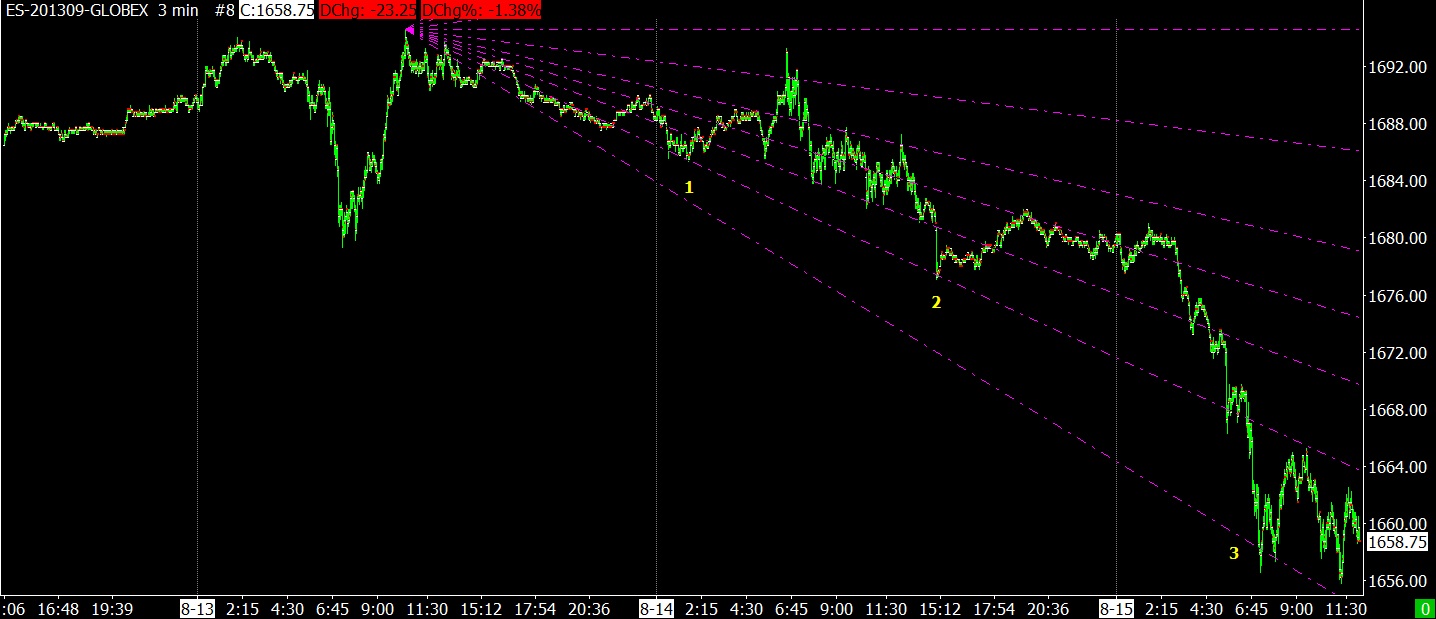
8-15-13 ES 3 MIN BAR
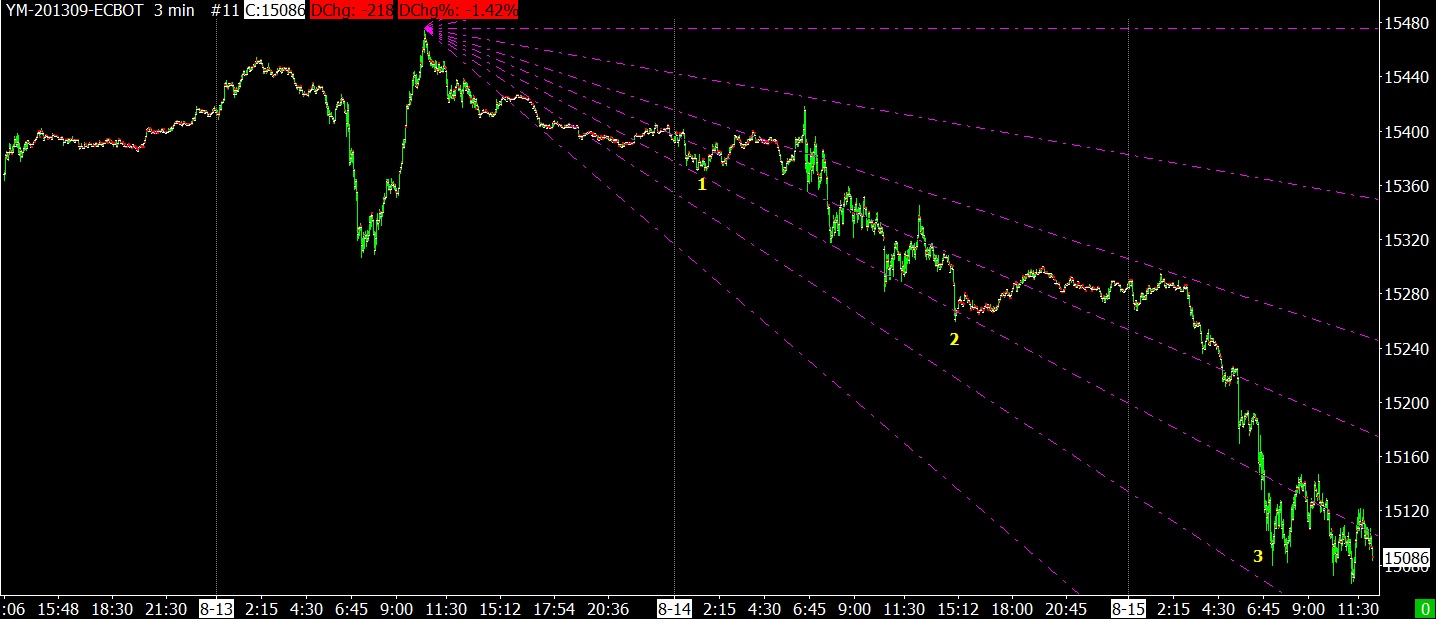
8-15-13 YM 3 MIN BAR
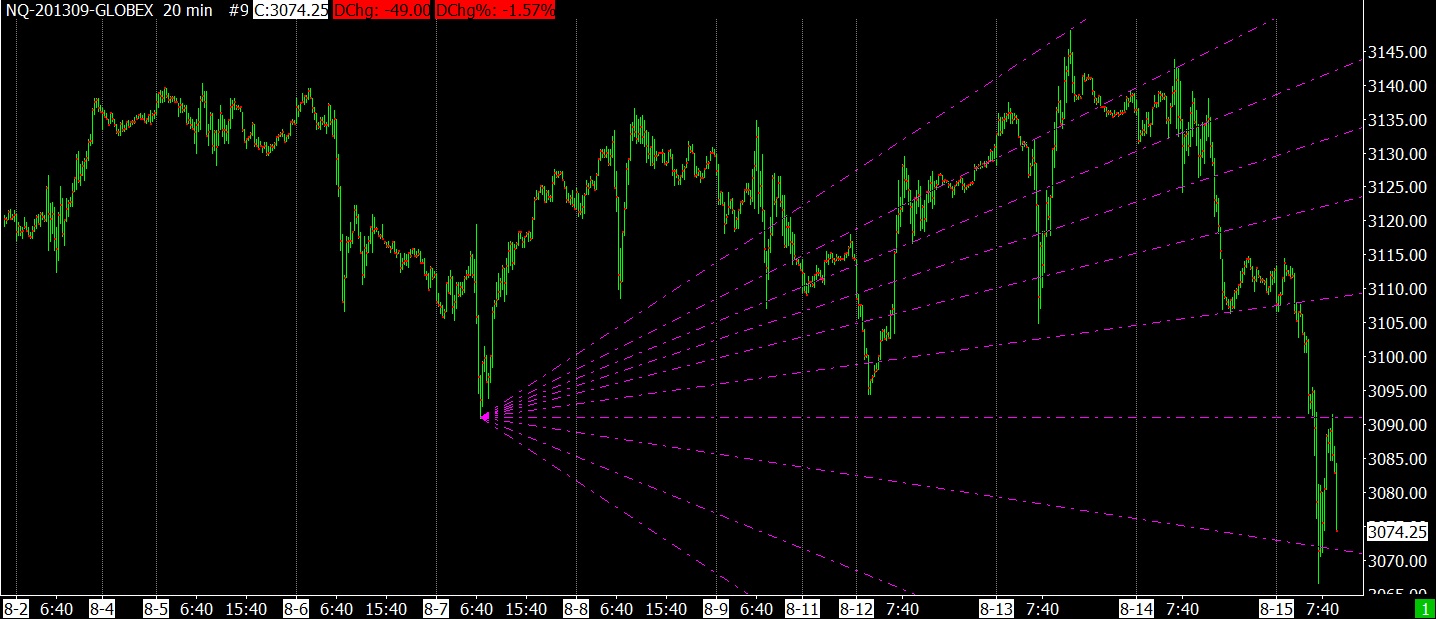
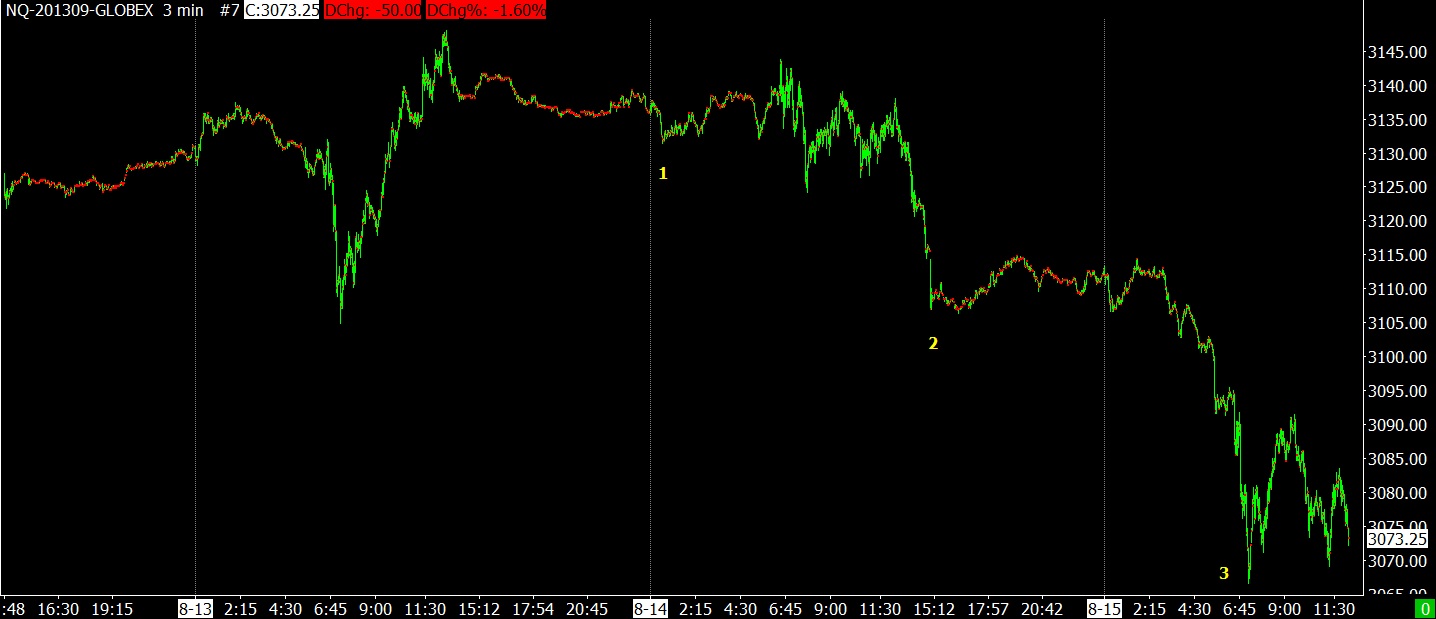 8-15-13 NQ 3MIN BAR
The decline since August 4th.

8-15-13 ES 20 MIN BAR
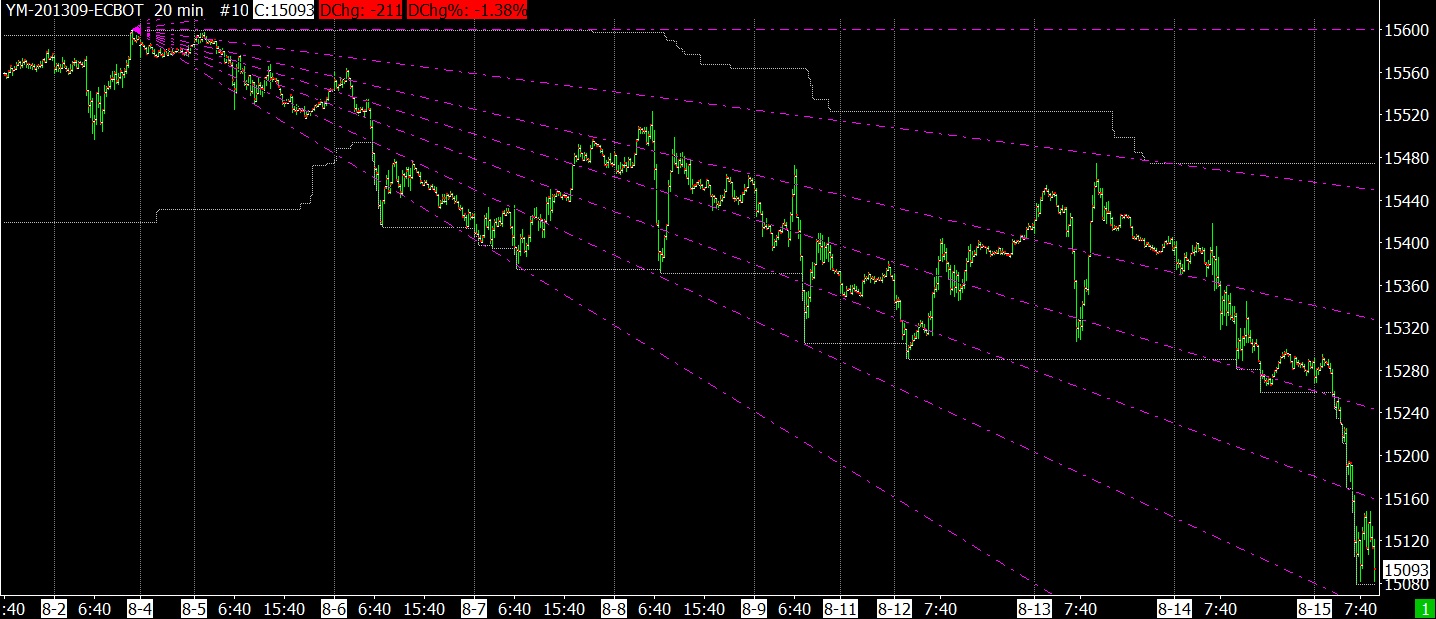
8-15-13 DJ INDUST 20 MIN BAR
8-15-13 NASDAQ 20 MIN BAR
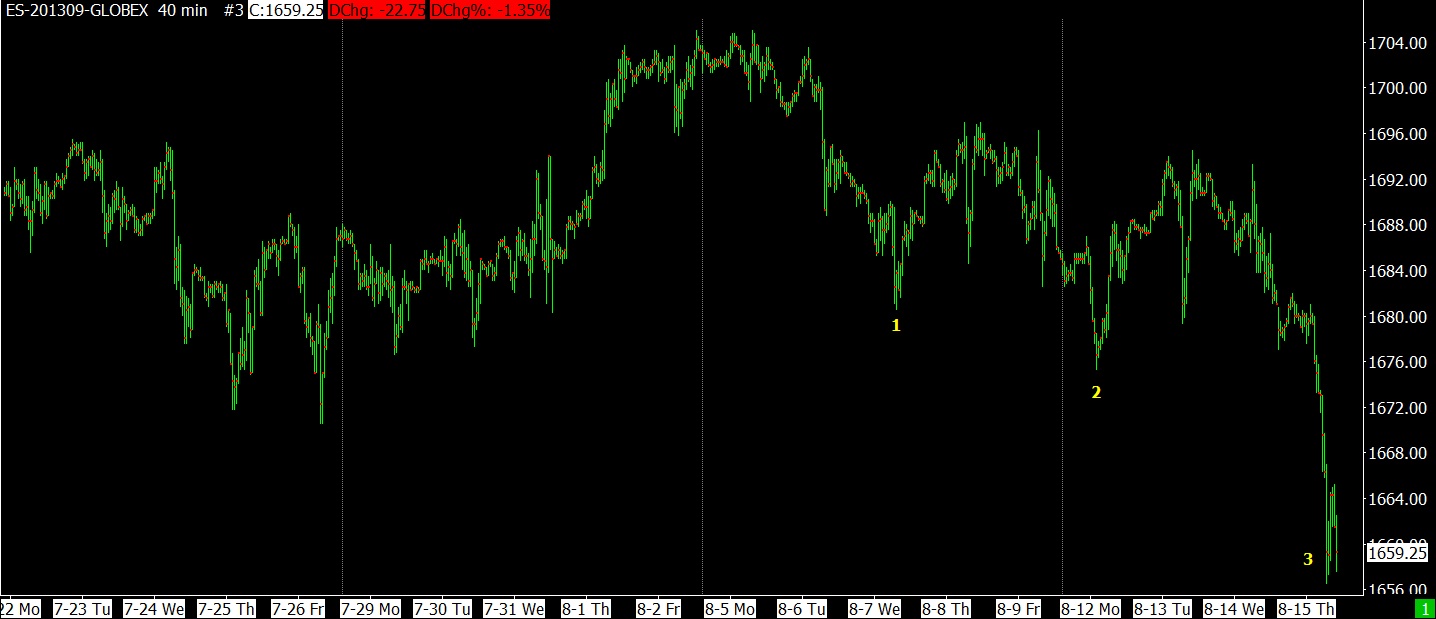
8-15-13 ES 40 MIN BAR
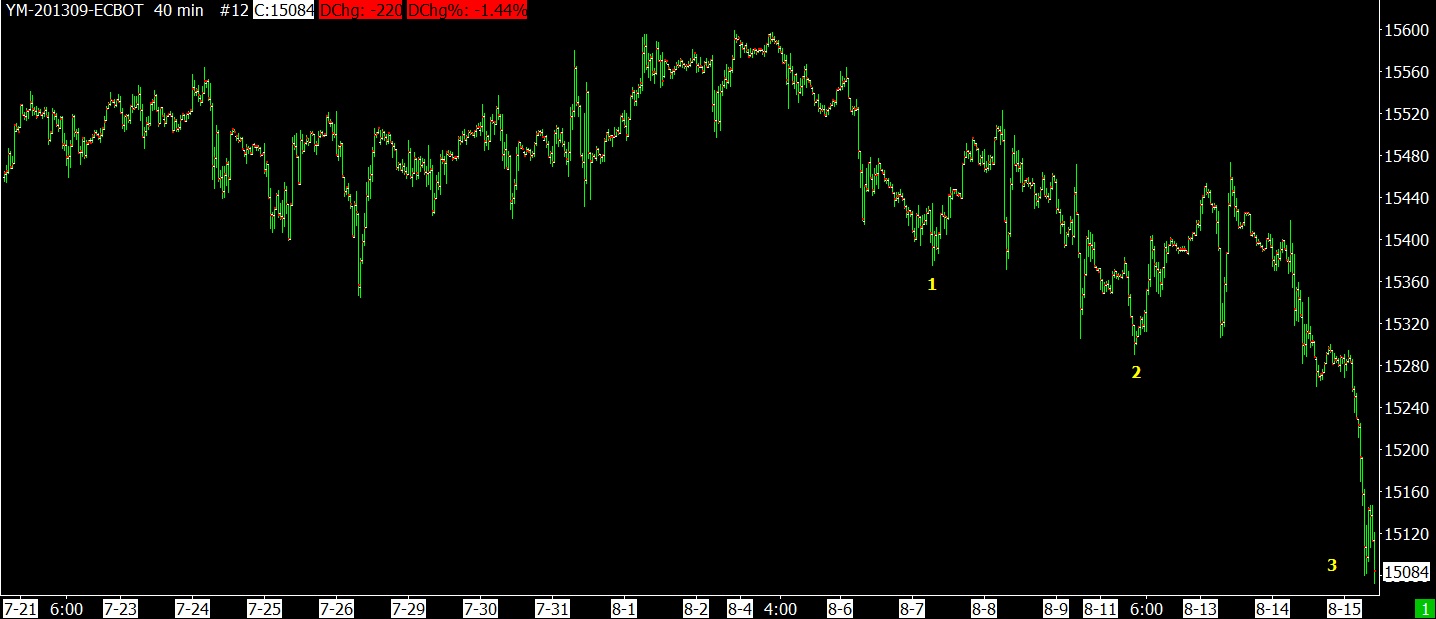
8-13-15 DJI FUTURES 40 MIN BAR
In this chart, we are waiting for another rally. That would be the 3rd rally since the decline started. Daily steps up or down usually have good reliability.
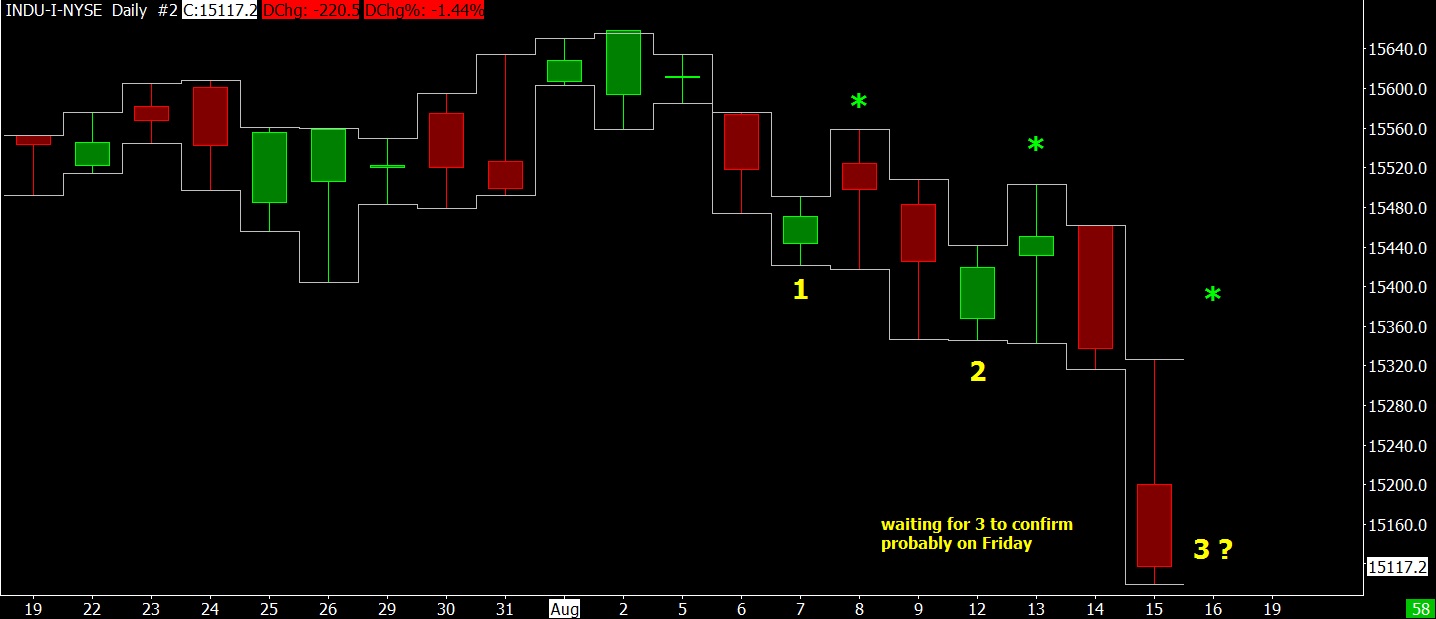
8-15-13 DJI DAILY BAR
The NASDAQ “usually” counts well and that’s what is bothersome about this chart. Most charts are showing 3 steps down and the NASDAQ says we only completed 2 steps down. There is another way of counting this, which is in sync with the others. This index had 2 rallies and 2 declines. We could count the 2 declines as step 1 and 2. These steps correspond with everyone else’s steps. The down step in this chart corresponds with everyone’s 3rd step down.
Still this is a troubling chart and we’ll have to see it later for more clarification.
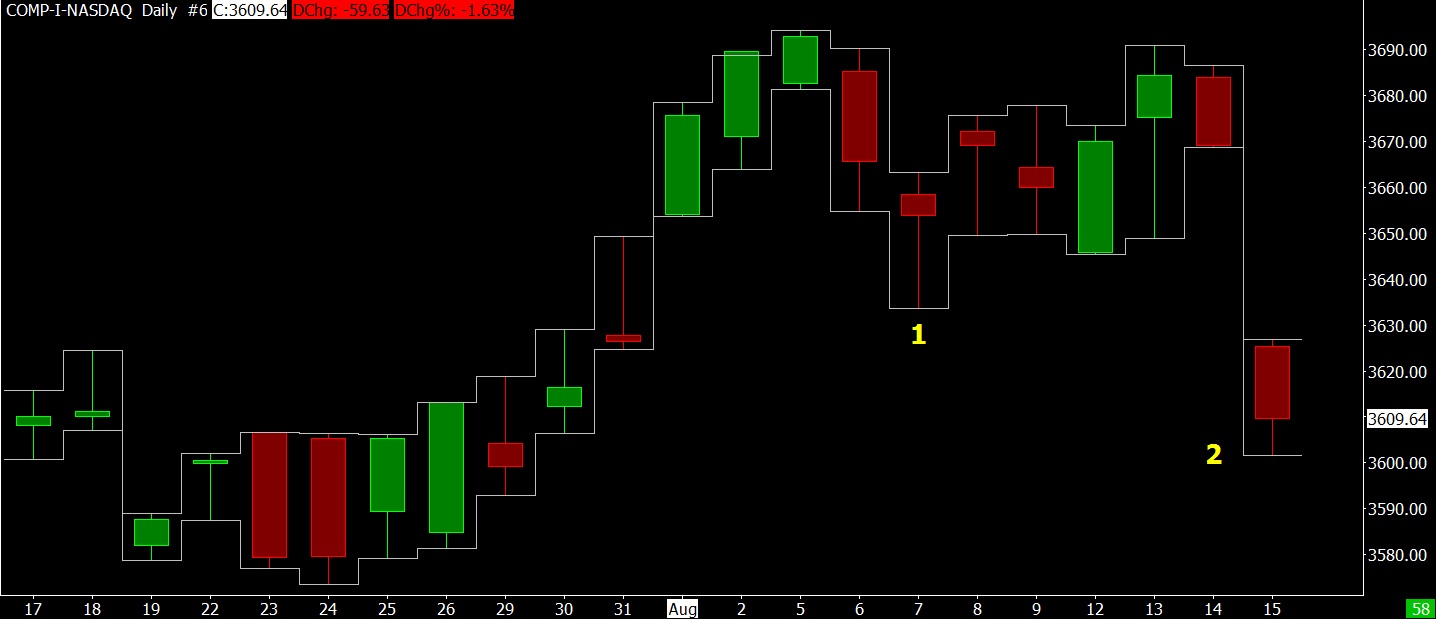
8-15-13 NASDAQ DAILY BAR
The NASDAQ has an unusual record of being leading and lagging indicator. After a significant decline, the NASDAQ can show relative strength and this is usually a good indicator of a bottom. But the NASDAQ can lag badly on peaks when the public has jumped into the market. It will be one of the last to break down because of the public influence. The best example was March 2000, where the DJ Industirals broke down in January and the NASDAQ kept going up until March. It did it again in 2007 where the NASDAQ didn’t peak until 2 weeks after the DJ Industrials and SPX. Any time the public gets involved, they like the NASDAQ (low price stocks with high volatility – gamblers dream) and they will push it longer than prudent.
Hopefully I’m not comparing this peak to 2000 or 2007. It’s just an example of the NASDAQ becoming a lagging indicator on occasion and we all know the public is here. The public always makes me feel uncomfortable, but they aren’t wrong all the time, just some of the time. They get to make money for awhile before things go bad on them. If they always lost money, they would NEVER come back. They get to have some memories that are good, but the GREED factor is always an alluring aroma for the pocketbook of the public. With the market racing to all-time highs recently, the public can’t pass that easy money up. They gotta climb on for a ride.
Here are some Fibonacci fans.
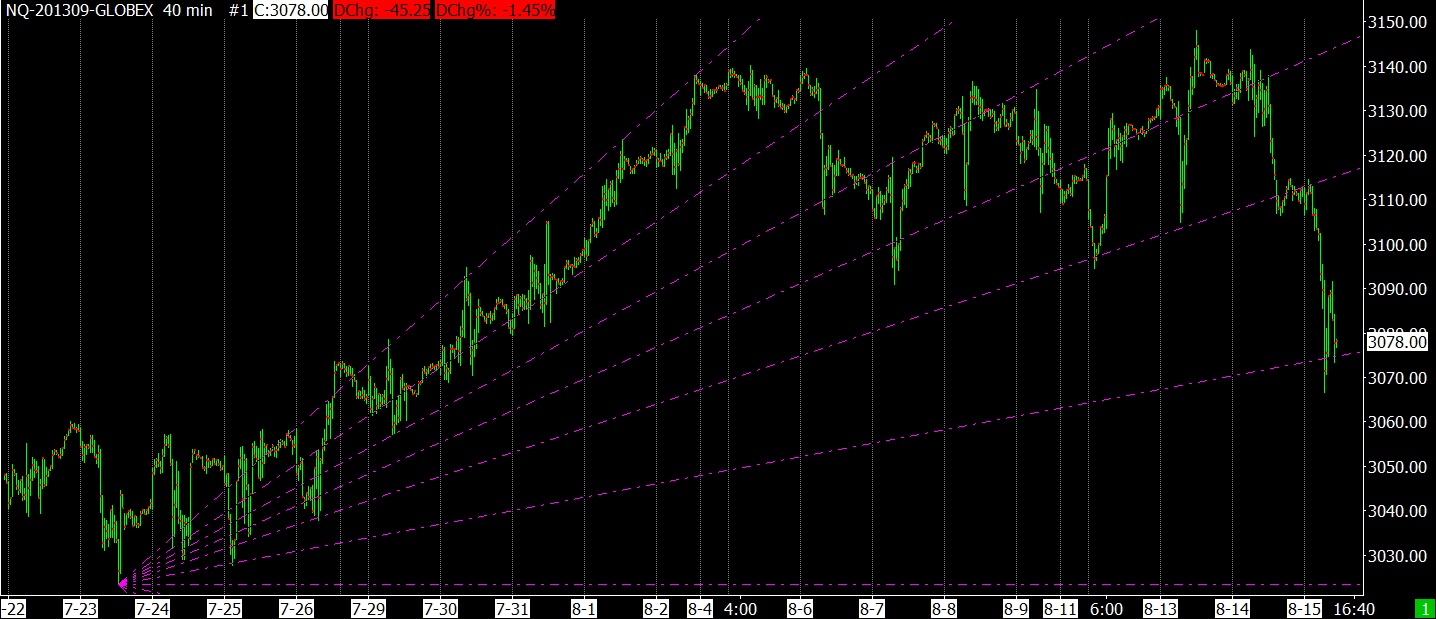
8-15-13 NASDAQ 40 MIN BAR
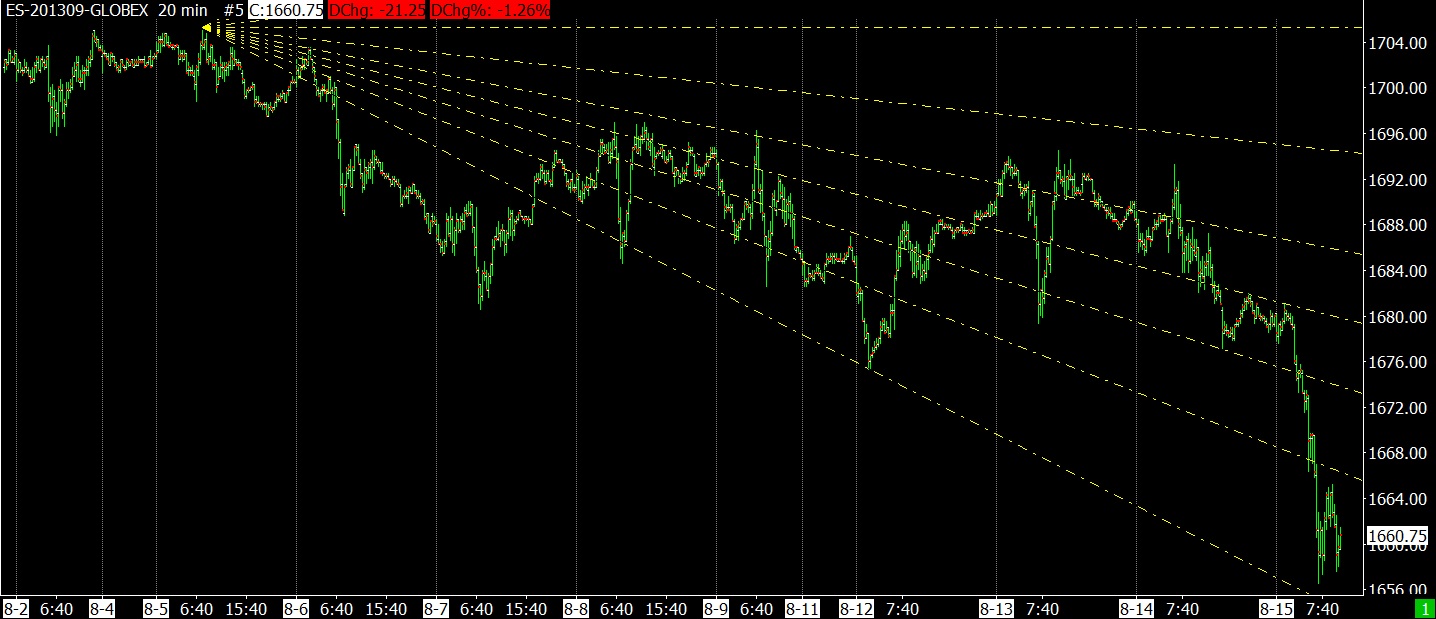
8-15-13 ES 20 MIN BAR
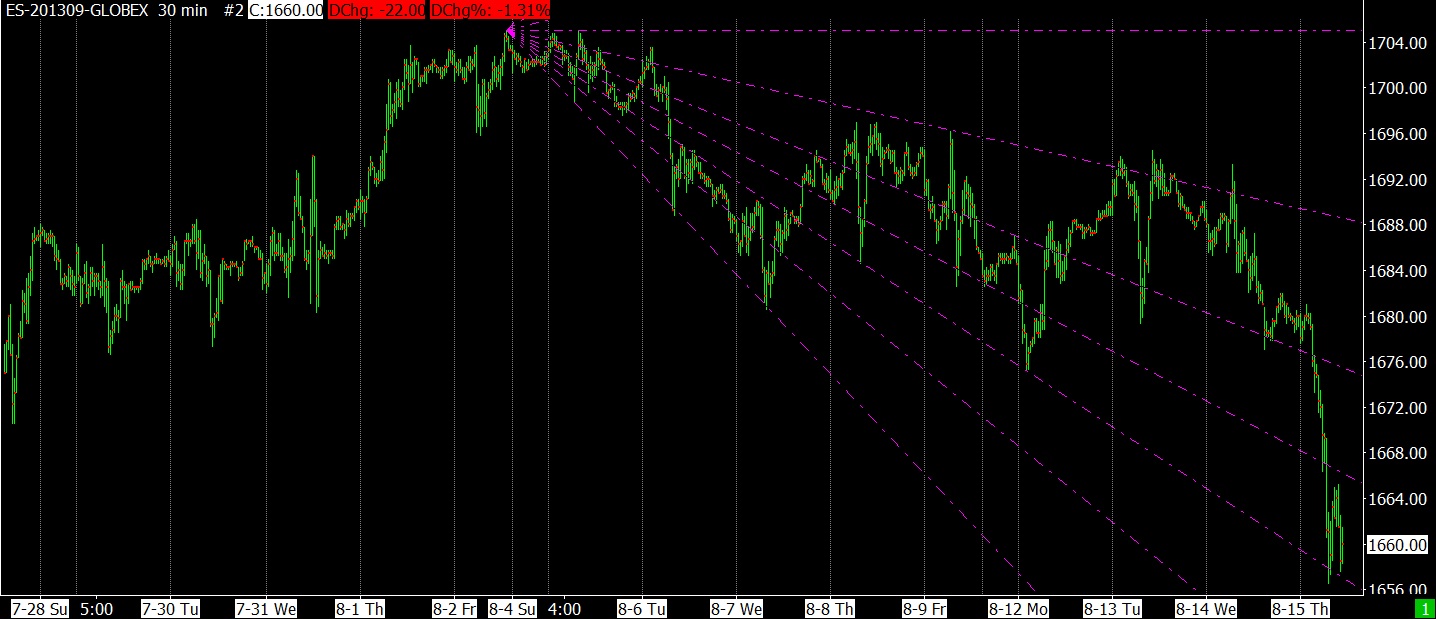
8-15-13 ES 30 MIN BAR
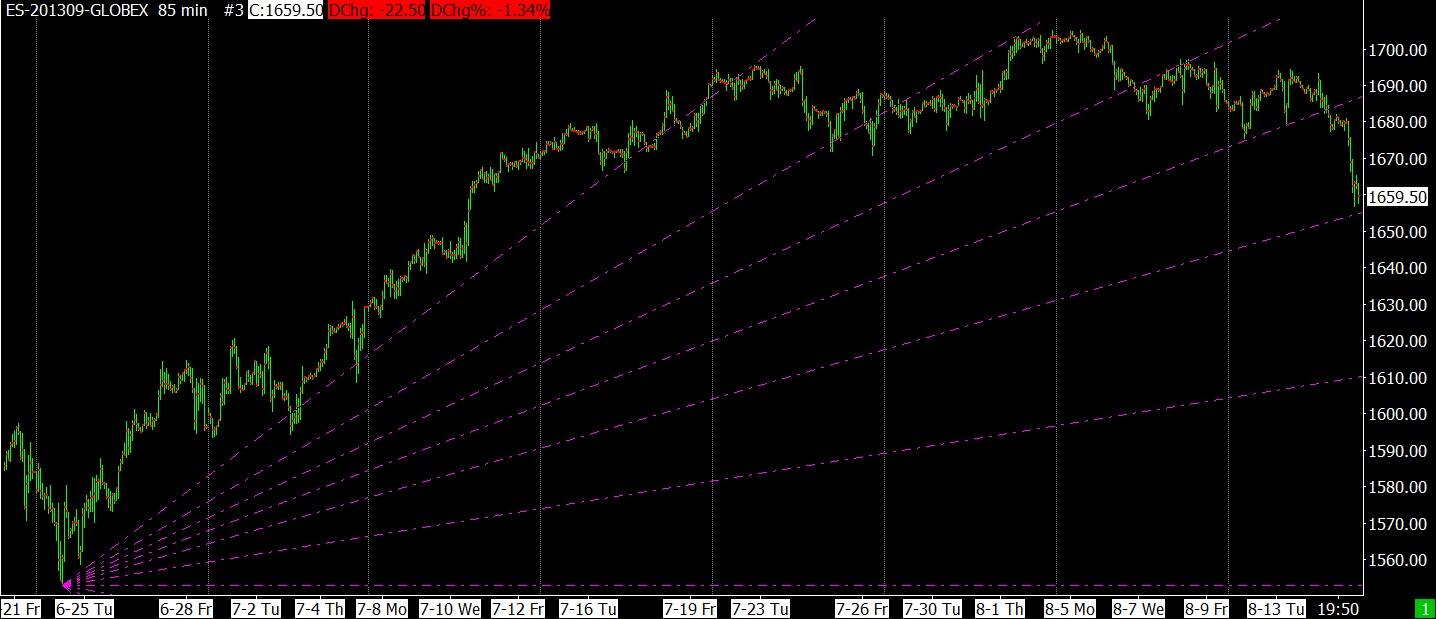
8-15-13 ES 85 MIN BAR
Higher volume than normal today.
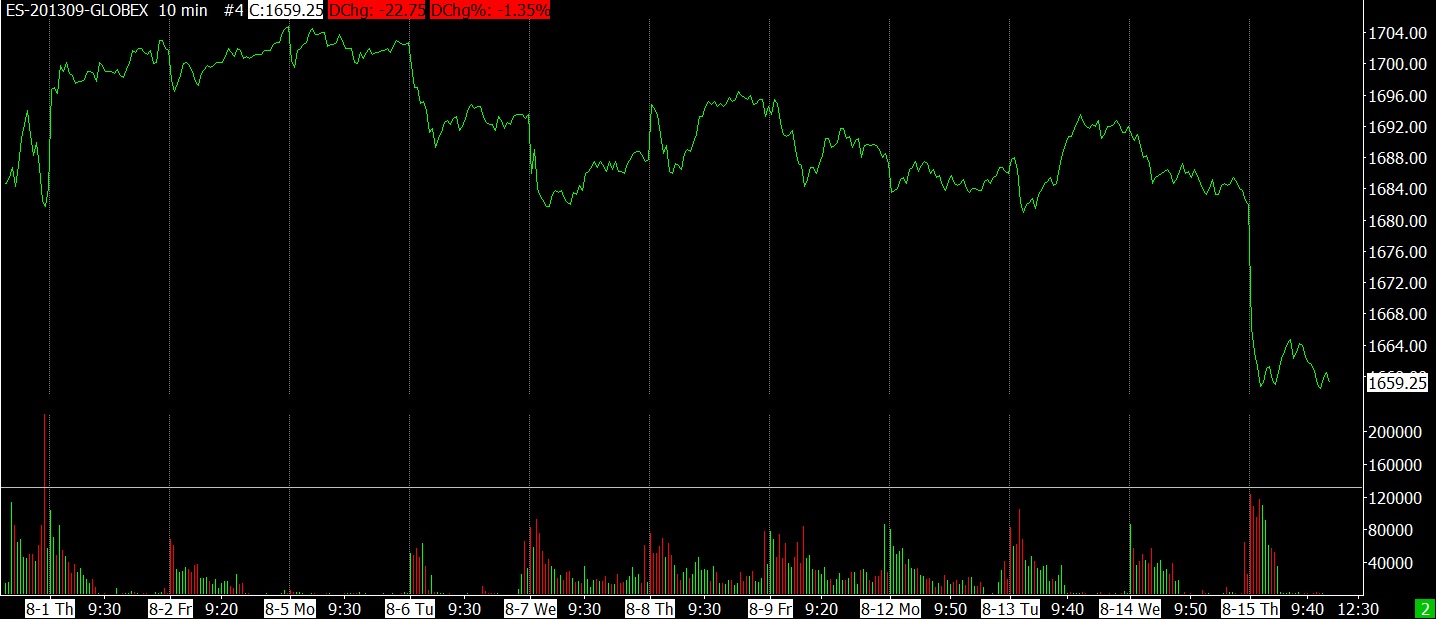
8-15-13 ES 10 MIN
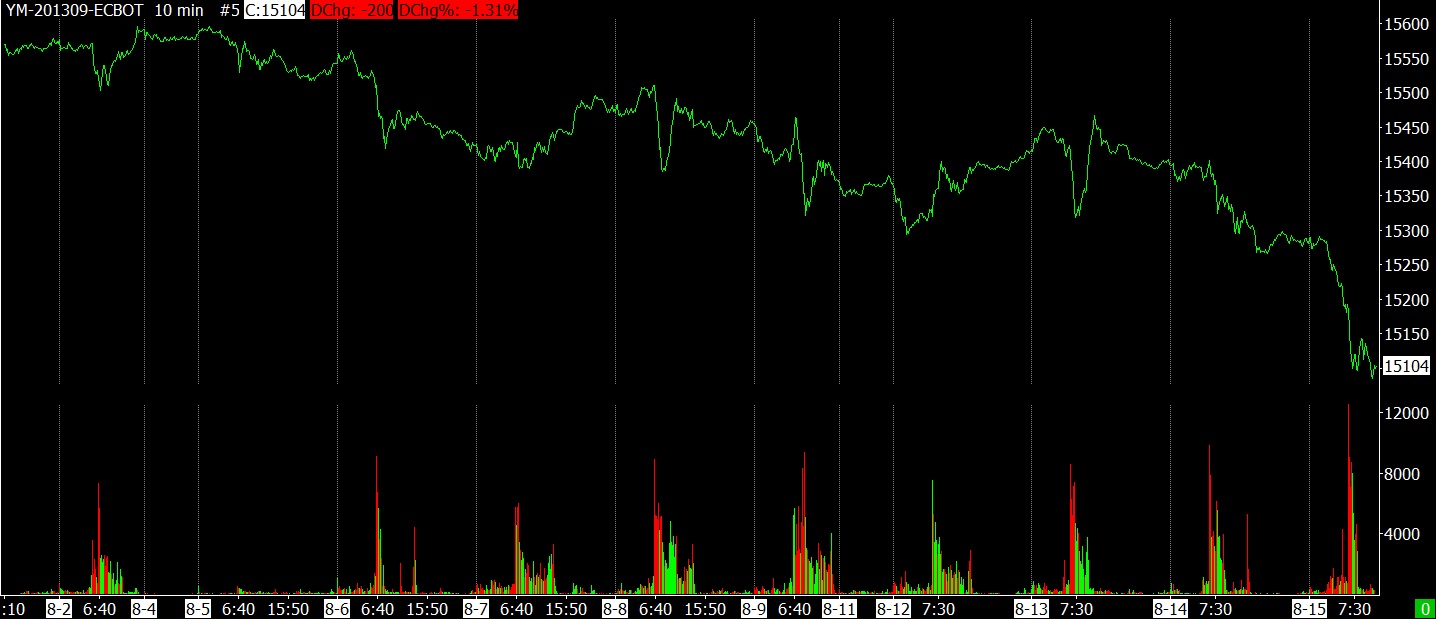 8-15-13 YM 10 MIN
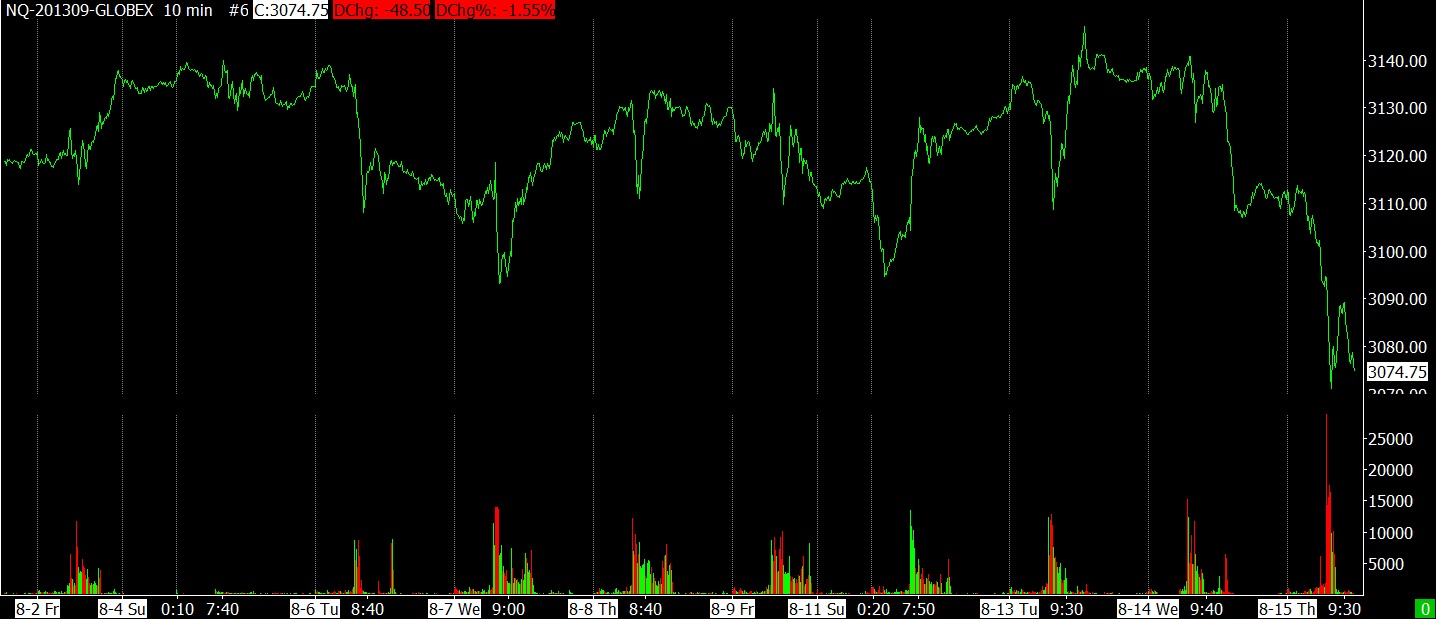
8-15-13 NQ 10 MIN
The ADX is primed for a rally.
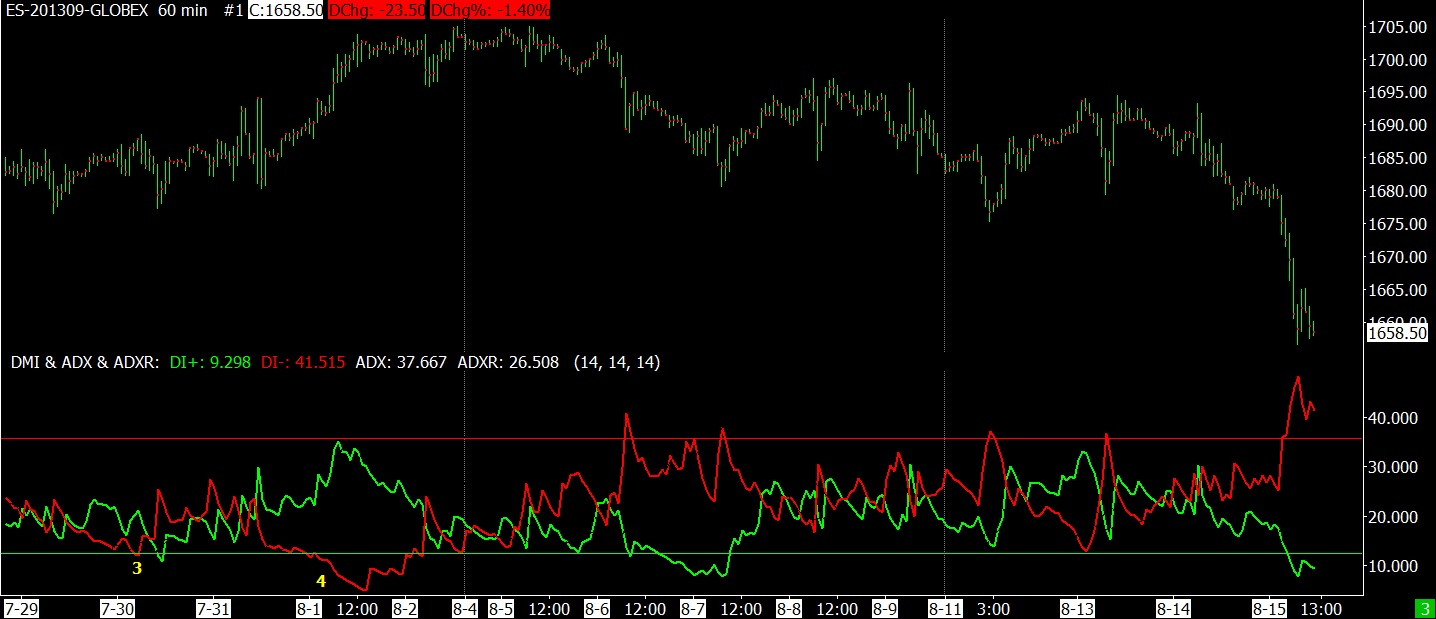 8-15-13 ADX 60 MIN BAR
The Dow Theory gave a minimal warning of a downtrend with lower lows in both the DJI and DJT.
Here the DJI violated a recent low.
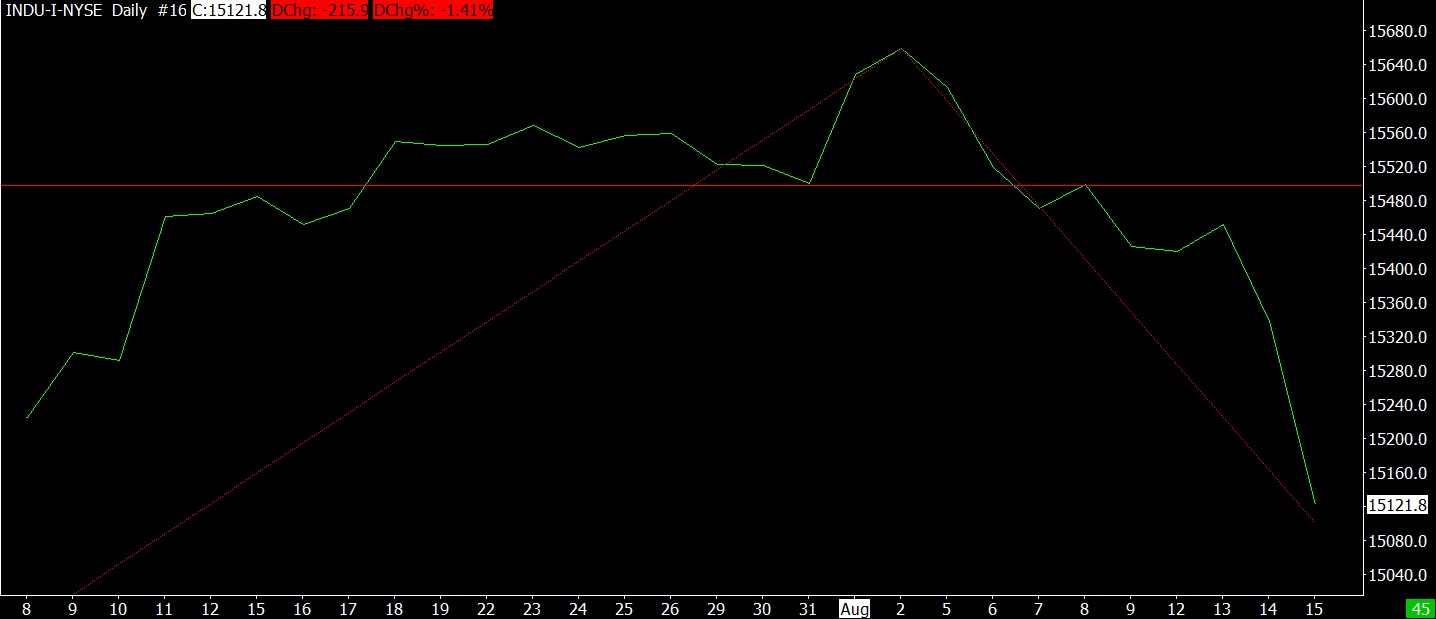
8-15-13 DJI DAILY BAR
In this chart the DJT violated a prior low too. These are minor bottoms and I consider this to be a minor violation. We’ll have to see how things do later whether we start violating more important lows.
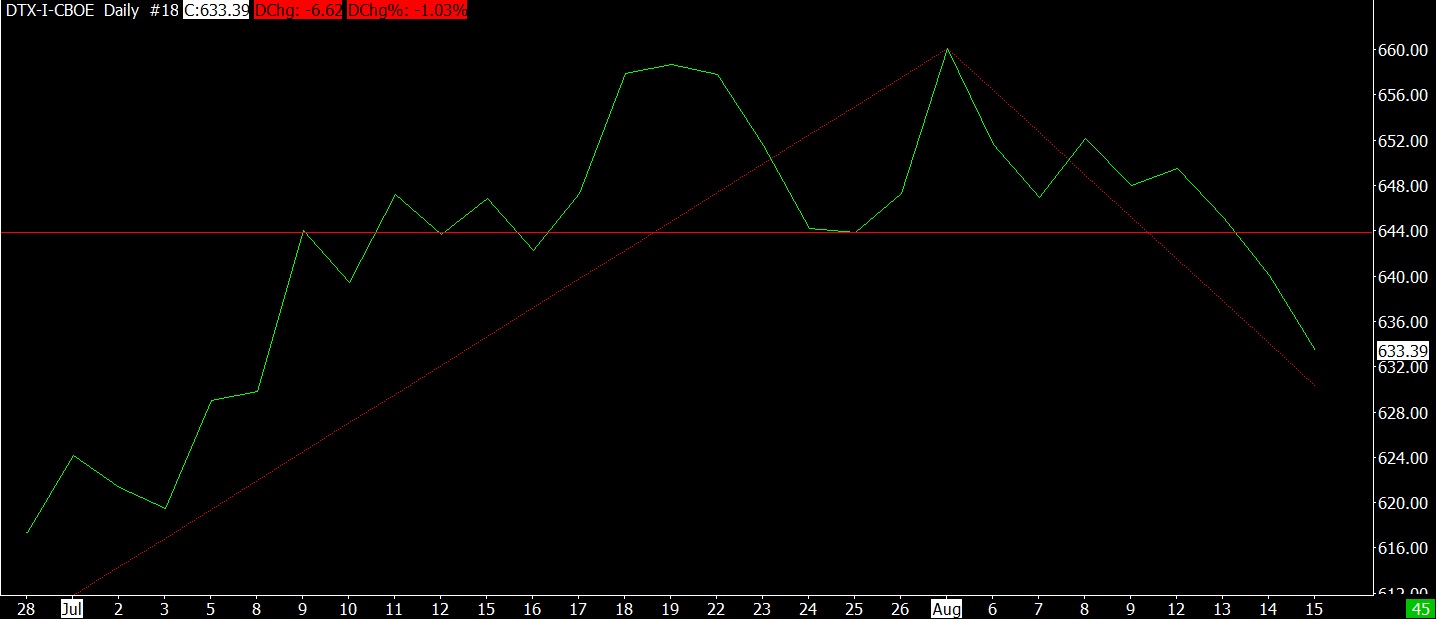
8-15-13 DJT DAILY BAR
The following is the oscillators showing that the market is oversold.
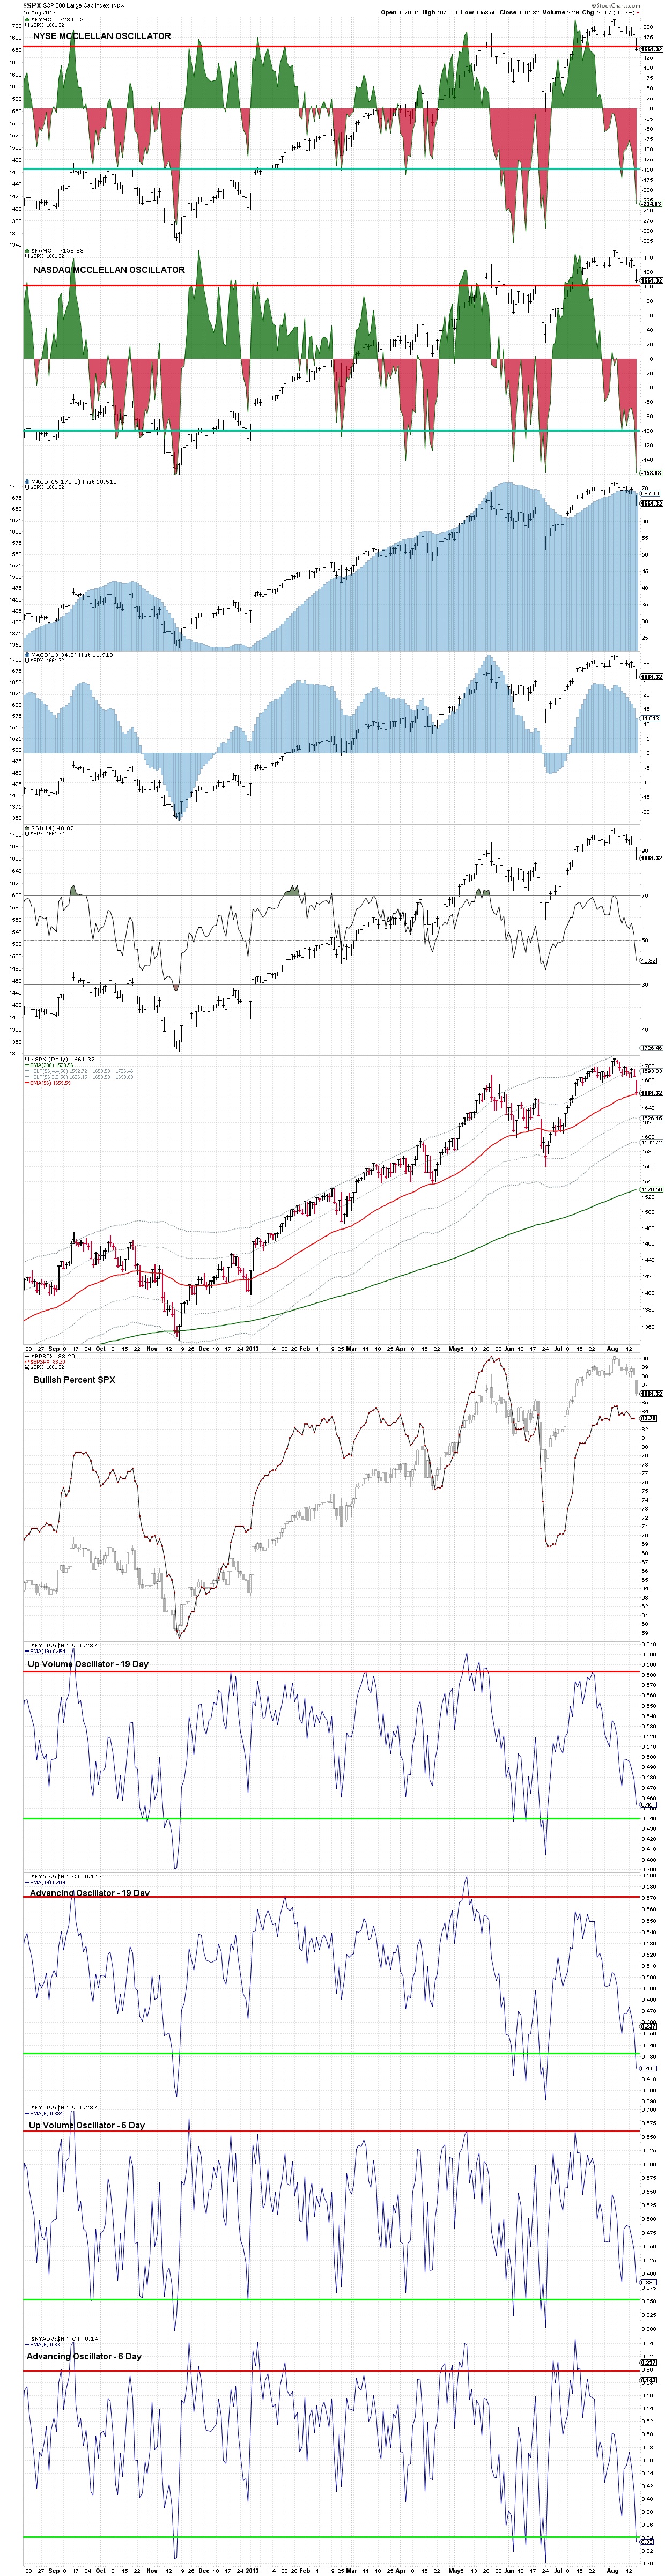
- 8-15-13 OSCILLATORS
This doesn’t have anything to do with the general market, but notice that Apple retraced 50% of its gain since 2009.
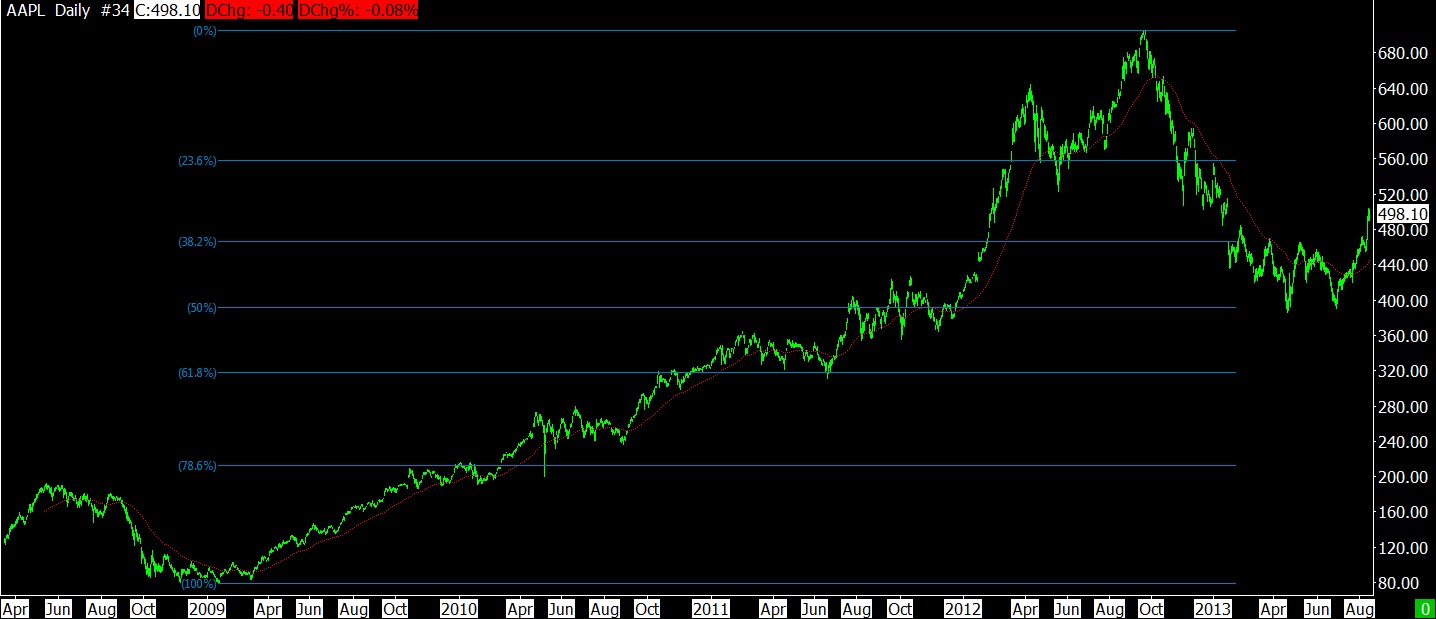
8-15-13 APPLE DAILY BAR
The count to the recent bottom in Apple ended with a 5 count. The only remaining question; Is that the end of a larger step down???? If not, Apple is free to roam and possibly go back to its old highs (or higher).
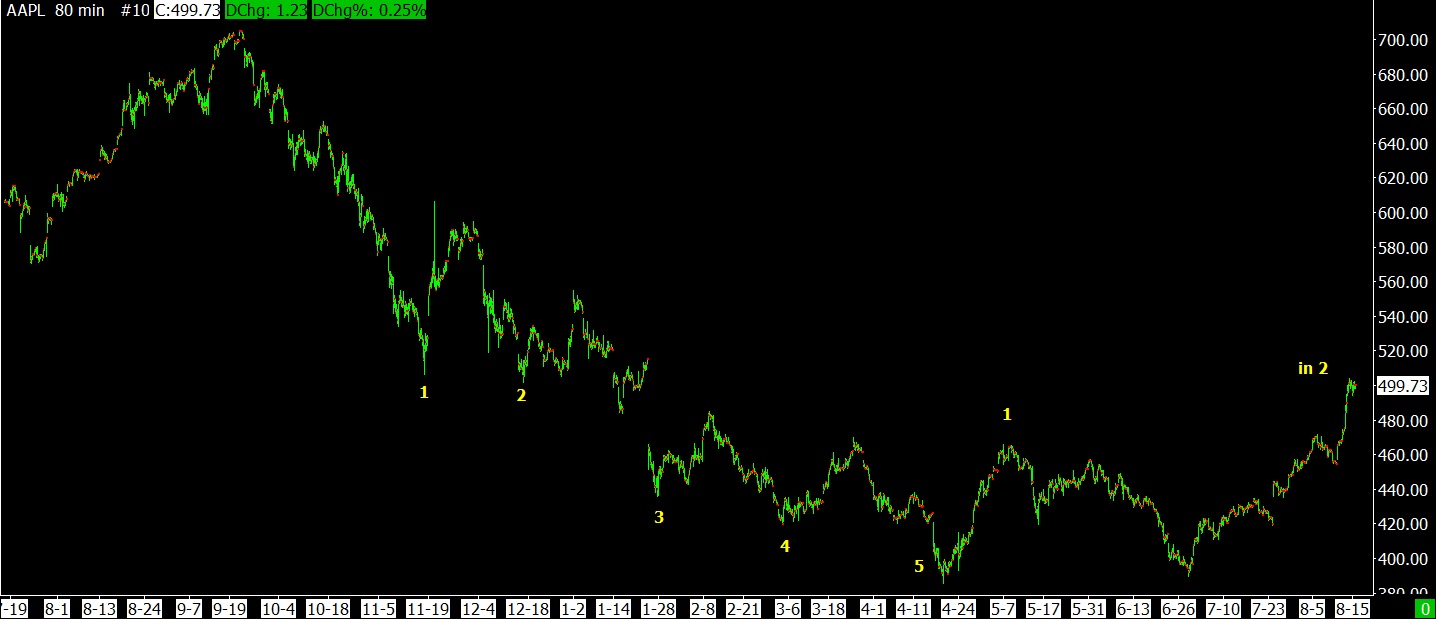
8-15-13 APPLE 80 MIN BAR
——————————————————————————————————
- Click on any picture or chart to enlarge it
- A chart denoted as “ES” is a SP 500 futures chart. YM is DJ Industrial futures, NQ is NASDAQ Composite futures.
Leave me a comment or question just a few inches below here. If it says “Comment”, click on the comment and you’ll see “Leave A Reply”.
All Rights Reserved © ™

Leave A Reply