Jeff Saut & Some Crazy Ideas
 8/11/13 . . .
to help you understand my unorthodox wave counting method.
MY FACEBOOK PAGE – Leave a comment
—————————————————
Well this turned out to be a LOT longer blog update than I anticipated. I just started babbling along and couldn’t stop.
Two of the following charts show a completed 3 step rally since June 24th, while 2 charts show a 2 step rally. Kinda ambiguous, huh??? Nevertheless, the first two charts are the ones that made me go short last Sunday (8/4/13).
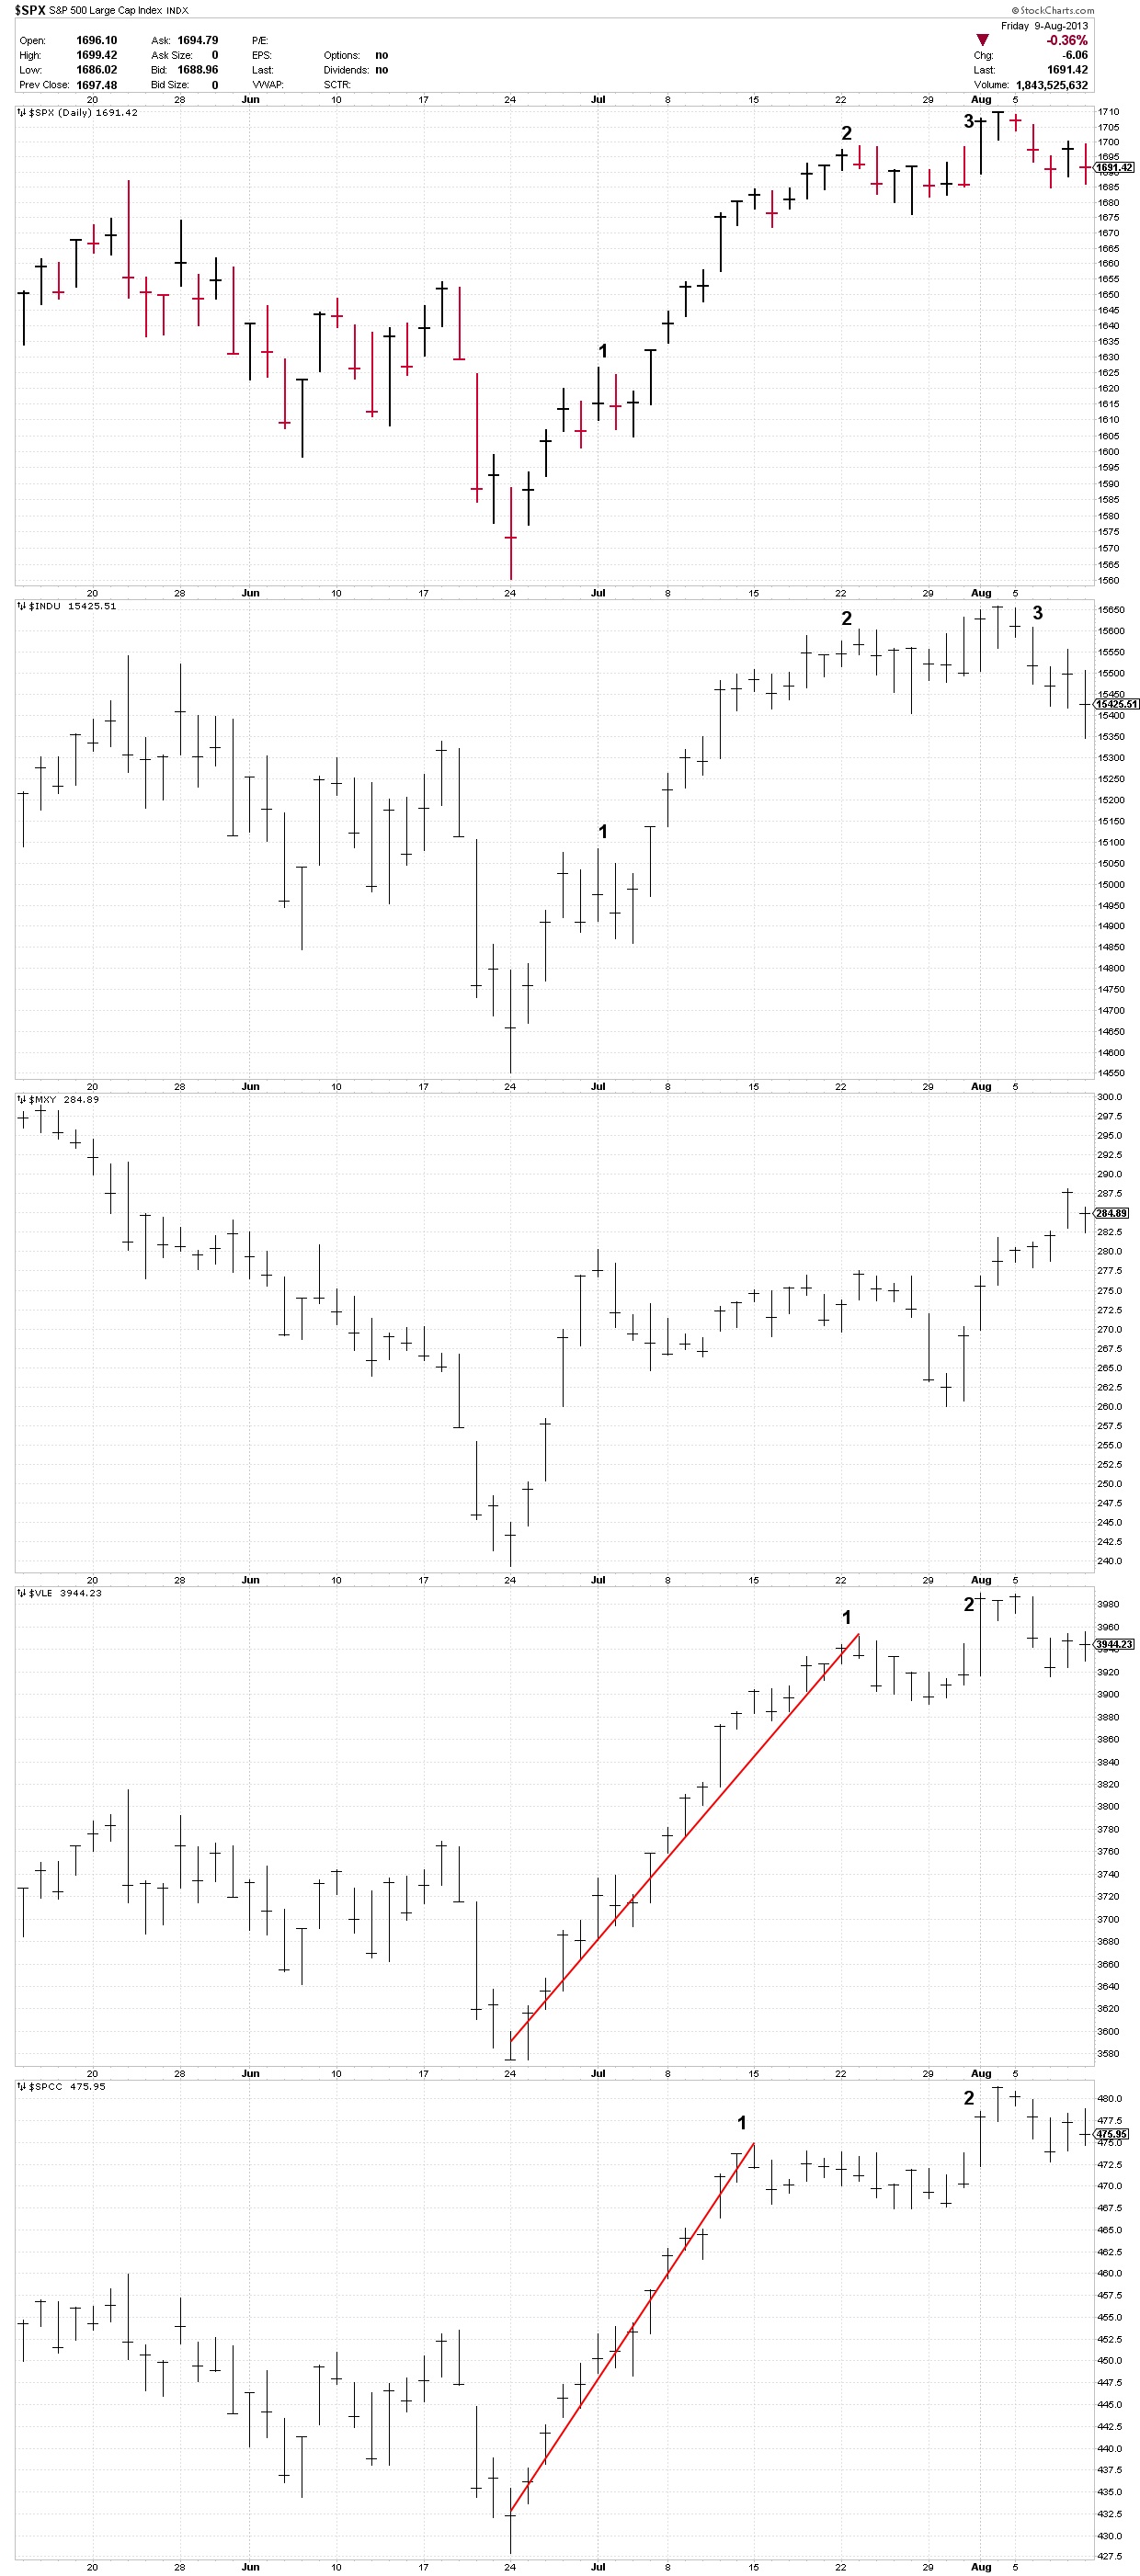
8-11-13 INDEXES DAILY
Rally, what rally??? I expected a rally to take place, but all we’ve had so far is a lateral rally (at best).
Next week is not a strong week historically, but that doesn’t mean we can’t rally. The odds are just against it taking place.
If you haven’t been keeping track, I’ve been a bit of a bear recently. But I already covered my Sunday short (August 4th) and then shorted again at higher levels. Presently I’ve got close stops in case we have a decent rally.
Why should we rally???
Some of the indexes have a nice looking completed wave count on the downside and others look like only 2 steps down. One of my 3s looks like it’s placed at an incomplete downtrend. Nevertheless, if the decline is complete a rally should take place. So it’s possible that more rally could still be in the fray (or not right away).
But remember . . . when things turn bearish, the market finds lotsa ways to go down.
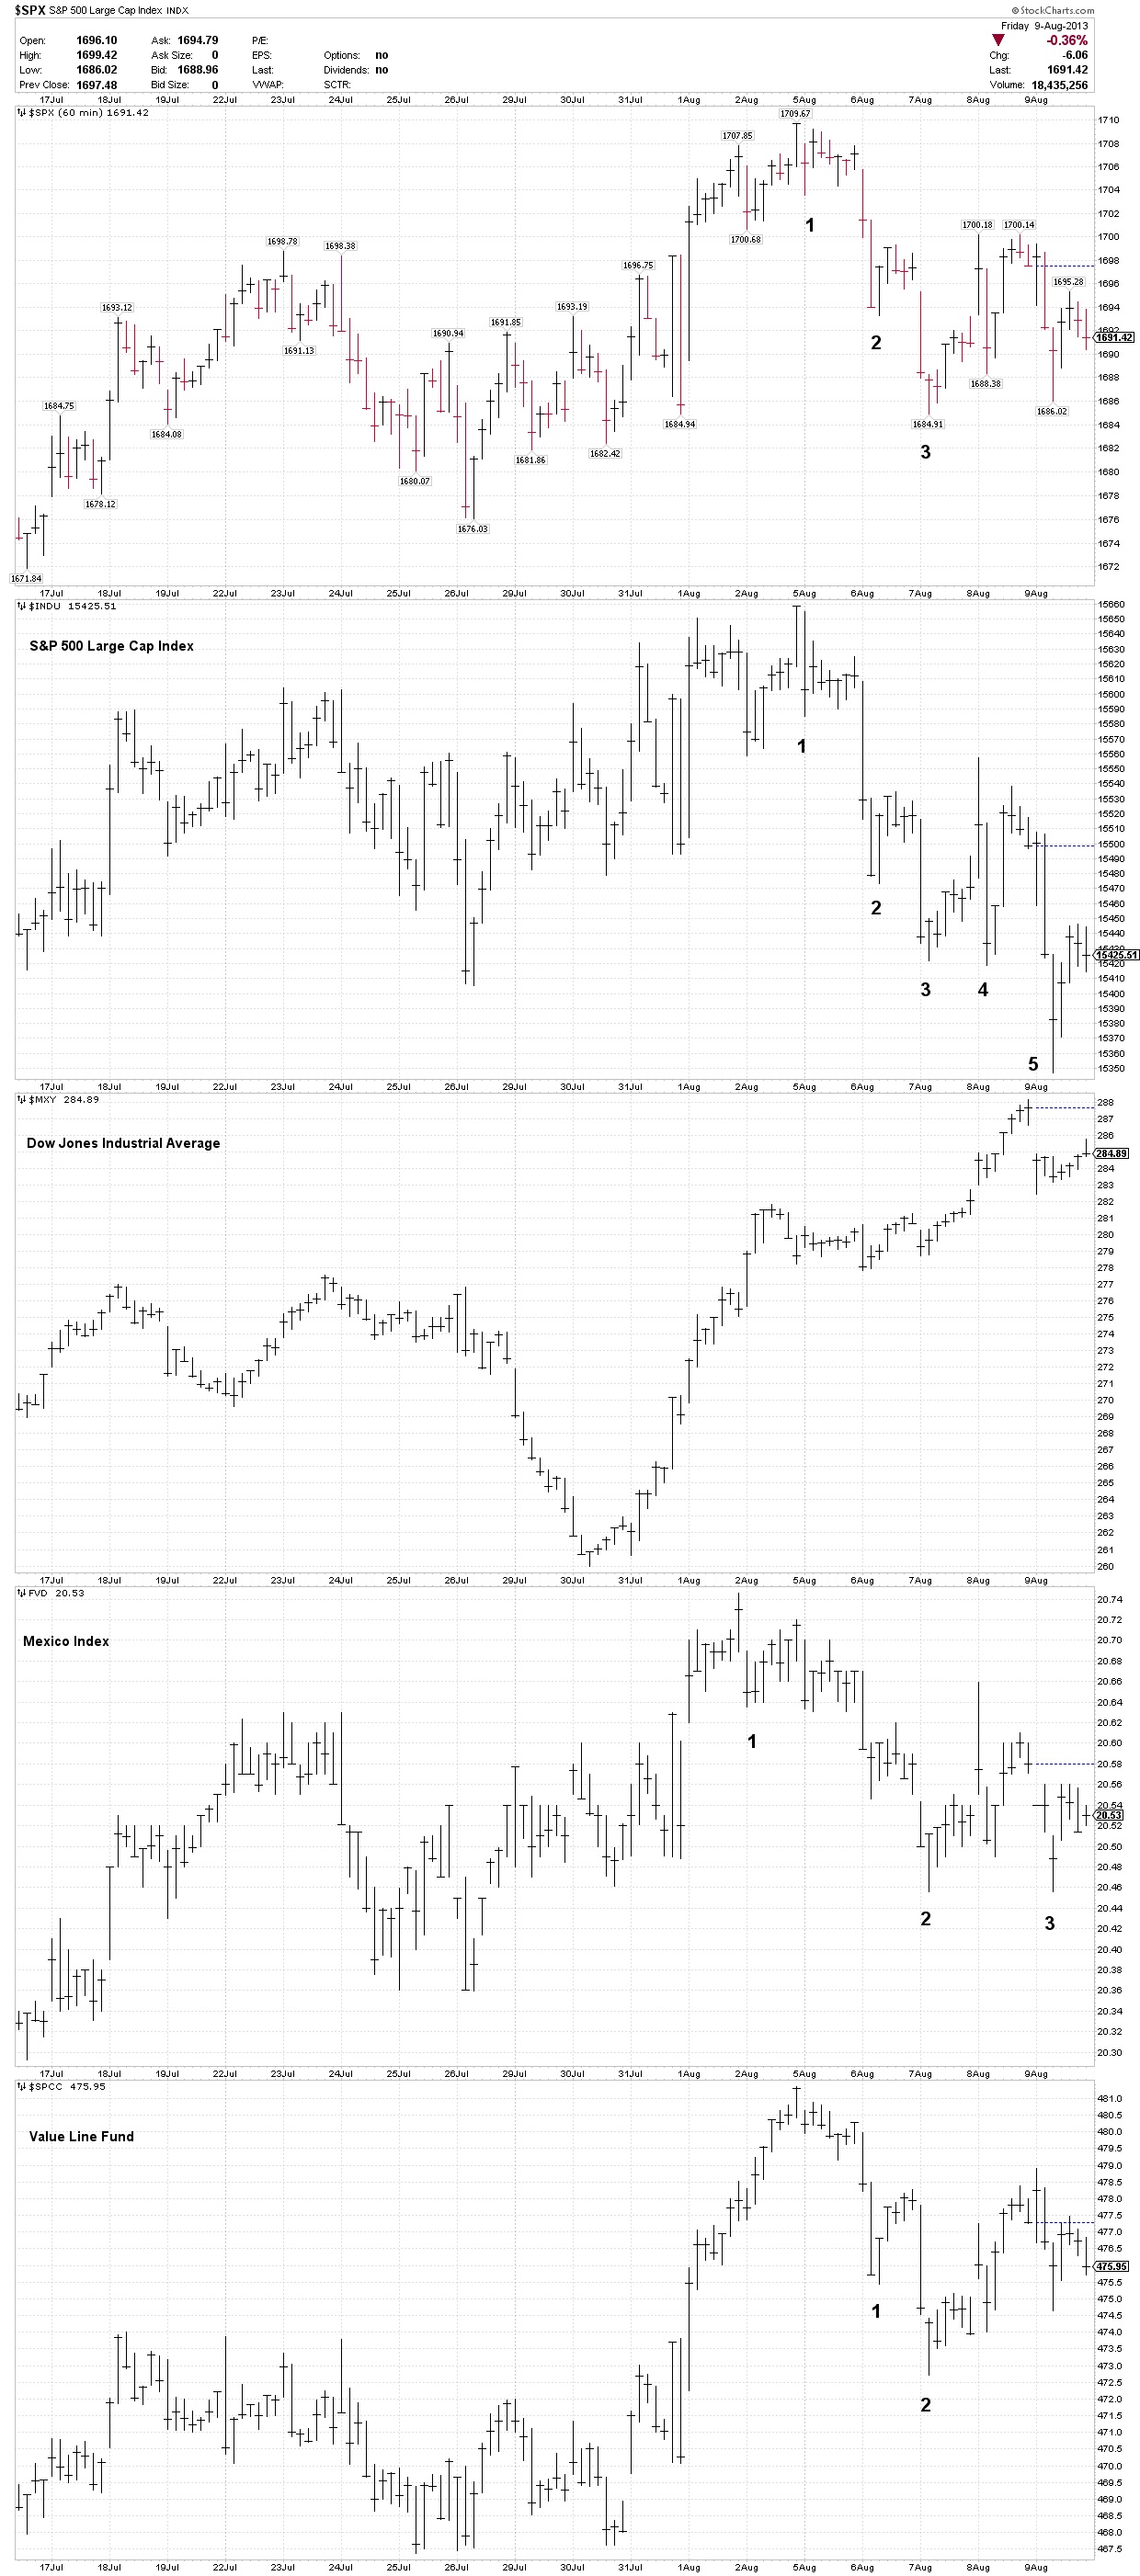
8-11-13 INDEXES HOURLY
Presently I need more downside action before I’m going to turn into a rip-snortin’ growlin’ bear. For now, I’m just a mini-bear who thinks he is going to grow into a bigger bear one of these days.
SCARY STORY
FIRST, step 3 must end before any of the following can be true and IT HASN’T ENDED. I am anticipating the end of 3, but it isn’t broken yet. So don’t get excited and get ahead of the market until step 3 is broken.
I used to think I would become a super-bear when we reached the end of step 3, counting from March 2009.
Look at the first chart above for a closer look at the current step up. I’m watching carefully for signs of a channel break for a definitive warning that the larger step 3 is finished. If the cycle warning is correct from a week ago, that should easily serve as the channel break.
Daily indexes showing large step 3 since October 2011.
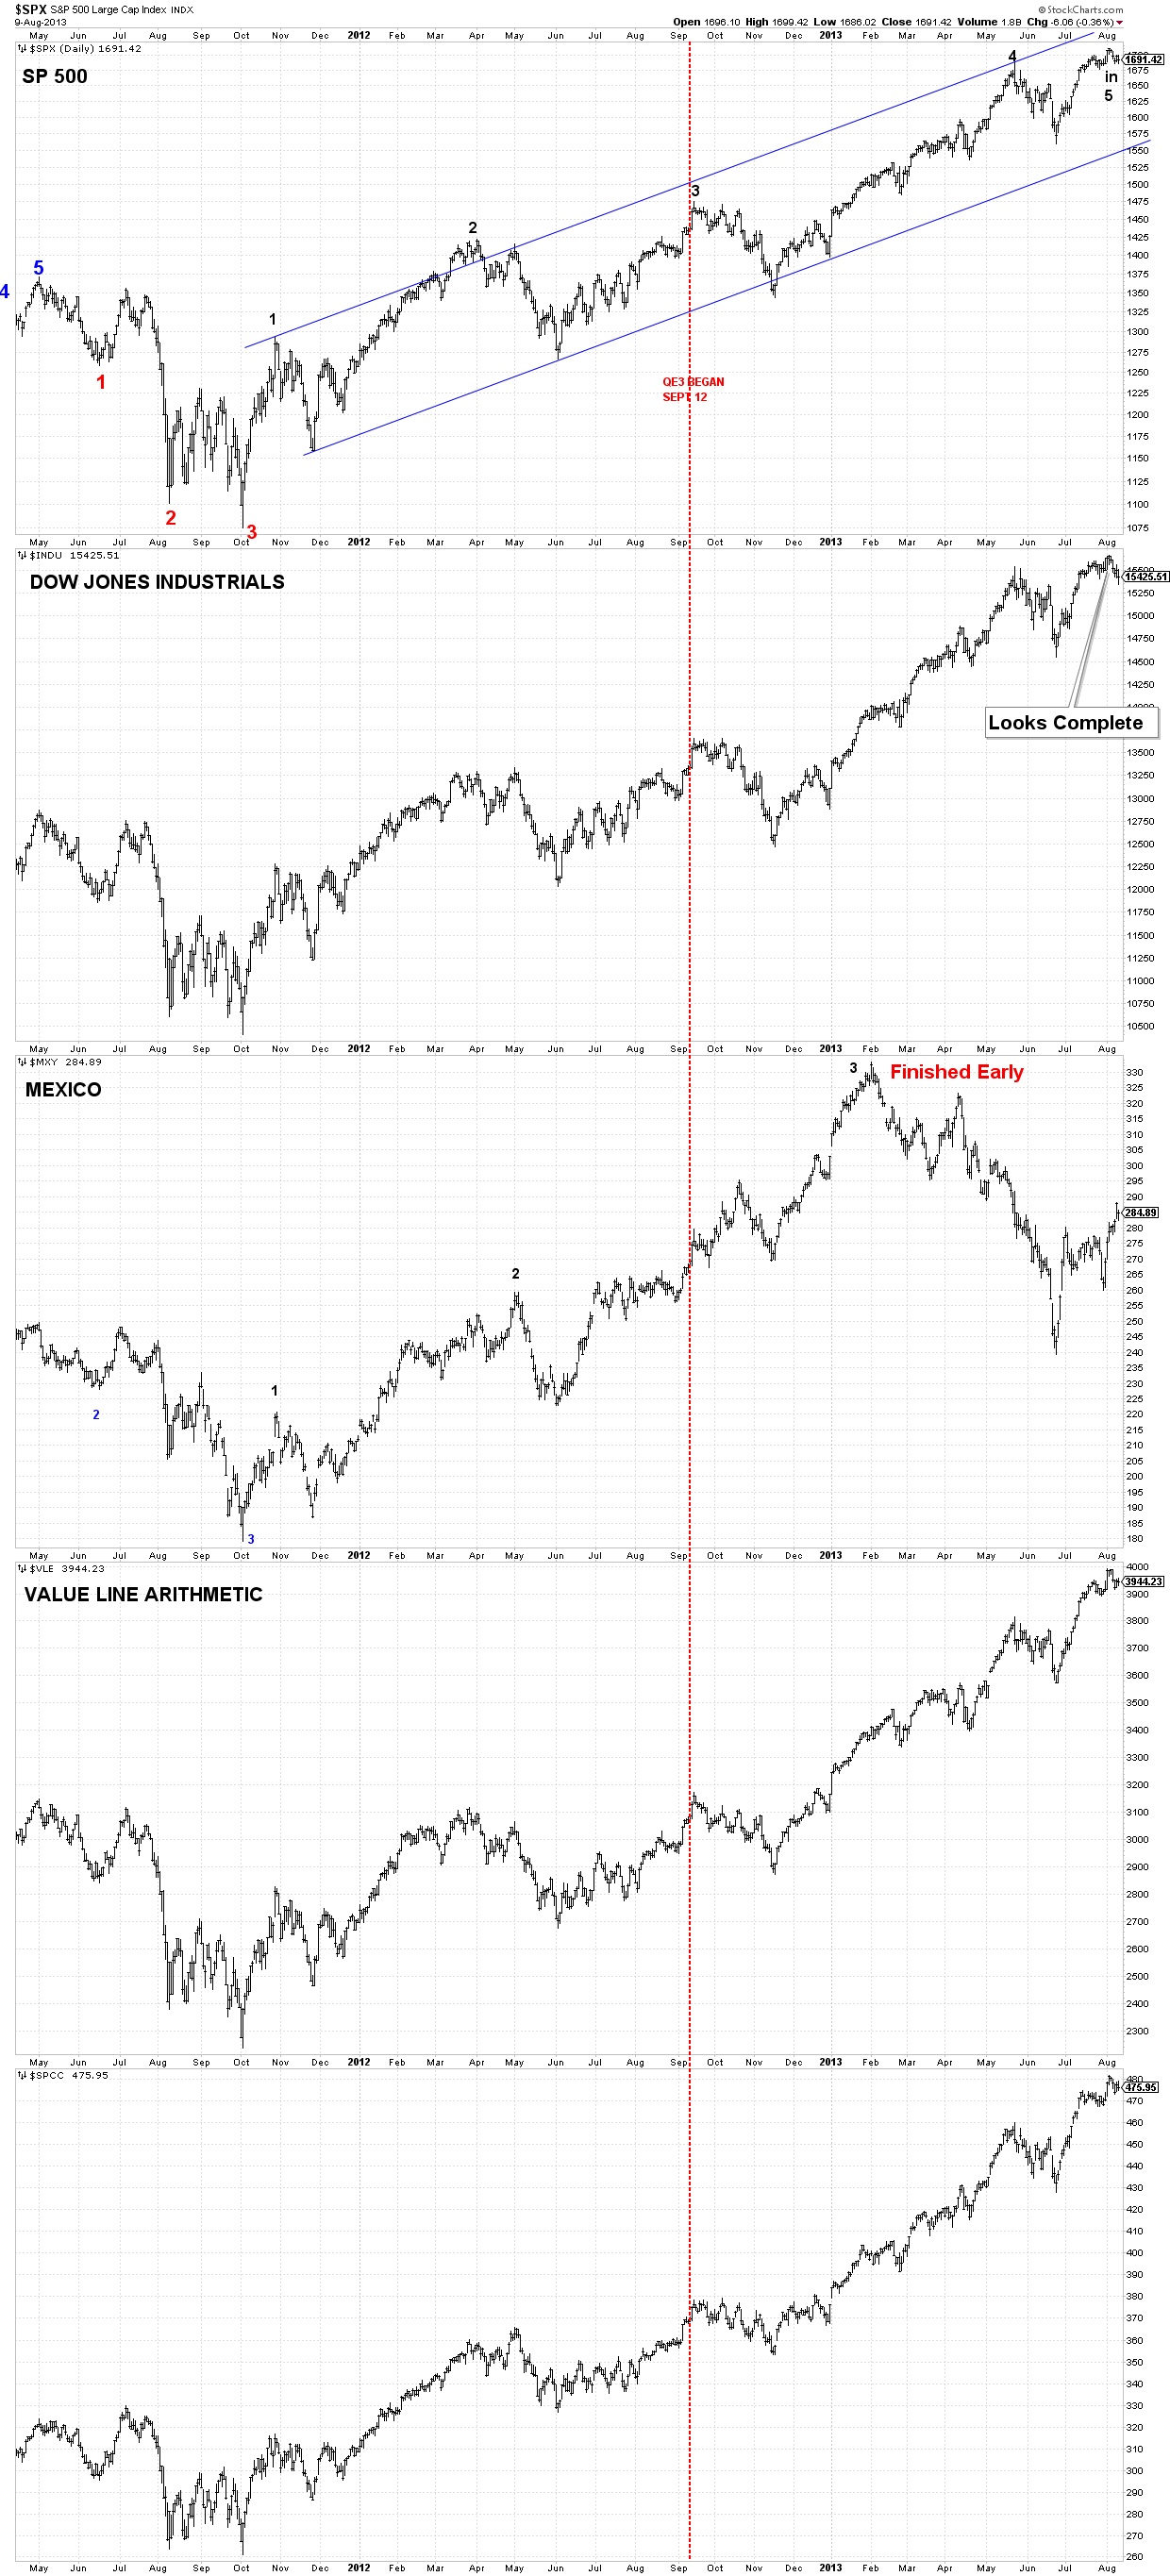
8-11-13 INDEXES DAILY
Weekly indexes showing 3 steps since March 2009 (plus some other stuff from the past). What does that green IV and V mean??? See the next chart.
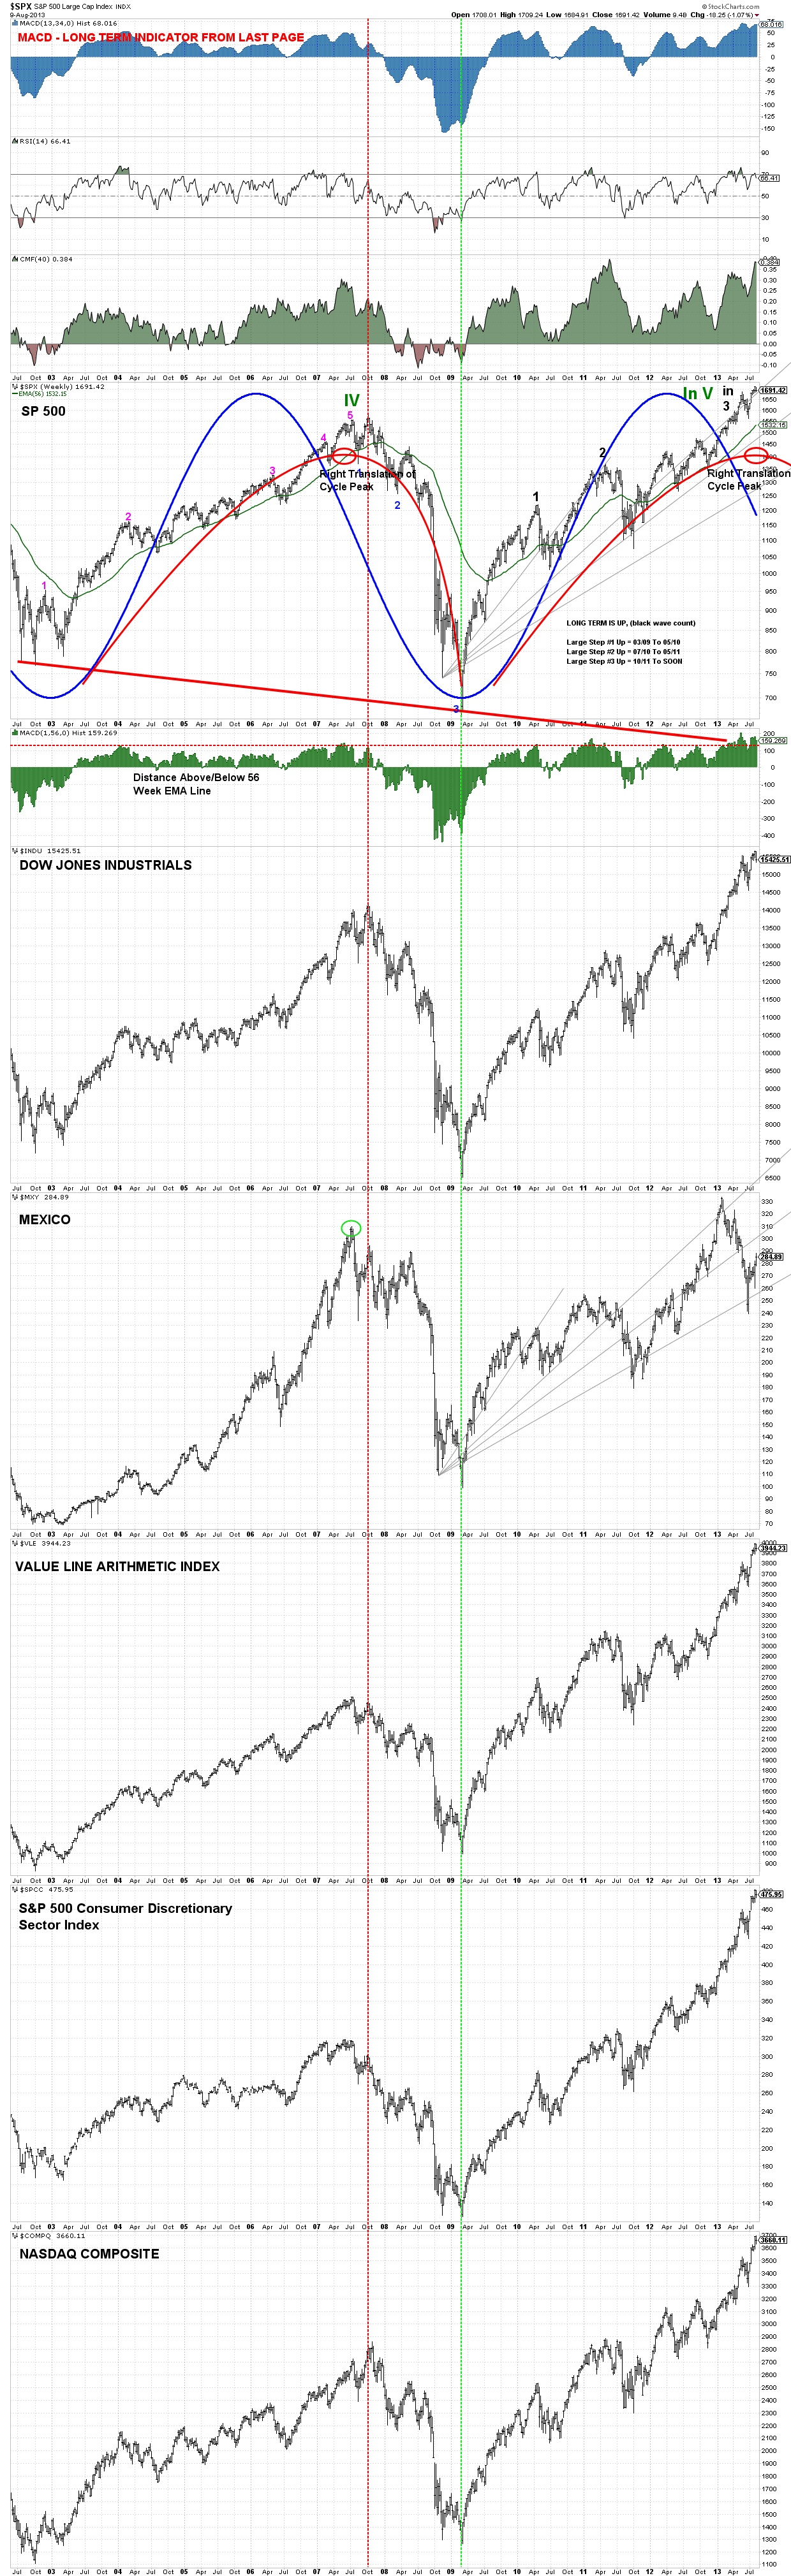
8-11-13 INDEXES WEEKLY
Monthly indexes showing green steps III through V with the megaphone formation. Step I and II took place before 1982.
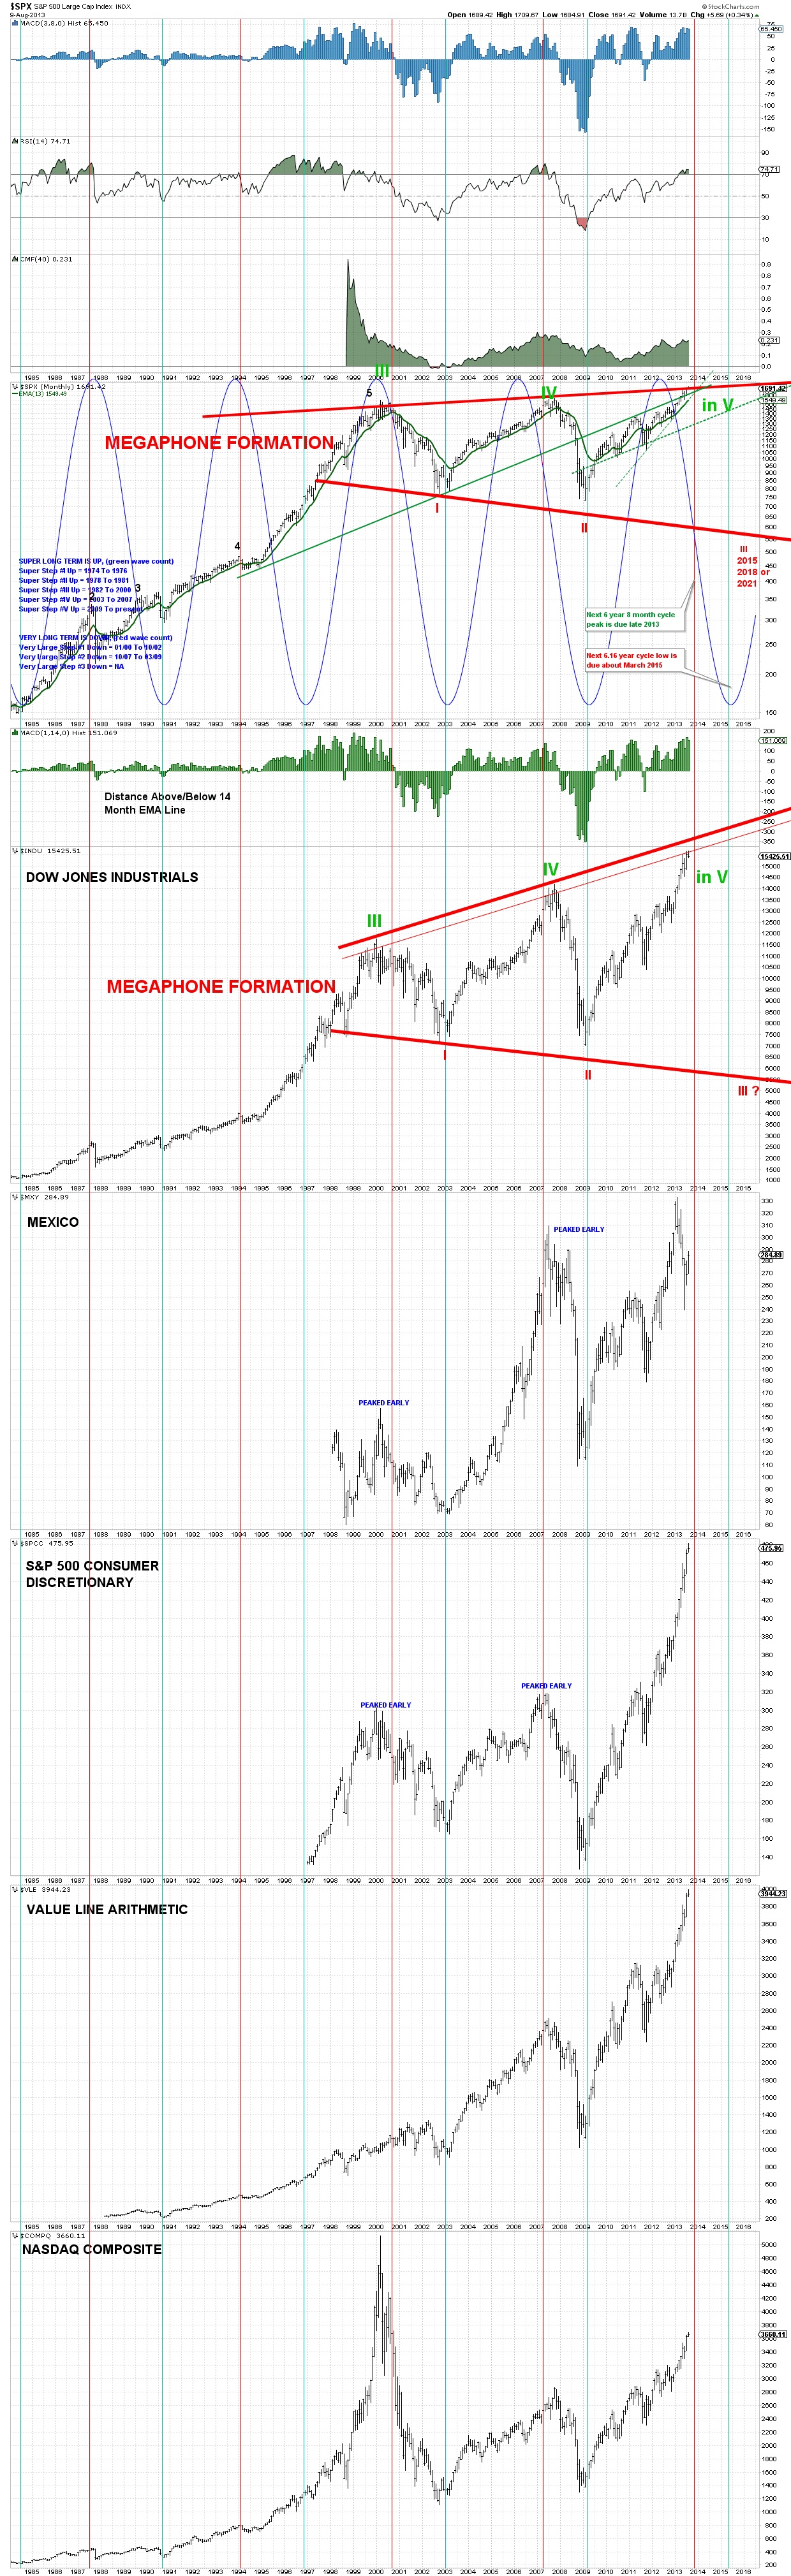
8-11-13 INDEXES MONTHLY
All of these charts can be found on my chart page (link at end of blog).
I hold out the hope that after a significant correction of maybe 33% to 10,500 DJ Industrials, the bull could still be alive and continue rising to new highs for a few more years, perhaps as long as 2018. The up-sloping megaphone line terminates at approximately 18,000 DJI in 2018.
Why did I pick the 10,500 DJI level??? This was the bottom of the correction after step 2 up. Often times, this level can provide support, or an area of support for the correction after step 3 is completed.
Hey . . . I also own some beach front property outside Phoenix – it’s just low tide presently. At least that’s what the salesman told me. So obviously I believe in lotsa dumb stuff.
You’ll notice that what I called a significant correction of 33% is not dubbed a bear market by me. I have adopted Edson Gould’s interpretation of bull and bear markets. I believe that a true bull or bear market lasts many years instead of 6 to 9 months. Bear markets can turn into wide swinging affairs rather than the crashing type of 1929. These wide swinging markets can take on the look of a megaphone formation (higher highs and lower lows).
A bull market that could last until 2018 wouldn’t necessarily change my viewpoint that a really long bear market began in 2000. If we had a very significant upside penetration of the megaphone formation, that might cause me to think hard about it. In fact, I’m counting on an overthrow above the line in 2018.
Unfortunately I’ll be a senile old fool by then, instead of just an old fool like today.
The peak in 2000 was a bubble in optimism in the stock market. The peak in 2007 was a bubble in real estate, which managed to almost bring down the financial system in the USA. So I think it’s possible the peak in 20xx will be a bubble in xxxxxx???? The next bubble peak will likely carry things further down than 2008 – 2009. Presently I don’t see a bubble, but I also didn’t see the bubble in real estate loans in 2007. I was well aware of the bubble in real estate prices but not loans. So just because I don’t see a bubble presently doesn’t mean it’s not hiding out somewhere. But I think the bubble has further to go before it manifests itself. It would not surprise me if the bubble comes from the FED’s policy of its unending money flow.
The really scary part of this scenario is that the last step of this long bear market could end on the down-sloping megaphone line. For instance, if we ended the bull market in 2018 at 18,000 DJ Industrials, we could decline to 5,000 in 2021 for a loss of 72%. The megaphone line declines slowly, so any bear that lasted a few years longer than 2021 wouldn’t have a much different outcome on a percentage basis.
What some would see as disaster would be great opportunity to those who conserved capital during the bear market. Think of it as 1932 and you’ve got lotsa money tucked away to invest in prime situations at depressed prices. It could be the once every hundred years investment situation. Damn, I wish I were young enough to take advantage of this if it comes true. But if I were young, I wouldn’t believe a word of it. Been there, done that.
Today’s theme is nothing new to this blog. I’ve written about this subject since day one. Today we just have more detail to the subject. It probably gets old to some because I dredge this stuff up occasionally. I only thought of it today because we are nearing the end of step 3 and when that happens, I have to get all spooky and drool blood all over the blog.
There is always lotsa money to be made in the market, whether we are going up or going down. But it seems only the brave and knowledgeable (or crazy) seem to short the market. In the end, only conservation of capital is important after a super bear market. A disaster scenario as outlined could see lotsa brokerage firms going under creating a challenging situation. Just don’t depend on SIPC to bail you out cuz you’ll be very disappointed.
Never lose sight of the fact that you can always make money if you use good tactics in any market. Presently, it isn’t the right time to be super bullish or super bearish. Just go with the flow and don’t force your beliefs on the market. Always let the market tell you what’s going on.
I can hardly believe this dribble and I wrote it. Must have been smokin’ the really good stuff today.
JEFF SAUT – AUGUST 8th AND 9th
I shouldn’t insult Jeff by posting his thoughts amongst my crazy ideas. Nevertheless, here are his verbal comments from Thursday and Friday.
Jeff Saut noted that we finally had 3 consecutive days of decline for the “first time this year.”
“squared Uranus” got a choked off chuckle from Jeff (8/8/13). I’m old, but I thought it was funny too, especially since I’m still a juvenile and a trouble maker. What is a squared Uranus . . . other than something 12 year old boys would think is really hilarious???
I’m not into astrology, but . . .
I’m well aware of Arch Crawford and he has made some very good calls in the past. It makes me wonder if Arch isn’t using some tools other than astrology. As Jeff mentioned, Arch is very bearish presently.
Jeffrey Saut of Raymond James is a very savvy guy and one of the few interesting people that I follow. I found Jeff years ago among the talking heads on CNBC, which is normally populated with talking heads spouting popular opinions. When I saw Jeff for the first time, he was mentioning different ideas than everyone else was regurgitating. Immediately this catches my attention because I’m ALWAYS interested in anyone that has a mind apart from Wall Street. Following the crowd will get you killed on Wall Street. After listening to him over time, I realized he was smart, insightful and normally on the mark.
Jeff reminds me of Robert Farrell of Merrill Lynch fame (1970s and 1980s), who achieved a large following being frequently on target. Bob Farrell was one of my favorites during the 70s and 80s.
—————————————————
- Click on any picture or chart to enlarge it
Leave me a comment or question just a few inches below here. If it says “Comment”, click on the comment and you’ll see “Leave A Reply”.
All Rights Reserved © ™

August 11, 2013 at 2:29 PM
Thanks Bob.
LikeLike