May 2010 – T Theory® Update

T Theory Observations for Sunday May 30 2010
Audio Summary (no chart) Audio Commentary
Download TTO20100530-Summary
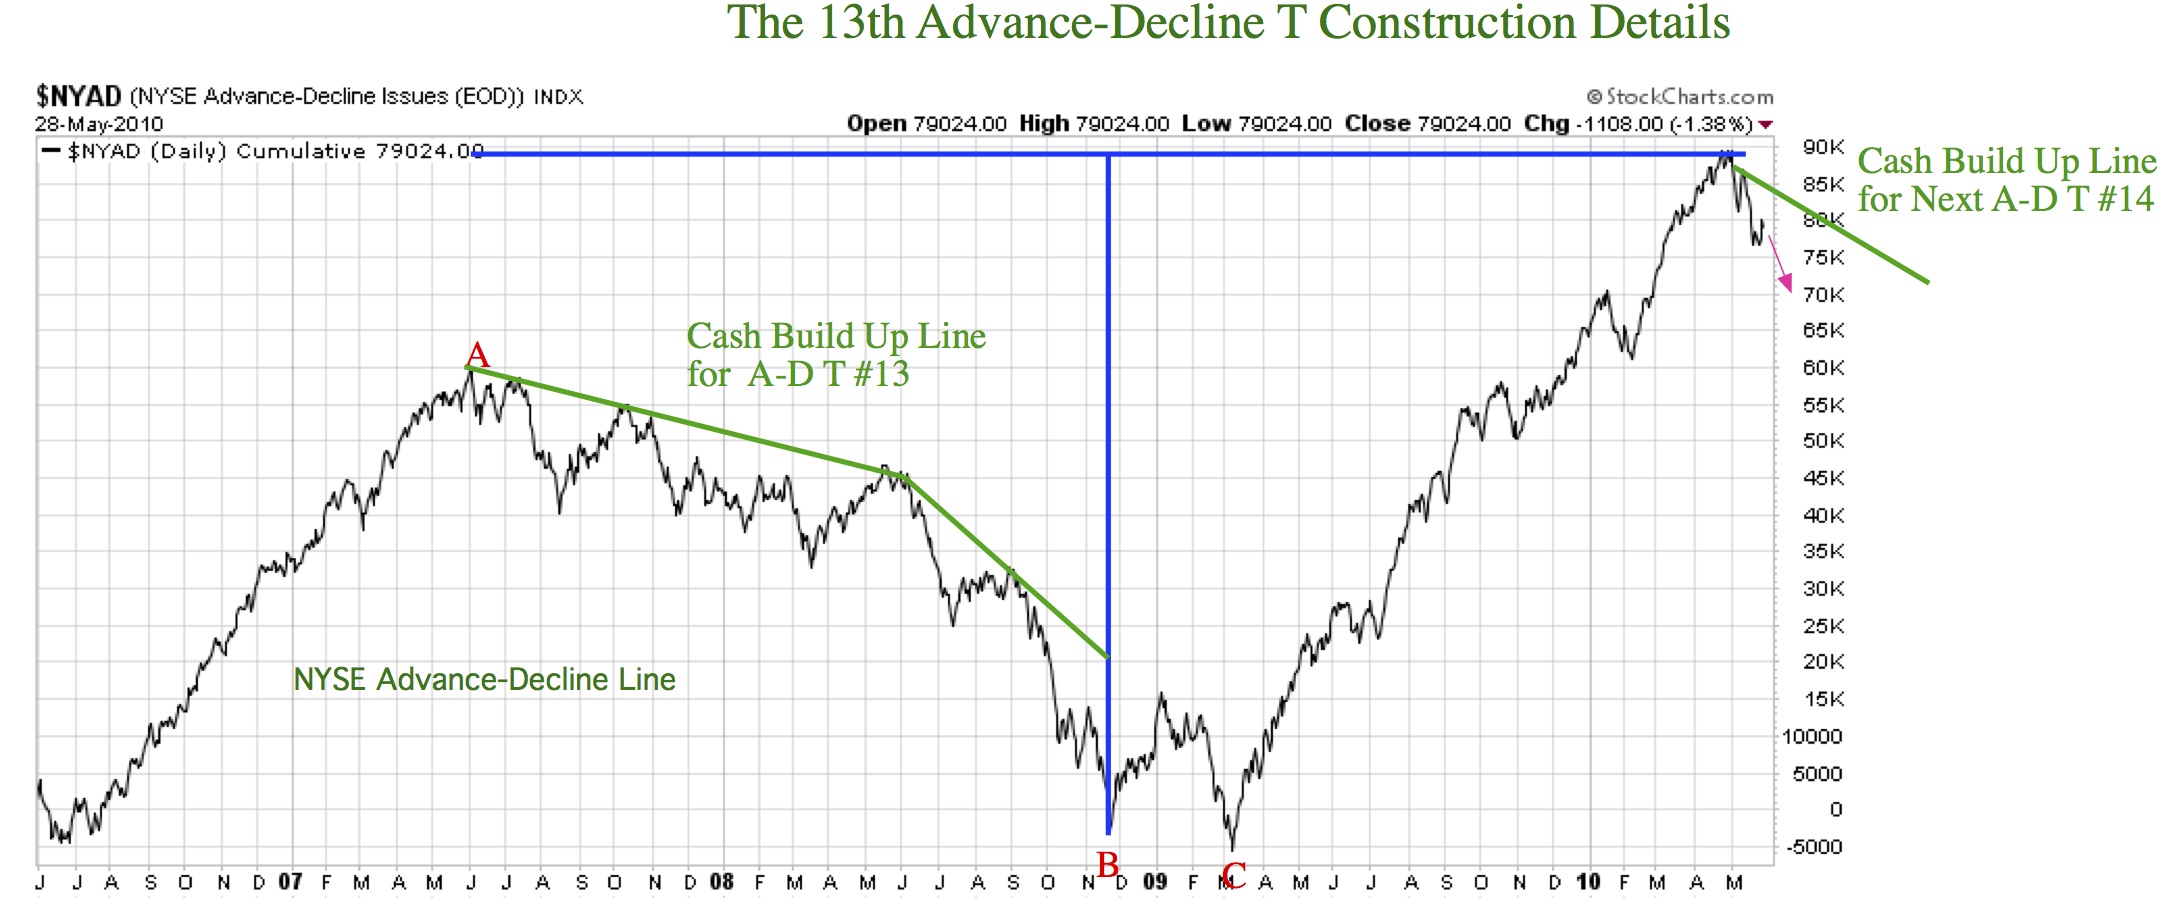
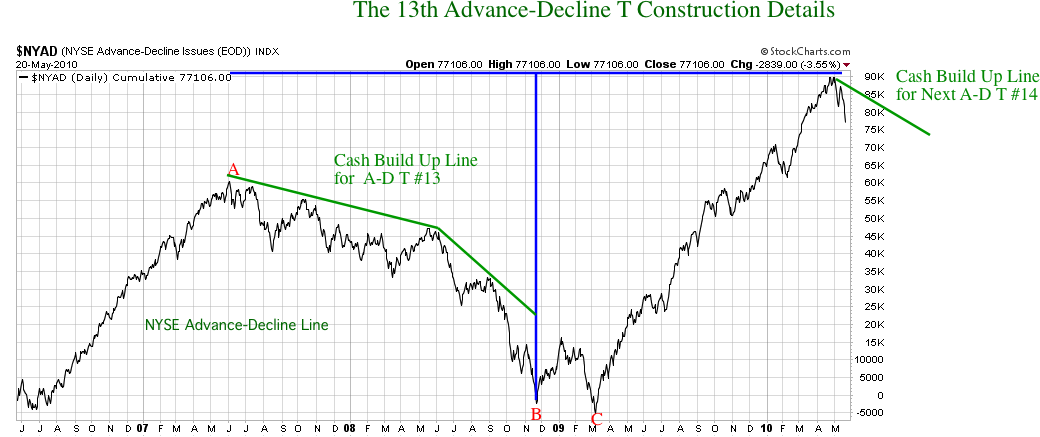
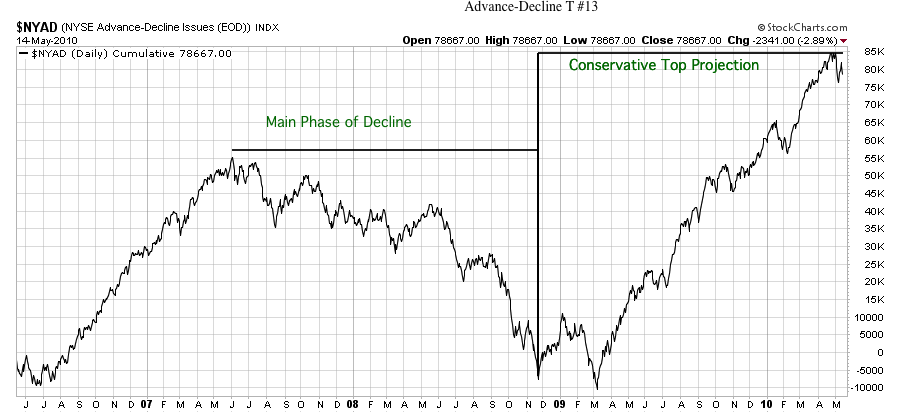
The Advance-Decline T #13 Update
Audio Commentary
Download TTO20100530-AD-T#13
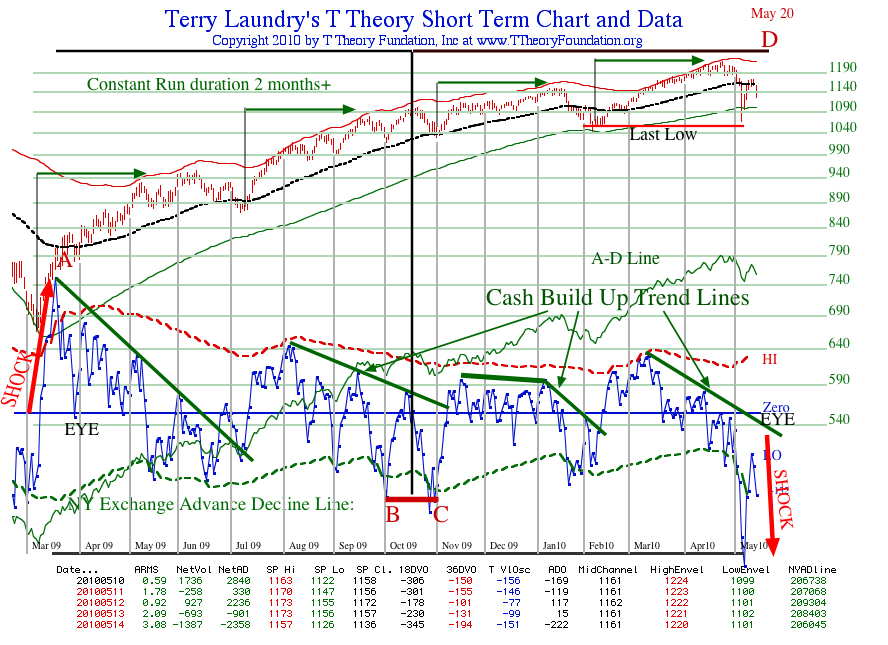
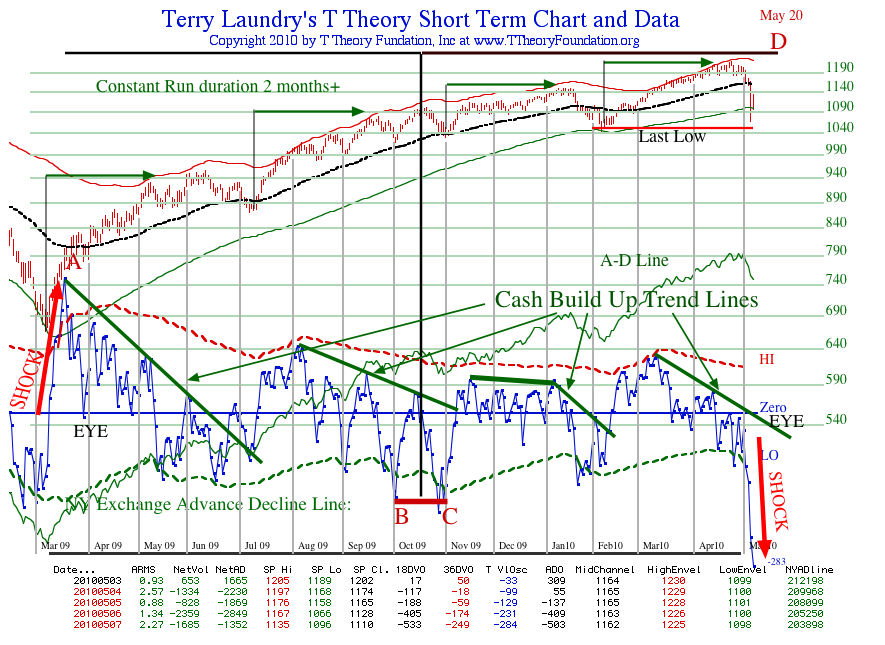
The Short Range T Update
Download 20100528-SRTvopdf
Audio Download TTO20100530-SRT
T Theory Observations for Sunday May 23 2010
Today I will discuss my major conclusion that we have entered a new bear market that will likely last until the year 2013.
Introduction to the New BearMarket
Audio Commentary:
Download AudioIntroNewBearMkt20100523
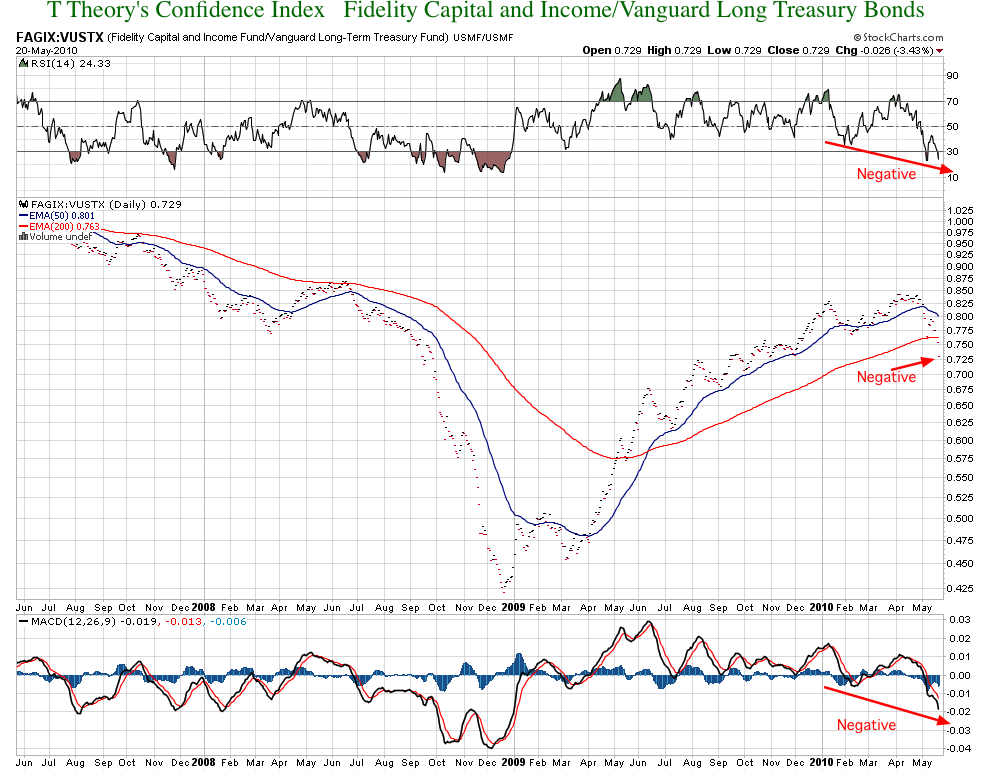
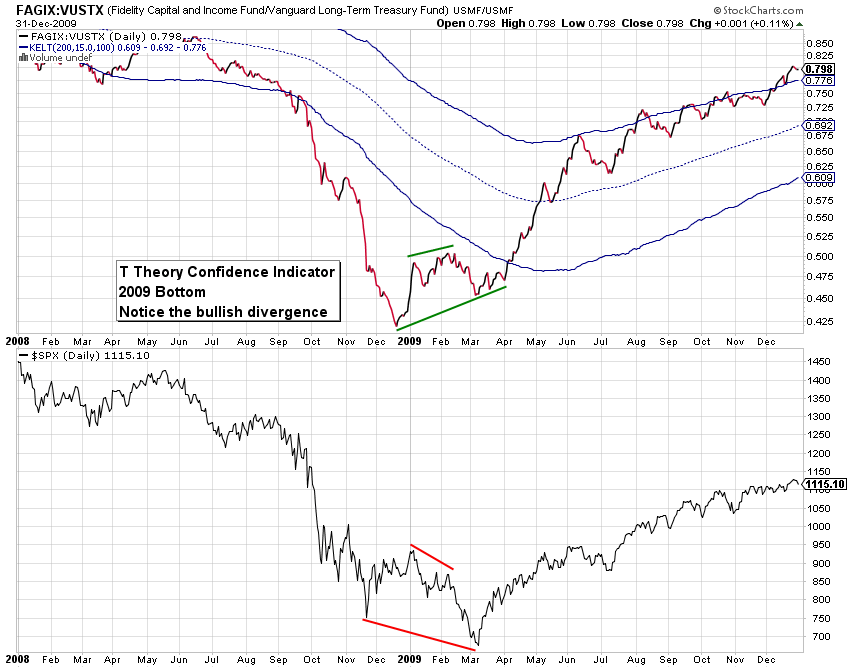
The T Theory™ Confidence Indicator Turns Bearish Long Term
This topic updates developments in the Confidence Indicator developed for my T Theory™ using the ratio of the Fidelity High Yield Capital and Income Bond fund to the Vanguard Long Term Treasury Bonds. You can find the details in the post for May 2 2010 at the bottom of this page.
In summary it shows the loss of confidence that is characteristic of a new bear market. My audio commentary is at the link below. A image of the chart is shown below. The key point is that the low quality high yield bond fund is only up 1.4% year to date while the Treasury Bond fund is up 9.6% signally a flight to a quality preference over a higher yield preference.
Audio Commentary:
Download TTO20100523ConfidenceIdexTurnsBearish
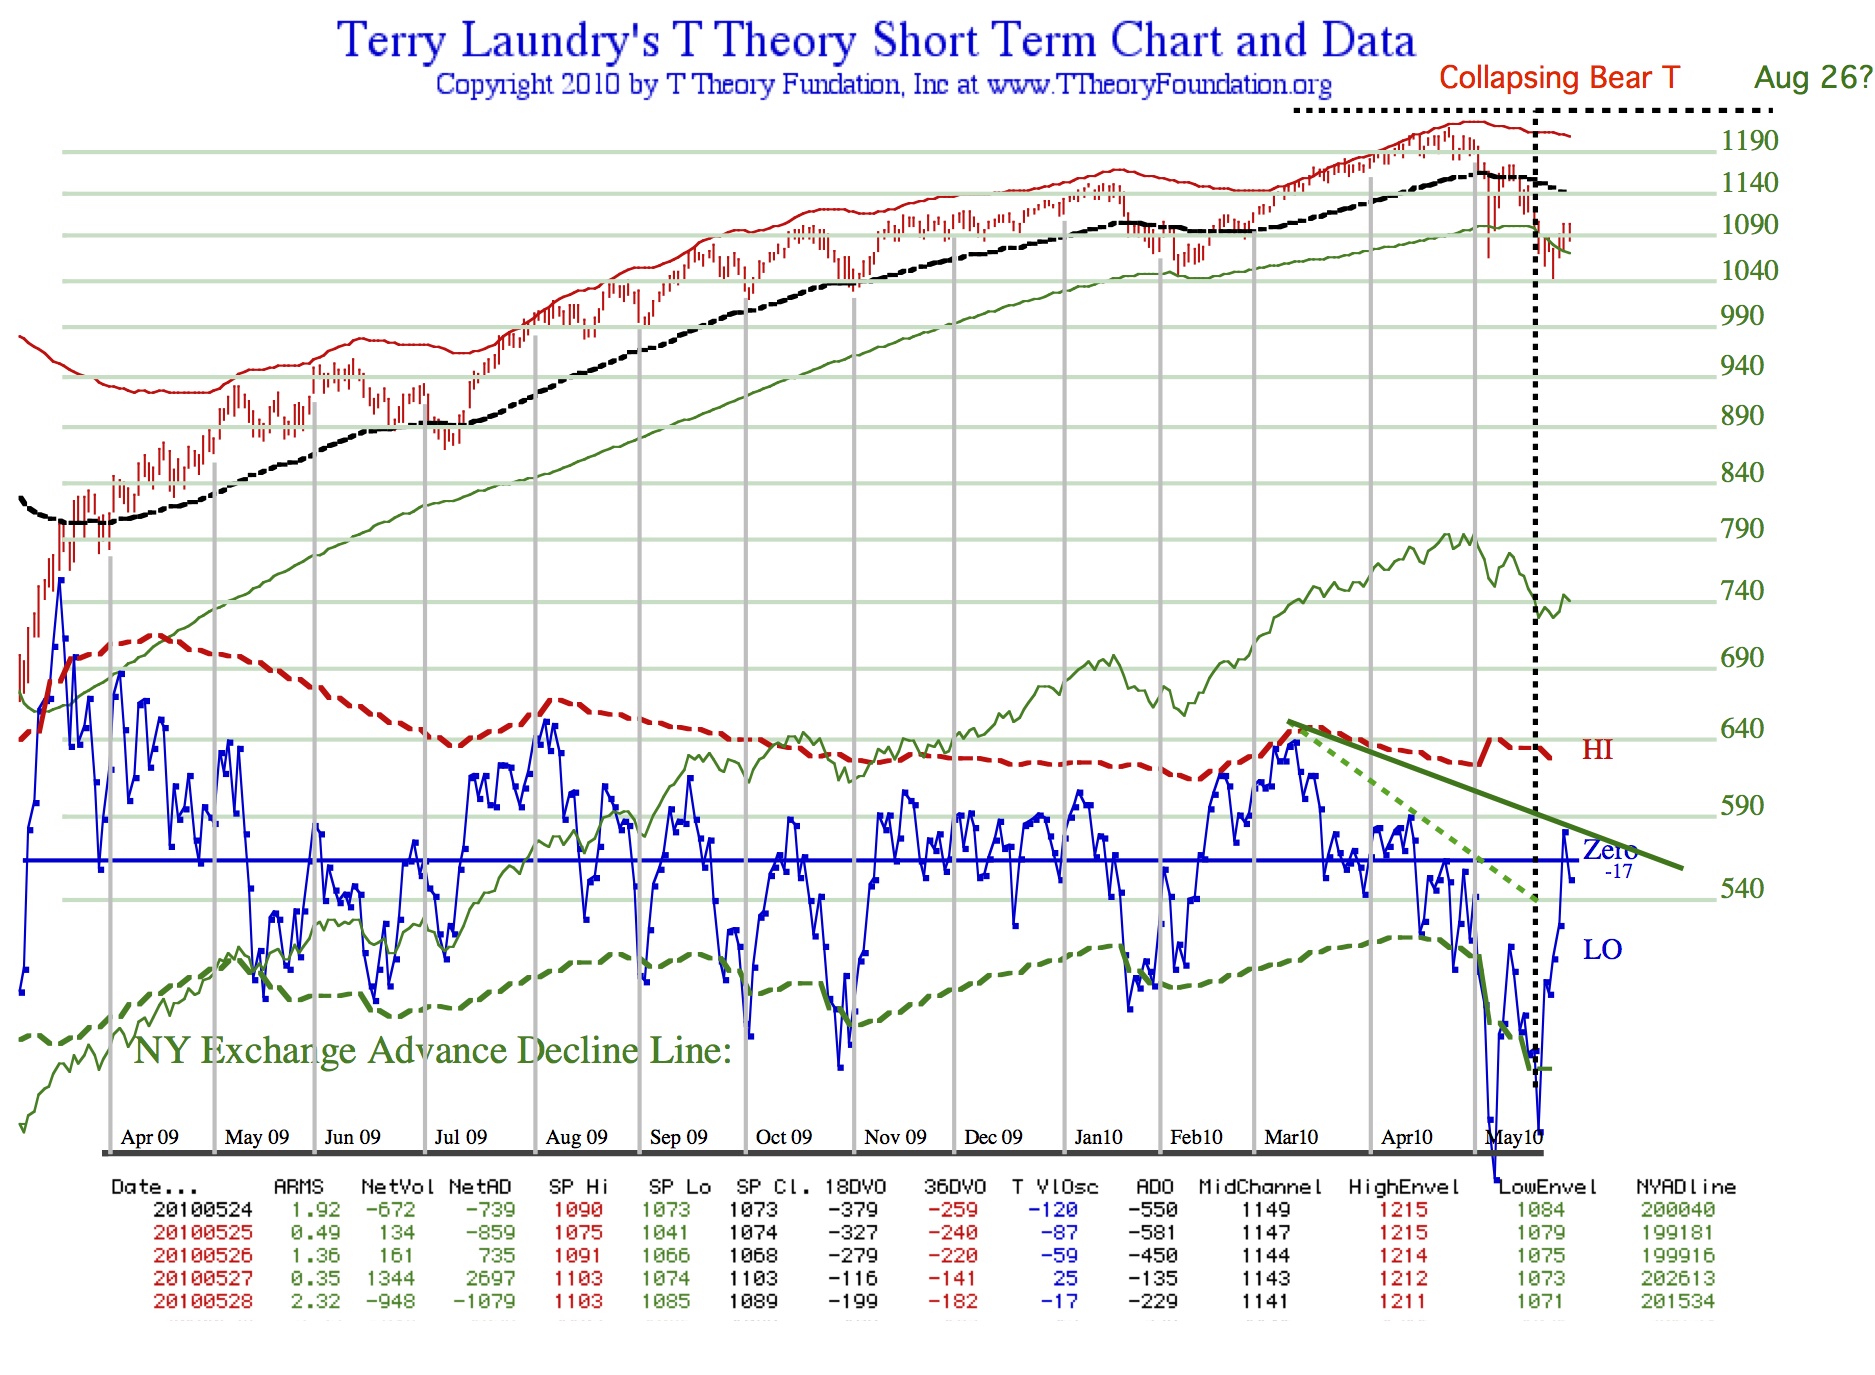
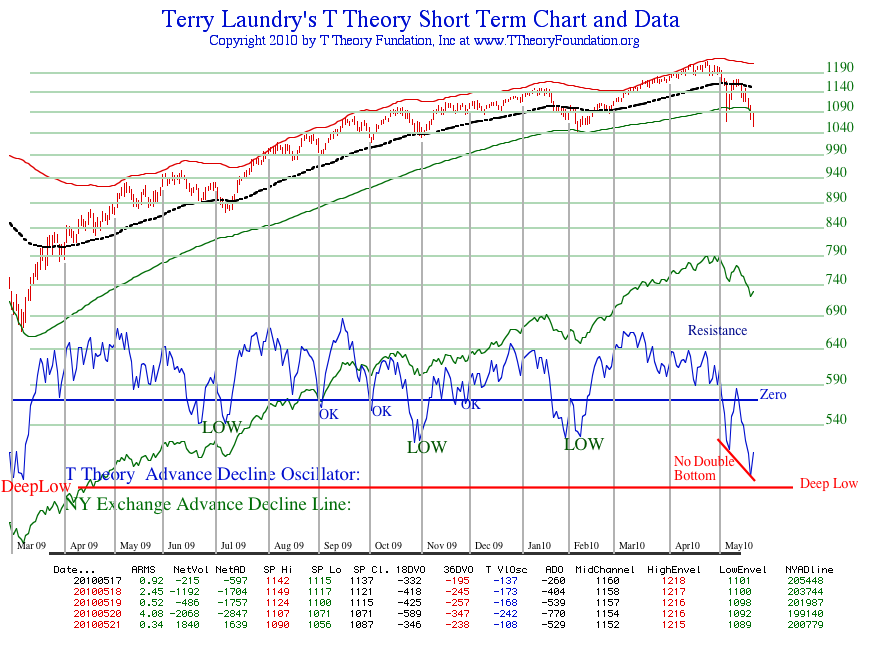
The Advance-Decline Oscillator not Signaling any Important Low Near Term
My Advance-Decline Oscillator has dropped to an oversold condition that is not consistent with a bull market and has not yet shown the double bottom or rising bottom pattern that signals a sustainable recovery. A better quality PDF chart is provided below.
Audio Commentary:
Download AudioADO Bottoms20100523
The Advance-Decline Line Ts Outlook is Bearish Long Term
The longer term trend of the Advance-decline Line has passed a projected peak in May and is likely to be headed down at it did from the early June 2007 peak. A higher quality PDF file is provided below the chart.
Audio Commentary:
Download AudioADTConstruction20100523
China Fund Topped Out
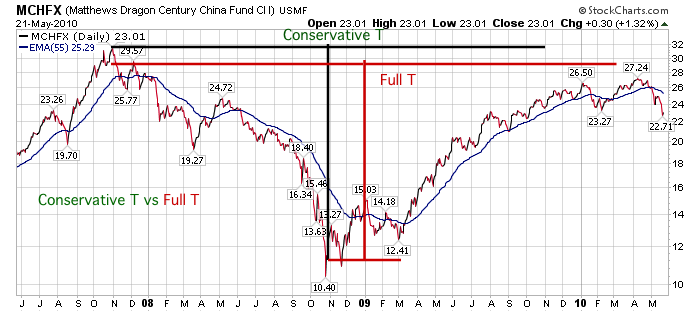
Most of the emerging markets are following the China Funds topping process via either a conservative T or full T as illustrated in the chart above.
Audio Commentary:
Download AudioChinaFundTs20100523
Summary of Todays Post
Audio Summary:
Download AudioSummary20100523
T Theory™ Observations for Sunday May 16 2010
Sunday’s topics summarizes the big picture in terms of Investment Alternatives of US Equities vs Bonds vs Gold in the first table and its relationship to my discovery of the 40 Year Cycle. Then I move on to the details, including the potential for an important decline near term.

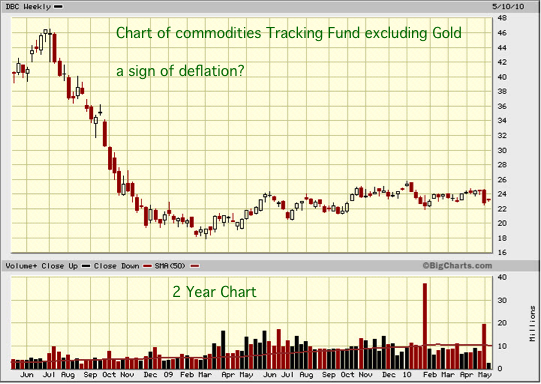
Recent History of Gold Breakouts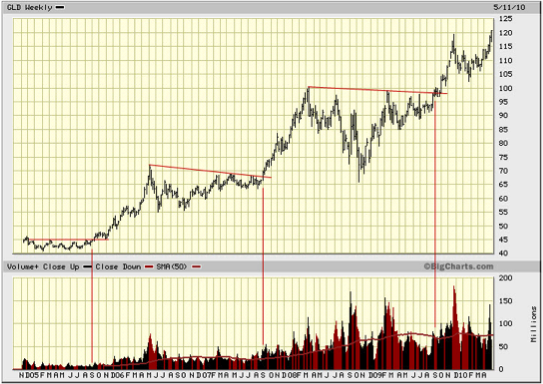 Commodity Tracking Fund not Including Gold
Download TTO20100516T#13Concepts T Theory’s Advance-Decline T #13 with Nulled Echo
Short Range T Cash Build Up Formation Chart Commentary for Short Range T Daily Chart Download TTO20100516Short Term T Discussion
|

T Theory™ Observations for Sunday May 7 2010
Sunday’s topics summarizes the new short term developments and refines the 40 Year Cycle forecast.
| Each topic has its separate Audio file. Pull up a chart or print it, then start the audio separately. Higher resolution PDF charts are usually supplied at the link following the chart images below. You may download the charts and print them for your collection. |
Current projections from the Short Term Volume Oscillator Chart
Commentary for Short Term Topic
Download TTO20100509 STCommentary
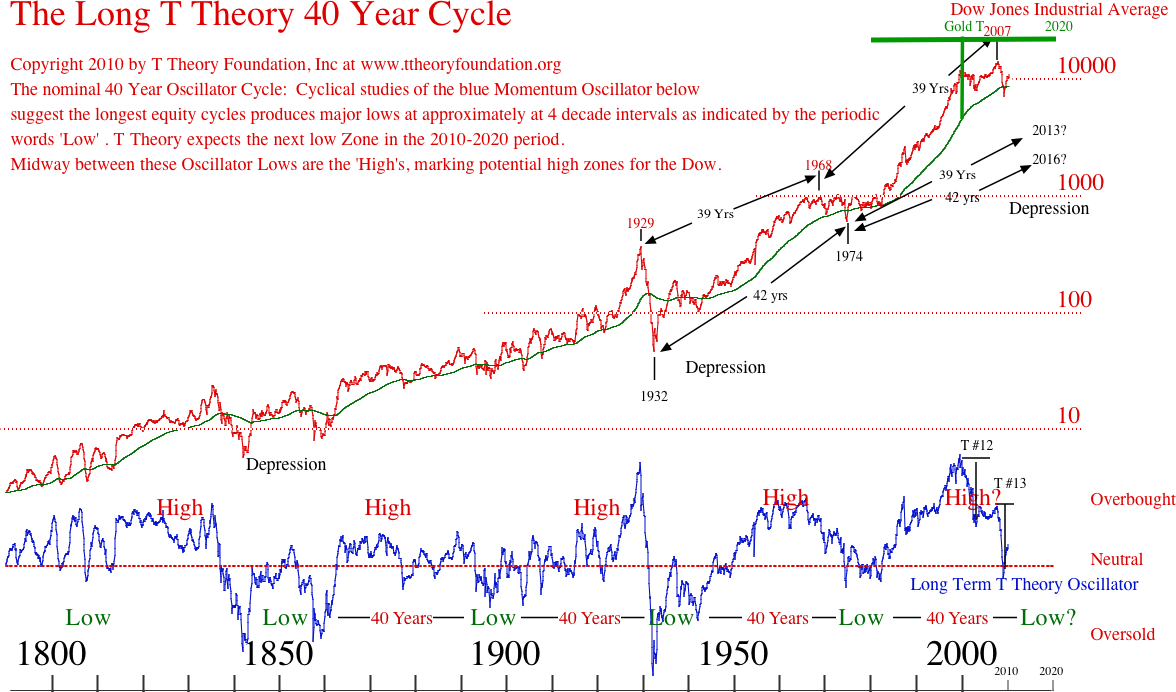
Review of the Forty Year Cycle Chart
Commentary for Forty Year Cycle Chart
Download TTO20100509FortyYrCycleCommentary
T Theory™ Observations for Sunday May 2 2010
Sunday’s topics summarizes my comments regarding questions emailed to me and further analysis of the equity market using the Volume Oscillator Chart below and Parker’s interpretation of my T Theory Confidence Indicator™ that follows.
Alvis says:
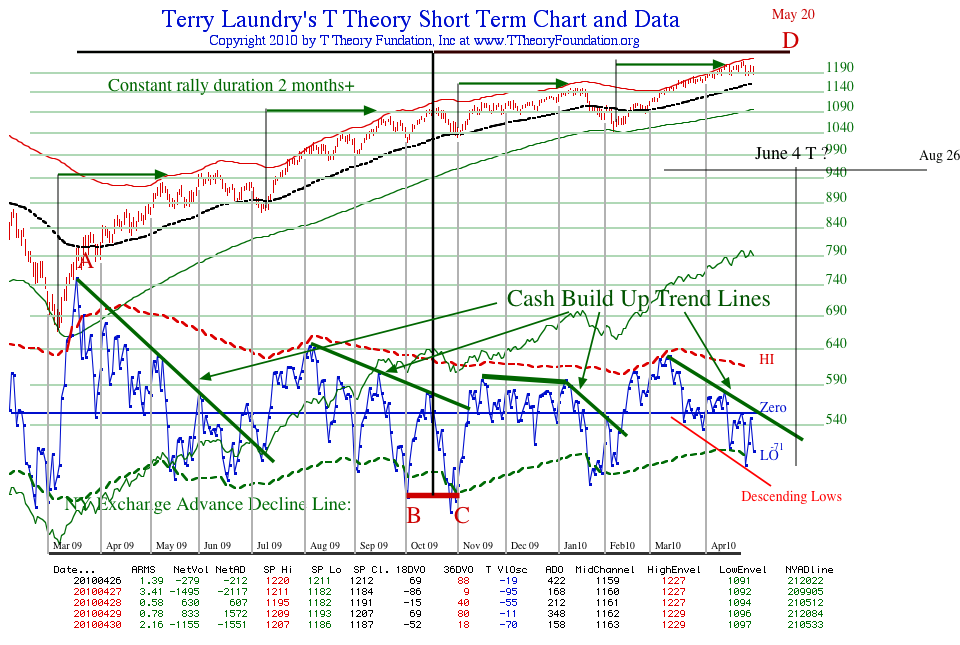
Terry, your point is very important in that we need to wait to see where the new short range T’s center post low actually will go. For it to project the August 26 peak,it will need to go about June 4th. For that to happen would probably mean a mild osc. break of the Cash Build. Up line into May 20 and then collapse back under it with a low about June 4 and then base out until the June 20 “low”. I just wanted to share this with you before you did your work for the Sunday review.
Jeffery says;
I am always looking at previous bull markets to see if I can find any type of similarity and stumbled across this yesterday while doing T work trying to figure out strong runs like the one we have been having that keep defying conventional wisdom.
Each topic has its separate Audio file. Pull up a chart or print it, then start the audio separately. Higher resolution PDF charts are usually supplied at the link following the chart images below. You may download the charts and print them for your collection.
Overview: The Four PIGS Story Audio Commentary
Download TTO20100502 TheFourPIGS
Current projections from the Short Term Volume Oscillator Chart
Commentary for Short Term Topic
Download TTO20100502ShortTermProjections
Parker’s 4 Daily Charts of the T Theory Confidence Index™ vs The S&P 500 Equity Benchmark
Audio Commentary for the Confidence Index
Download TTO20100502TTheoryConfidIndex
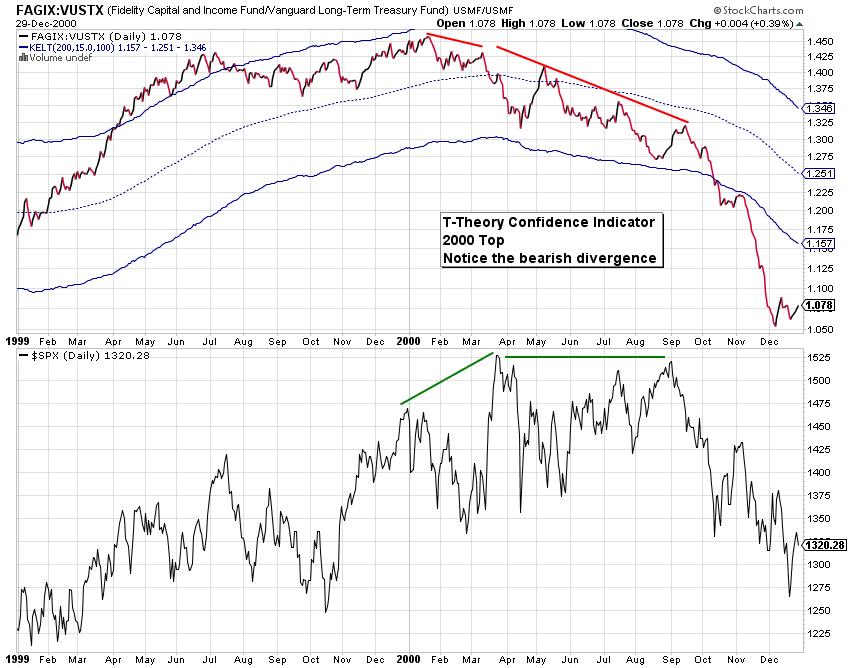
T Theory Confidence Index Divergence projects major 2000 Peak
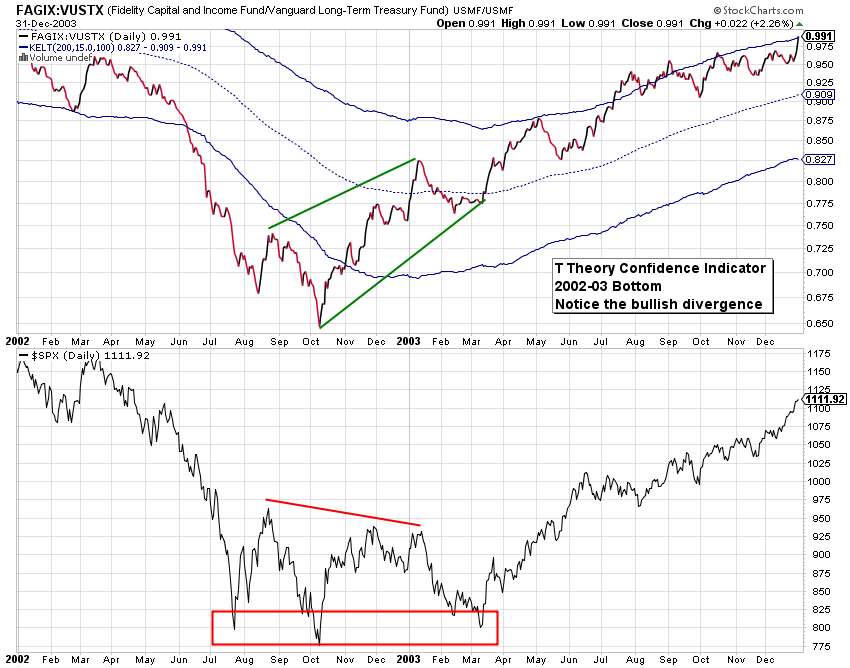
T Theory Confidence Index Divergence projects major 2002/03 Low
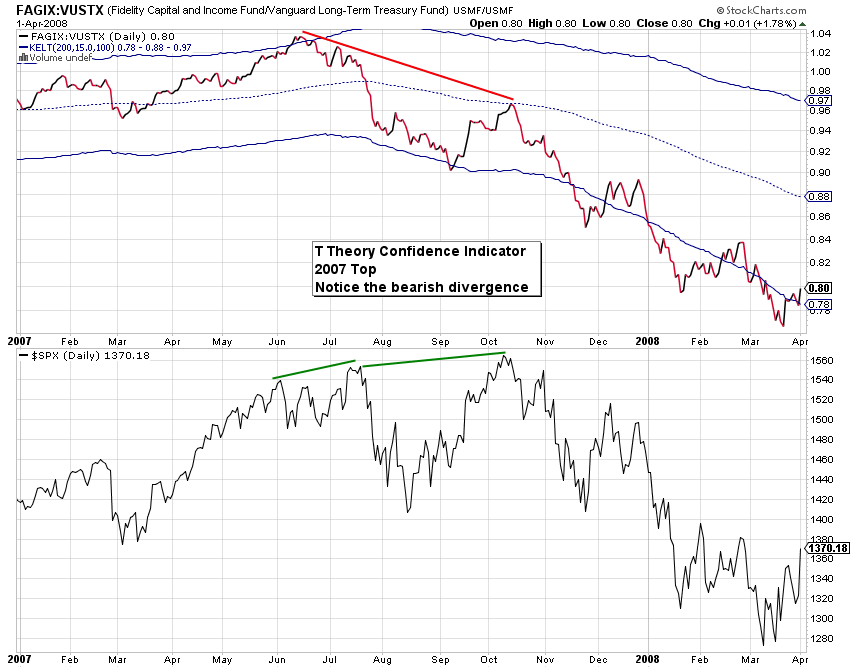
T Theory Confidence Index Divergence projects major 2007 Peak
T Theory Confidence Index Divergence projects major 2009 Low
****************************************************************************************
All Rights Reserved By The T Theory® Foundation ©
Order the T Theory® Encyclopedia
For a complete understanding of the T Theory® and how to successfully use Terry’s unique methods, order the Encyclopedia from Paula at the above link. There is additional material in the encyclopedia not covered here. Paula will be more than happy to answer your questions too.
Many thanks to Paula Burke for her permission to re-post Terry’s old T Theory® explanations. The period re-blogged on these pages are some of Terry Laundry’s best work and was published here from public domain.
****************************************************************************************
I claim no credit for the material found under T Theory® on this blog. All of this material is the creation of Terry Laundry and was downloaded from Terry’s free blog site (TypePad). I have created a mirror of Terry’s original material and now there is a second site containing Terry’s T Theory®. One or both of these websites hopefully will survive through time as Terry’s material is too important to be lost to the ravages of time. This site is simply a memorial to his lifetime work.
The page content re-blogged here is exactly as Terry created on his original webpages (saved on my computer with ScrapBook)). Nothing has been left out from the period Dec 2003 to June 2011. From Terry’s site, I made a lot of formatting changes, creating a more easily readable webpage appearance. The PDF chart duplicates of the JPEGs have been omitted for ease and speed of recreating Terry’s pages. References to PDF charts should be ignored (but no chart was left out).
After June 2011, Terry created a paid subscription website. None of that material is found here.
There were many many, many hours spent on this project; downloading Terry’s individual charts & audio files, followed by the uploading of Terry’s charts and audio to my WordPress blog library, after which I had to insert the uploaded material into my new T Theory® webpages (hopefully in the correct places). This was a dull and arduous project and I hope you enjoy it. I don’t believe there remains any more of Terry’s material in free domain, so my T Theory® project is probably finished. If I’ve missed something, you can leave me a comment.
If you find an uploaded reference error (chart or audio in the wrong place), please note the month and year of the webpage, plus the exact name of the referenced error file. Include any other info that will help me locate the problem file and where it occurs on the webpage. Leave a comment for me with the info and I’ll fix it.
Terry’s material is very long and will take many weeks for you to finish. Don’t hurry, it’s not a marathon and you will absorb more if you go through it at a reasonable rate. This is especially true for those who don’t invest in the T Theory® reference encyclopedia. The encyclopedia is a written reference for T Theory® and includes everything of importance for Terry’s T Theory®. Without the reference encyclopedia you must depend on your memory and Terry’s method carries some rules that you could easily violate. The encyclopedia also includes new information never seen on his website.
You are welcome to save any or all of my blog material to your computer. You also have my permission to re-blog my information, but you must (1) credit me and my blog in an obvious manner and (2) don’t change my material.
FYI – I find the best way to save a webpage is using “ScrapBook” (it’s an add-on for the FireFox browser). ScrapBook saves a webpage to your computer EXACTLY as it appears on the day you saved it. You can’t tell the difference between the internet webpage and your ScrapBook saved webpage. The saved pages are not pictures. Instead the pages consist of HTML and page functionality remains identical on your computer. There is also a second method for using ScrapBook, where you can save all of the webpages down to a defined link depth. This optional method means all links will function on your computer to the link depth specified (meaning you can click on links on your saved webpages and tunnel down into pages within pages). Saving the normal way will only save the top webpage but the links that exist could continue to function by taking you to the website on the internet instead of on your computer. But sometimes the linked website doesn’t exist anymore. I’ve had this happen on some very good webpages with unique information (they just disappear into the internet void). That’s a bummer when you lost some really good info and thus rose my need for ScrapBook. You can also filter the pages saved using the optional ScrapBook method, which can exclude all pages not coming directly from the specified website (filtering is recommended using this method otherwise you wind up with a LOT of useless stuff).
.
Explore posts in the same categories: . . . T Theory®
Leave A Reply