January 2004 – T Theory® Update

Short Range T Update Jan 23 ’04
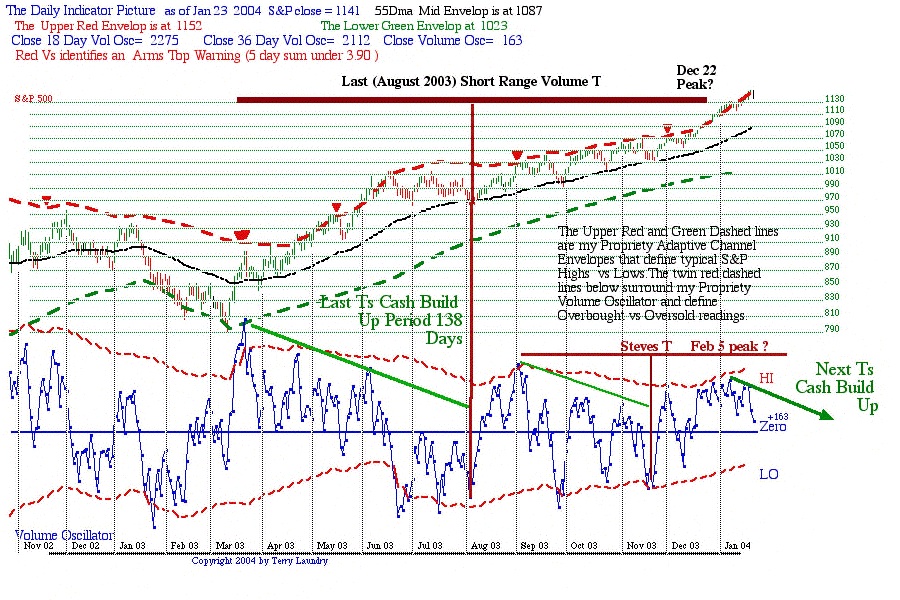
The Daily Short Range Oscillator T chart below updates the Short Range T picture as of the Friday January 23 close. Click on the image for the full sized image.
My commentary for this week’s analysis is keyed off the two thoughtful questions posed below. If you have questions of a general nature, I suggest you pose questions in the form of a comment at this site, rather than an email. This is more convenient for my work schedule. I will then do my best to work any general questions into future discussions when they become appropriate to the subject under discussion.
In the first question; Steve asks about a possible small T, which is nested inside my larger T. (I have labeled it Steve’s T in this week’s chart) He asks, If this “nesting” phenomenon has become a valid T Theory pattern, then another short-term T may have formed for the SP-500, which has a center post on or about November 19th … the corresponding left side of the T may have begun on September 2nd. Accordingly, the right side of this newer T extends through January 2004 (Terry’s Note: Ideally Steve’s T projected peak dates compute to a Feb 5 estimate according to my date calculator).
Steve then goes on to say, “On many fronts, though; the equity market is very overbought. Thus, this possible November 19th T might prove to be of a collapsing nature, which could signal the end of what most likely has been a bear market rally.”
In a second question, Husk asks; “First, your work is interesting, and I think logical. I notice that the left side of the T currently completing has the volume oscillator declining, while the actual S&P continues to go up, in fact, it may be that percentage-wise it rises more during the cash build-up phase than it rises on the right side of the T. It is easy to imagine a cash build-up occurring with declining prices, but what do you ascribe as the reasons for the cash build-up in the face of increasing market prices?”
Both questions address fundamental T Theory issues and I appreciate the thought and effort because they provide me with ways to think about the basics of T Theory. It is worthwhile remembering that T Theory’s basic premise, price rises will last only for the time period defined by the prior Cash Build Up period, is better stated as the market can only show a trend stronger than the ‘norm’ for as long as it had previously shown weakness relative to the ‘norm’.
When applied to many different equity trends, some covering the short term as in this example or, very long term trends in the last two centuries Mega-T examples, the average results show the projected rise matches the time period of the prior cash build up, but the individual examples can be quite variable. In some cases the projected rally in the right side of the T lasts longer than projected (as is true for the current T) while in other cases the rally never develops the full period projected by the time symmetry. I have not yet found any reliable way to anticipate the difference. I think it best to state the T’s time projection in straightforward terms and then study the trend within the framework of the adaptive price channels for further clues.
For the current it could be argued, as Steve has, that the great upside momentum perhaps deserves an extension to the projected duration of the advance. It may be true in this case, but in the prior T coming out of the March 2003 low the rally in the right side of the T was not able to reach its projected peak date. So each instance is separate and the results vary from one T to the next.
I am tied up with other end of the month obligations for this week so let me delay detailed comments on these two questions until we have more data relative to the early beginnings of the new Cash Build Up apparent in the volume oscillator as of Friday’s close. With respect to Husk’s question the volume oscillator pattern really deals with relative momentum conditions making the interpretation of these charts more subtle than say the 39-week adaptive channels that deal directly with prices.
For example the volume oscillator is seeing the first signs of a topping process. But in recent weeks this decrease in momentum has just provided a “resting” correction, no real drop in prices. New buying has always come in during these “rests”, and enabled the market to head higher. If these T constructions are to regain their normal control more meaningful corrections must become in evidence over the next few weeks, particularly if the Feb 5 date has any meaning. Losses in price trend since the March ’03 low have held at the 55-day MA, plotted as the black line in the S&P plot. A full correction would need to see this support level broken to the downside.
The more sensitive measure is however the volume oscillator. It is a measure of momentum, and tends to fluctuate between the two red lines that represent upper and lower adaptive channel limits for this momentum measure. Tops have been occurring at the upper red extreme, with reaction lows at the lower red line. If the next correction doesn’t break below the lower red line, and the 55-day Ma doesn’t break its black 55-day MA support line, then no real cash build up, beyond a normal “resting” correction has occurred. This addresses Husk’s concern that some sort of serious price correction is needed for a real new T low, not just a mild oscillator momentum correction.
So the formation of the next T requires a breakdown of these two shorter-term trends. This is consistent with the 39-week MA Channel Envelopes channel criteria discussed early and what I look for over the next week or perhaps after February 5. …Terry Laundry
Short Range T Update
Short Range T Update Jan 16’ 04
The most current daily chart below plots the S&P 500 benchmark verses my blue proprietary Volume Oscillator. Click on the chart image for a full sized image.
This update continues my T Theory shorter-term outlook and provides near term commentary for the general market as we move further into 2004.
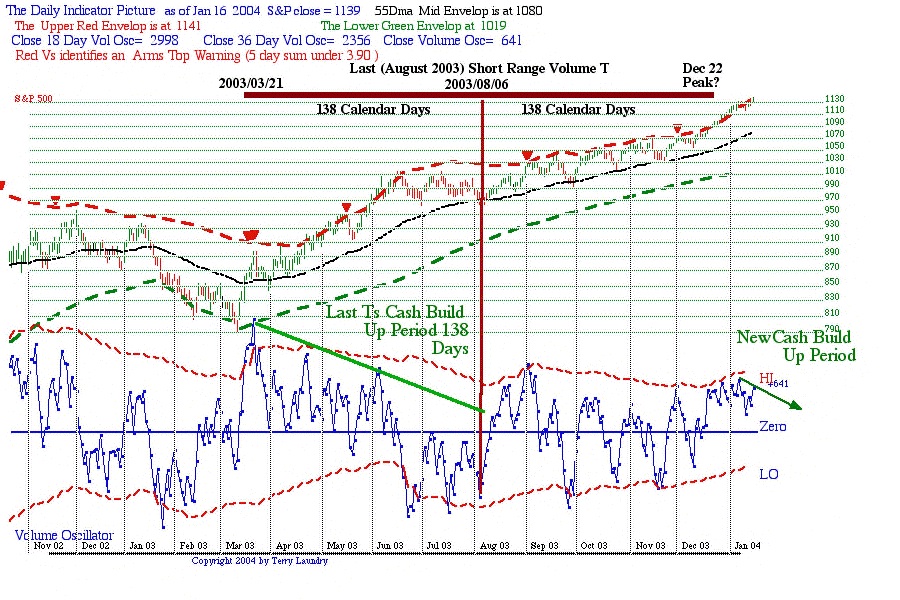
In the prior update we have seen the S&P trend “over-run” the T’s Dec 22 projected peak date according to the last completed Short Range T shown here. This may be bullish for the very near term on a momentum basis, but the long history of these Ts shows that the upside momentum will simply “run out” once a T expires. The next T in this series then requires a new Cash Build Up Period as I have noted in the chart.
This new Cash Build Up Period, which will define the left side of the next T, must be defined by a new descending peaks pattern (as represented by a down-ward sloping green oscillator trend line) in the blue Volume Oscillator.
It is possible we are now seeing the early signs of a new declining peaks (Cash Build Up) pattern evolving as of the Friday Jan 16th close. Note the green trend line in the oscillator. It is possible fresh upside momentum will bring the oscillator up to new highs early next week thereby negating this basic idea of a descending oscillator peaks. However the breadth figures were relatively modest on Friday, so I suspect any loss of momentum early next week will continue to create a Cash Build Up criteria. Once a descending Oscillator peak pattern is set up, we can then monitor its downward path and start looking for the center of the next T. This will probably take some weeks to set up.
I will be posting this chart weekly, probably Friday night as I wind up my weekly work schedule. Generally I generate the chart on Friday after the close, but only add a few key chart notes before posting. Monday morning I review the long history of these Ts and add my analysis. The text analysis will be uploaded by noon on Monday.
Keep in mind the two basic characteristics for these Short Range Ts.
All market advances take place in the right side of the T that had been previously defined by an oscillator descending peaks, termed the Oscillator Cash Build Up Period. Unfortunately each new Cash Build Up has a basic uncertainty as to the amount of buying power that was accumulated, so the strength of the market trend in the right side of the T is quite variable.
To assist tracking the new T’s resulting market rally adaptive envelopes are applied to the S&P portion of the chart and the Volume oscillator momentum is monitored for acceleration or deceleration as the case may be. I am currently developing a series of Short Range T plots going back many years as part of my ongoing studies. They will become available later this year. …Terry Laundry
Introduction to 39 Week Adaptive Channels
During the late 1990’s I researched a “Price Swing” concept to act as a companion to the T Theory’s time symmetry projections. The weekly plot of the S&P 500 benchmark below illustrates what I call my “adaptive channel envelopes” as they apply to the exponential 39-week moving average (MA) plotted in black. Click on chart for full sized image.I have added some technical notes to the chart that summarize the statistical ideas behind the concept. These envelope channels are very useful for resolving T Theory ambiguities and setting price objectives. Right now it can help to refine the T Theory projection that the current trend is overbought, in line with the 2003 BRKA T discussed earlier.
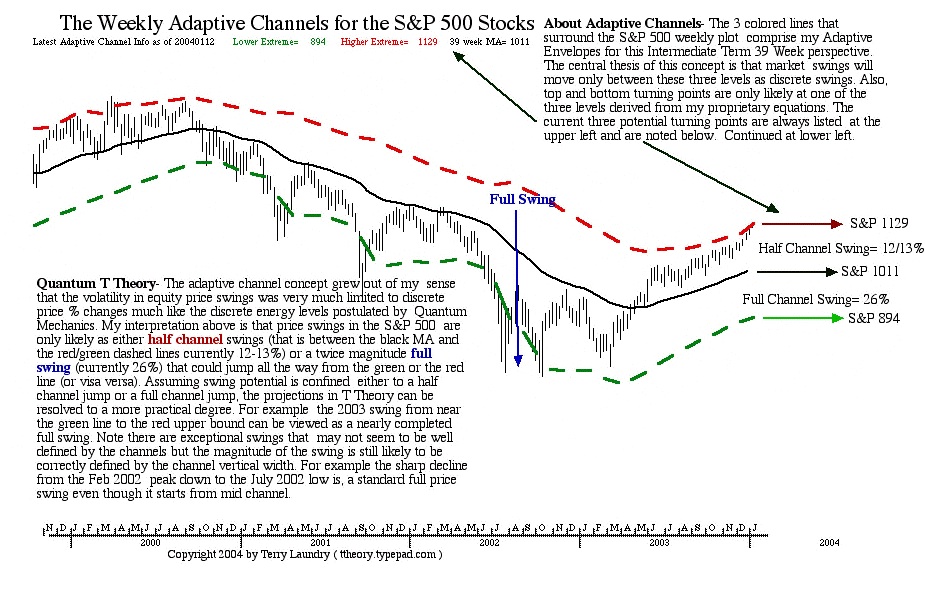
The significant practical aspect of these channel’ envelopes for the current period can be seen at the upper red dashed line. It plots a statistical estimate of the upper over-bought envelope (the red dashed line) as an estimate of upside price resistance level for the S&P 500 after strong rallies have dissipated. Resistance to further advance usually occurs near the S&P level designated as the upper extreme in the tabulated data noted just below the title. The S&P 1129 level is the current estimated overbought level as noted. However the equations that calculate this upside resistance are constantly being updated, so one needs to keep an eye on the trend of the red dashed line as well as its current projected maximum over-bought potential. Also remember these calculated resistance levels are not necessarily exact.
Turning to current matters, note the S&P is current at the extreme. Because the trend is rising, the extreme will probably rise modestly each week until it exhausts its emotional momentum. Nevertheless history says these red upside projections are still an emotional extreme and should shortly turn into price extremes for the upside move. This red dashed line extreme can be seen to match the upside overbought levels that limited the year 2000 euphoria associated with that late Dot.Com bubble. And in general it can specify upside limits of over enthusiasm that usually mark important market peaks. Just track the red dashed line back into the 2000 period to see how extremes calculated this way eventually exhausts overbought up-trends.
This estimation of a significant price level for extreme price excursions very often helps to confirm a T Theory forecast of a peak in time. This is its primary use in T Theory and its primary application for the current time period. As we have seen in recent discussions, both the BRKA T and Short Range Volume Oscillator Ts call for late 2003 peaks. The Adaptive Channel’s extreme upside value estimate would seem to independently support the time projection of a peak in this general region. However it provides the more practical price estimate that is missing from the time concept.
In my experience the most interesting aspect of these channels is the sudden development of what I term the “Half Price Swing” that often hits the market with sudden and surprising consequences. For example in early 2000, during the dot.com bubble’s the rise to the upper red extreme, the temporary loss of upside momentum in mid Mar 2000 produced a sudden collapse down to the neutral 39 week MA represented here by the solid black line. The drops can be quite unnerving, often amounting to a 10% decline within a few weeks time. In retrospect such corrections are simply part to the trend’s natural movement within these adaptive envelopes.
A companion development of a sudden price drop to the nominal moving average that defines the center of these adaptive channels is occurring in Gold Bullion right now. In my Gold Mega-T discussion I noted the very long term bullish outlook for gold, but that cyclical lows had been occurring at 8-month intervals and the price of gold is likely to be touching its 8-month MA as part of its cyclical nature. This might imply gold would come back to its MA, $390 at the time of that article, but now about $400. Time will tell, but Gold does seem to be falling towards this level. In time I believe the S&P 500 will loose upside momentum and start to fall to its 39 week (9 month) MA, now at S&P 1011 but rising slowly. The surprise is that one almost never expects this to happen while the trend is at its upside extreme.
Yet history shows this is a perfectly normal correction and in many cases does not represent any immediate change in trend. Nevertheless they can be quite scary, so the adaptive channel concept can be helpful in anticipating the sudden change as well as providing targets to help one work around the volatility. One useful idea to keep in mind is that the target levels for the swing may be varying according to the adaptive nature of the calculations, however the percentage swing implied remains fairly constant.
So for the current data, a 12 to 13% swing to the downside is projected for the drop from the upper extreme of 1129 to the 39-week MA target of 1011. These two targets are likely to be modified by the way the near term trend evolves with regard to upcoming earnings and how they fit investor expectations. However since both targets will likely move together the 12% “swing” remains the target value from the high. So an implied downside shock of some 12% from eventual peak near term to a low near the 39 week MA in the S&P 500 is likely based on history and I think the natural consequence of the expired Ts in late 2003. …Terry Laundry
Short Range Volume Oscillator Ts
In this post I am introducing the Shortest Range Ts. These represent the most detailed use of the “natural” time symmetry property of equity trends that I discovered back in the 1970’s. However in this most detailed example of T Theory, the Cash Build Up Period is defined as the number of days that my Proprietary Volume Oscillator plotted in blue along the lower portion of the chart made a period of descending peaks. The declining green line in the Volume Oscillator plot represents this Cash Build Up Period. Click on Chart for larger image.
For the August centered T shown here, the Cash Build Up was 138 calendar days into the early August low. My so-called “Theory of Matched Trend Time “ says that the price of equities (represented by S&P 500 here) ought to rise from the center of the T to the projected right end date, which computes to Dec 22 2003. Note there was an earlier T at the March low but I have not sketched it in order to keep the focus on the current situation. It should be understood these Ts are sequentially being created to do their part in defining price trends, after which they pass into history. The key to the future use of this tool will be to find a new Cash Build Up Period in the blue Volume Oscillator that might be the left side of a new T.
The problem at this point in time is the same as for the BRKA T situation in my previous post. The BRKA T expired in late November but residual strength has persisted. The Current Short Range T refines the projected peak date to Dec 22, but residual strength still persists into January. This is not unusual and may be a seasonal effect or enthusiasm for the big earnings reports that will be announced in the days ahead. In any case I will be monitoring this chart perspective for those who have a need for this kind of short-term view. For the days ahead, it is only necessary to note the blue volume oscillator is locked into a persistently over-bought situation in which all Ts have expired their projected up trend and no new Cash Build Up looks possible in the Volume Oscillator. So my conclusion is that this very Short Range T Theory confirms the BRKA T analysis that equities are over-bought and by T Theory interpretation locked in a topping phase.
This short-term perspective is not a suitable on for general investment purposes in my opinion because it lacks the big picture perspective needs to make intelligent longer-term decisions. However a more comprehensive view of the same data will be present next week in a weekly view of this same data. Never the less this daily view is useful in the interpretation of any decline that brings the volume Oscillator down from its current Overbought condition to an Oversold condition. I will be updating this perspective at least every two weeks but additionally anytime the oscillator moves to an extreme where some sort of interesting situation might exist for a rebound, new T etc.
Next week I will introduce a much longer-term view of these same daily indicators. This perspective is more suitable for those of us that look at the longer investment trends. The conclusion is that equity’s are generally too high, although they could go somewhat higher. In any case, equities are not attractive until a significant correction occurs. This short-term perspective is best at monitoring such a correction and will be presented at least every two weeks or whenever any oversold condition is registered so as to clarify the T theory interpretation.
Finally I would point out these indicators are proprietary and I am not giving out any of the details. So don’t ask.
…Terry Laundry
Introduction to Price Ts
This Simple Price T Theory discussion makes use of Warren Buffett’s Berkshire Hathaway stock (BRKA) to construct elementary Ts. It introduces my initial 1973 discovery that certain simple equity price indicators of general market behavior do demonstrate a basic market principle; namely that prices rises tend to last only as many weeks (or months) as the prior period of price decline. This largely unrecognized property is at the very heart of T Theory so this introduction marks a good starting point for future discussions.
For this discussion I am presenting basic time symmetry concept in terms of super investor Warren Buffett’s main equity holding, Berkshire Hathaway, stock symbol BRKA, (or the lower priced companion BRKB) plotted here on a weekly basis. The chart is complements of BigCharts.com. I have, of course, added my T Theory concepts as notes to this chart. These simple equity price T constructions started out as a 1973 concept and were initially illustrated in the Dow Jones Transportation Average. During the 1949 to 1978 period these Transportation T constructions provided excellent insight to market timing and projections of peaks. By 1974 I concluded my discovery of this time was a powerful new Tool that deserved my full time attention. So in 1974 I abandoned my MIT Electrical Engineering roots and begin a new career in the investment world using this time symmetry as the basis for timing investments. Since then many new kinds of Ts were discovered but the Simple Price T constructions are the best beginning. Click on chart for a larger image.

Very early I decided these simple Ts looked to be very useful in the pre-1980 time period for investment management timing. At the same time I didn’t think that the Transportation Average represented the best area for growth. Railroads and Airlines didn’t seem to be the future so I made the important distinction between these Simple T time forecasts as indicators for the general market and growth investments that might follow. By the mid 1970’s I had replaced the Transport T with the Simple T’s constructed in the Value Line Unweighted Average. I will present these later. In 1975 it suggested the 6-year decline into the late 1974 low could result in a time matching 6-year year equity advance into a September 1980 peak. This proved profitable and reasonably accurate with the actual peak coming in the later 1980 early 1981 time period. The new bear market that followed into the August 1982 low to me proved the concepts validity.
By 1982 I had great confidence in this time symmetry concept but realized for the next bull market I needed to move on to more sophisticated kinds of Ts. I will also present these new kinds of Ts based on very long term momentum measures at a later date. These very long-range concepts eventually became my Long Range Dow Jones Industrial Average Mega-Ts. They did well into 1998 and the year 2000. The reason I had to abandon the Simple T concept during the 1980’ and 1990’s was because Simple T constructions are generally reliable only in sideway trading ranges. By 1982 I realized a different, more powerful type of T was possible in dynamic trends, and with the S&P Price to Earnings Ratio running at historic lows (P/E= 8 at the time), there was a real prospect for a momentum type of Mega-T to produce a great rally lasting some 16/18 years or so. This leap into very long term projections is somewhat risky and specialized so I will leave it for a future posting. However I will say it worked very well for that low valuation environment, but I know it would probably fail in today’s high P/E Ratio environment.
By the year 2000 I was sure that the current P/E Ratio for the S&P 500 benchmark of 30 time last 12 months earnings was so out of line with historical norms that the T Theory principle should be applied only to conservative sideways trends where normal value preferences might apply. This started me to think back to the Simple T analysis of the 1970’s. I eventually settled on these Berkshire Hathaway Ts above as the right way to look into the overvalued environment I believe it characterizes the post year 2000 speculative era in a saner way. The general reason for moving toward a Simple T construction is that in order to produce projections that are reliable and therefore helpful in management, the particular index selected must be viable from a long-term viability standpoint, and be both attractive and representative of mainstream investing trends. The Transport Average met this investment criteria some 30 years ago when transportation issues was viewed as critical to economic growth. For the new period I selected Warren Buffett’s investment portfolio, BRKA, based on his long and very consistent record using a value approach to investing, which I believe makes more sense in today’s speculative, over-valued, and in my opinion speculative environment.
As noted in the chart, the rise out of the early 2003 low came after a prior decline of 39 weeks. All Ts are defined by the duration of the descending peaks pattern either in price for this kind of Price T or for declining peaks in momentum in more advanced kinds of so-called Oscillator Ts. This period of descending peaks is termed the T’s Cash Build Up (BU) period because it is assumed that during this period money normally earmarked for stock purchase is withheld, perhaps as cash. Once this Cash BU trend is reversed at the Ts center date, T Theory simply assumes this pent up demand will fuel a rally in price that lasts only for an equal period of time. So T Theory essentially claims the completion of the 39-week price decline early last year ought to produce a time matching a 39-week price rise which projects upside exhaustion around late November.
For convenience, I decided to label the successive Ts by their approximate center dates and equity types so each of the Ts can be identified for reference. So for example I can make reference to the Sept 2001 BRKA T to identify the middle T or I can speak about the 1974 Value Line Unweighted T knowing it is reasonably clear the particular T example to which I am referring. This is key because I have so many different types of Ts.
Before delving into the more practical inferences of this basic time symmetry I should point out that the placement of the T’s center date varies according to the nature of the bottom price formation. In the 1970’s the Transport Ts that I discovered had quite accurate projections that could be made when the bottom pattern near the center post of the T took the form of a “W” shaped double bottom, However these projections were reliable only if the Cash Build Up definition split the time of the twin price lows. This placement does not appear in the BRKA Ts above because their price formations have a single low, more in the nature of a single “V” shaped low near their center dates.
This distinction between “V” and “W” shaped lows is technically important for certain situations, particularly for the big Gold Bullion picture in my previous discussion. In a later report I will use these simple T constructions with their typical gold “W” twin price lows to refine the current rally’s upside projection for 2004. I will not get to this discussion for a few weeks but I can say the upside projection is not scheduled to peak by these simple T projections until later this year. The current gold vacillations are probably just a product of the ongoing 8-month cycle and should pass without serious damage.
Moving onto the current equity market we see the latest BRKA T calling for a late November peak ideally. But from a practical standpoint, its projection is being over run by the strong upside momentum. This is not an unusual event. The time symmetry, which defines these Ts, has persisted for many decades and has had to fight many momentum battles. In weak trend conditions, the projected upside exhaustion dates which should be peaks for price have come early. In unusually strong trends the peaks have arrived after some delay. The important point to remember is that any new T, which you might reasonably imagine, has to have a properly defined Cash Build Up period and none is possible at this time.
The present conflict has traditionally been resolved as a technical battle between the persisting upside momentum and the T’s attempt to exhaust the uptrend at the matching time projection. It is typically resolved by an evolving trading range. The sideways trend may have an upside bias but it usually becomes more volatile to the downside as the competing forces cause prices to move into the next Cash Build Up period. Very sharp declines are possible as the upside momentum is lost, so complacency during this period is not warranted.
Next week I will detail a more refined concept to deal with this conflict but the ultimate resolution isn’t likely to change. The market should be moving into an increasingly volatile, choppy trading range during the weeks ahead. …Terry laundry
****************************************************************************************
All Rights Reserved By The T Theory® Foundation ©
Order the T Theory® Encyclopedia
For a complete understanding of the T Theory® and how to successfully use Terry’s unique methods, order the Encyclopedia from Paula at the above link. There is additional material in the encyclopedia not covered here. Paula will be more than happy to answer your questions too.
Many thanks to Paula Burke for her permission to re-post Terry’s old T Theory® explanations. The period re-blogged on these pages are some of Terry Laundry’s best work and was published here from public domain.
****************************************************************************************
I take NO CREDIT for the material found under T Theory® on this blog. All of this material is the creation of Terry Laundry and was downloaded from Terry’s free blog site.
The page content re-blogged here is exactly as Terry created on his original webpage. Nothing has been left out from the period Dec 2003 to June 2011. From Terry’s site, I made a lot of formatting changes, creating a more easily readable webpage appearance. The PDF chart duplicates of the JPEGs have been omitted for ease and speed of recreating Terry’s pages. References to PDF charts should be ignored (no chart was left out).
After June 2011, Terry created a paid subscription website. None of that material is found here.
There were many many, many hours spent downloading Terry’s material, uploading charts and audio to WordPress, followed by inserting the uploaded material into my webpages. This was a dull and arduous project and I hope you enjoy it. I don’t believe there is any material in free domain left to publish, so my T Theory® project is probably finished.
If you find an upload reference error, please note the title of the webpage and the exact name of the audio or chart that is in error. Leave a comment for me with info and I’ll fix it.
Terry’s material is very long and will take many, many days for you to finish. Don’t hurry, it’s not a marathon and you will absorb more if you go at a reasonable rate. This is especially true for those who don’t invest in the T Theory® reference encyclopedia. The encyclopedia is a written reference for T Theory®. It also includes new information never seen on his website.
You are welcome to save all of my blog material to your computer. You also have my permission to re-blog my information, but you must (1) credit me and my blog and (2) don’t change the material.
FYI – I find the best way to save a webpage is using “ScrapBook” (add-on for FireFox). ScrapBook saves a webpage to your computer EXACTLY as it appears on the day you save. You can’t tell the difference between the internet webpage and your ScrapBook saved page. The saved pages are not pictures but html and functionality is identical. There is also an optional method for using ScrapBook where you can save webpages to a certain link depth (which will include pictures, sounds or movies). This optional method means all links will function on your computer to the link depth specified. You can also filter the pages saved, excluding all pages not coming directly from the specified website (recommended).
****************************************************************************************
All Rights Reserved By The T Theory® Foundation ©
Order the T Theory® Encyclopedia
For a complete understanding of the T Theory® and how to successfully use Terry’s unique methods, order the Encyclopedia from Paula at the above link. There is additional material in the encyclopedia not covered here. Paula will be more than happy to answer your questions too.
Many thanks to Paula Burke for her permission to re-post Terry’s old T Theory® explanations. The period re-blogged on these pages are some of Terry Laundry’s best work and was published here from public domain.
****************************************************************************************
I claim no credit for the material found under T Theory® on this blog. All of this material is the creation of Terry Laundry and was downloaded from Terry’s free blog site (TypePad). I have created a mirror of Terry’s original material and now there is a second site containing Terry’s T Theory®. One or both of these websites hopefully will survive through time as Terry’s material is too important to be lost to the ravages of time. This site is simply a memorial to his lifetime work.
The page content re-blogged here is exactly as Terry created on his original webpages (saved on my computer with ScrapBook)). Nothing has been left out from the period Dec 2003 to June 2011. From Terry’s site, I made a lot of formatting changes, creating a more easily readable webpage appearance. The PDF chart duplicates of the JPEGs have been omitted for ease and speed of recreating Terry’s pages. References to PDF charts should be ignored (but no chart was left out).
After June 2011, Terry created a paid subscription website. None of that material is found here.
There were many many, many hours spent on this project; downloading Terry’s individual charts & audio files, followed by the uploading of Terry’s charts and audio to my WordPress blog library, after which I had to insert the uploaded material into my new T Theory® webpages (hopefully in the correct places). This was a dull and arduous project and I hope you enjoy it. I don’t believe there remains any more of Terry’s material in free domain, so my T Theory® project is probably finished. If I’ve missed something, you can leave me a comment.
If you find an uploaded reference error (chart or audio in the wrong place), please note the month and year of the webpage, plus the exact name of the referenced error file. Include any other info that will help me locate the problem file and where it occurs on the webpage. Leave a comment for me with the info and I’ll fix it.
Terry’s material is very long and will take many weeks for you to finish. Don’t hurry, it’s not a marathon and you will absorb more if you go through it at a reasonable rate. This is especially true for those who don’t invest in the T Theory® reference encyclopedia. The encyclopedia is a written reference for T Theory® and includes everything of importance for Terry’s T Theory®. Without the reference encyclopedia you must depend on your memory and Terry’s method carries some rules that you could easily violate. The encyclopedia also includes new information never seen on his website.
You are welcome to save any or all of my blog material to your computer. You also have my permission to re-blog my information, but you must (1) credit me and my blog in an obvious manner and (2) don’t change my material.
FYI – I find the best way to save a webpage is using “ScrapBook” (it’s an add-on for the FireFox browser). ScrapBook saves a webpage to your computer EXACTLY as it appears on the day you saved it. You can’t tell the difference between the internet webpage and your ScrapBook saved webpage. The saved pages are not pictures. Instead the pages consist of HTML and page functionality remains identical on your computer. There is also a second method for using ScrapBook, where you can save all of the webpages down to a defined link depth. This optional method means all links will function on your computer to the link depth specified (meaning you can click on links on your saved webpages and tunnel down into pages within pages). Saving the normal way will only save the top webpage but the links that exist could continue to function by taking you to the website on the internet instead of on your computer. But sometimes the linked website doesn’t exist anymore. I’ve had this happen on some very good webpages with unique information (they just disappear into the internet void). That’s a bummer when you lost some really good info and thus rose my need for ScrapBook. You can also filter the pages saved using the optional ScrapBook method, which can exclude all pages not coming directly from the specified website (filtering is recommended using this method otherwise you wind up with a LOT of useless stuff).
.
Explore posts in the same categories: . . . T Theory®
Leave A Reply