02/14/12 – Down, Sideways, Up? + My First Computer & Apple Stock © ™

************************************************************************************
BLAH, BLAH, BLAH
This is a really long update as it grew out of control like wildfire. I hope you enjoy reading it as I digressed far from the target message. Besides I’m old and allowed to digress. Next step in my age progression is to have a cane, talk incoherently to myself as I cross the street, and then beat the hell out of a car that’s too close to me while I’m in the crosswalk. I actually saw this exact incident happen in front of one of my Taco Bells in the 1980s. I laughed so hard I almost wet my pants. Crotchety old men are allowed literary and eccentric license and I’ve got the literary license today. I’ve had the eccentric license since I was a teenager.
If you aren’t interested in what a nerd I was (am) and how I became a brain-washed Apple borg collective, scroll down to “What’s Happening”. This doesn’t have anything to do with the stock market but it does tie into Apple stock and their computers.
All in all, this gives you a little background on the fearless, nutty goof-ball nerd that’s writing this blog. In my old age I’ve become relatively conservative (compared with earlier decades). Of course I realize that conservative is a relative concept. What’s conservative to me is certainly wacko to someone else. To each their own because that’s what makes the world interesting.
MY FIRST PERSONAL COMPUTER IN 1977
I built my first computer from a kit in 1977. That’s right, I assembled it with my trusty soldering iron and a whole lot of time and patience. This was 4 years before the introduction of the IBM PC in 1981. Personal computers were just beginning with some of the key nerds of that time, people like Bill Gates, Steve Jobs and Woz. Too bad I never hooked up with any of them but I wasn’t in the right place at the right time.
The 1977 computer I built was a Cromemco with a Z-80 CPU, 4 memory cards of 16K RAM each (total of 64K), 5 1/4″ floppy disk drive with 91K capacity (does anybody realize how small these figures are by today’s standards???), a Hazeltine smart terminal and a Digital Equipment DecWriter printer. The Cromemco was really cutting edge stuff at the time featuring many of the same components found on mainframe computers.
My Cromemco computer had only 1 floppy disk drive as I didn’t see any need for a second floppy drive (that was short-sighted of me). A hard disk drive was too expensive that only mainframe computers had them. It was two computers later before I had a hard disk drive. The Cromemco came in a big ugly black case that was large and heavy (13″ high x 20″ wide x 26″ deep and 36 lbs).
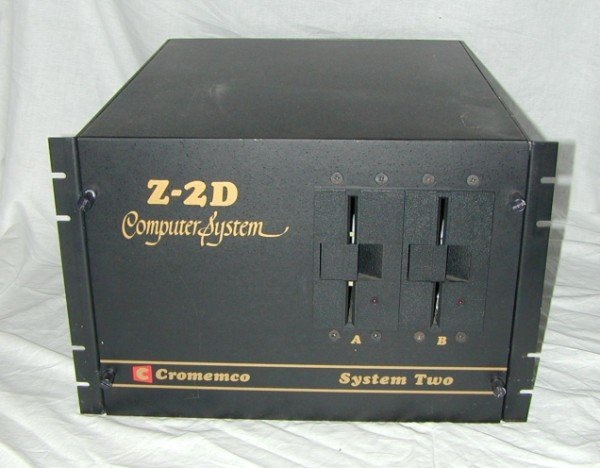
Z-2D – not a picture of my computer
It had 21 slots for the S-100 buss (that’s was really overkill). This computer continued to serve me well until I decided to buy a PC clone in 1983 . I spent over $4,000 on the Cromemco, which included peripherals. Each of the four 16K memory cards cost me $500. Today a 16K chip (not a board, a chip) would cost about a buck. I doubt if you can buy a 16K memory chip anymore (insignificantly small capacity).
That $4,000 price tag in 1977 translates into $15,500 in today’s dollars. That shows the tremendous progress they’ve made in cheaper computers.
In 1977, there was no software available except the language that was used to program the computer (BASIC). All of the software had to be custom written by yours truly. To make things really challenging I didn’t know how to write a computer program, in fact I knew nothing about computers other than the fact that I wanted one. It would have been very helpful if I had taken a computer programming course in college but that never happened. I was a physics major and never had time for such things. Needless to say I was fearless in my approach and believed that I could teach myself how to do anything, just give me a good text book and a little time (that system worked in college as I never went to class).
Eventually I sat down with my newly completed computer, a lot of programing books and spent 6 straight months (day and night) glued to the keyboard until the first program was finished. In those days the existing computer programing books were not very complete or instructive. They pretty much expected you to understand basic things about programing. They couldn’t have been more wrong in their assumption. Primarily the books were sorely lacking in explaining syntax command structure. For those unfamiliar with computer programing, correct syntax is paramount when giving instructions to a computer. Without correct syntax, the computer can’t understand the simplest command. Consequently, I spent a LOT of time using trial and error to find the correct syntax structure. I kept this up until each command functioned properly. After that it was simply a matter of putting it all together in a structured program that the computer would execute. Yeah it was a real piece of cake if you didn’t mind putting 100 hours per week into it. It’s a good thing I had good managers in my 3 Taco Bell restaurants because I was mostly absent from the business.
The first program completed was a profit and loss statement for the Taco Bell restaurants. After that came a payroll check writing program, which was followed by the payroll report programs, which were due quarterly and yearly for both the state and federal government. What a time saver it was. I spent about a solid year writing these programs so that I could save a whopping 2 or 3 hours each month doing tedious business activities. It really was a great challenge and I triumphed in the end but I would never come close to recovering the time that I had spent writing these programs. But there was a side benefit because it did lead to some discoveries that were unanticipated in the stock market.
My wife didn’t divorce me, but my life was threaten on many occasions. I also wore two holes in the carpet from rocking the chair back on 2 legs as I was prone to do when lost in thought. I spent a huge amount of time with that chair rocked back on two legs, hence the vaporized carpeting spots. Programing is 90% thought and 10% typing commands.
The following picture is a page from a magazine advertising the Cromemco computer in 1977. By assembling the computer from a kit I saved about $600. The assembly procedure required me to solder every electrical component to the printed circuit boards. My 13 year old daughter helped me and she was a really big help too. She was fascinated by this enormous task that I had undertaken, but she also knew her father was nuts.
Here are the two issues of Popular Electronics that started the nerds thinking about computers.
Popular Electronics January 1975 – Birth of the PC
PopularElectronics Feb 1975 Altair 2
CLICK ON ANY PICTURE OR CHART TO ENLARGE

Cromemco Computer, Z-2D (my computer only had 1 disk drive)
Following is a picture of the monitor that I used (smart terminal monitor). It had characters that were displayed in dots and was really hard on the eyes. None of these pictures are of my original equipment, they are representative of exactly what I had. The picture of the Hazeltine monitor below is sitting on what looks like an old Altair computer. No programing on the Altair computer was possible other than the switches that you threw on the front panel. Now that was limited and archaic even for 1977. There were also computers that had cassette tape drives, just like the ones used by the music industry. The large open reel tape drives (seen on large main frame computers) were excellent. But the cassettes were prone to recording unreliable computer instructions and that never interested me. They were just cheap junk and were on low end machines never intended for business use..

Hazeltine 1500 Montior & Terminal
This DecWriter printer below was so clatteringly loud that I installed it in a closet and kept the door closed. It was a dot matrix printer (remember them???) and printed at the blazing speed of 30 characters per second. That may sound fast but it took several minutes to print one page. Today my laser printer will churn out 12 pages per minute. I also had a 300 baud telephone modem for dial-up connection to outside computers. 300 baud is about 30 characters per second and it was agonizingly slow.

DecWriter Printer (dot matrix, 30 cps)
One day I had a eureka moment. With a computer I thought I could undertake a lot of studies of the stock market that I never thought possible, plus I could program it to print charts. Here I went again, spending endless hours in front of the computer creating new programs. I was in so much trouble with my wife because I practically didn’t exist in the family anymore. I was just this blob that said “huh” to everything. Also, “Just tell me when dinner is ready and I’ll come”. “Yeah sure, get it yourself”. “Chrissi and I are going out to eat”. And so it went. She eventually murdered me, disposed of the body in the desert and I was replaced with a look-alike android that paid her more attention. Androids were really expensive in those days.
Truthfully I was really lucky that I had an understanding wife as a lot of women would have really unloaded on me and I would have certainly deserved it.
With my new computer I kept thinking of more and more things to analyze that I would NEVER attempt by hand, things too tedious, long and prone to many errors. On and on it went with more and more creations involving the stock market. Most of these programs didn’t lead anywhere but they answered questions.
In 1981 when the IBM PC came out, I was unimpressed by it but a couple of year later I did buy a PC clone with lots of bells and whistles that were lacking on the IBM. For the first time there was now software available for this useless pile of semiconductors called a computer. Computers are really nothing more than a large doorstop without the software. The Apple computer preceded the IBM PC but it had very, very little software available and this would remain true for a very long time. I vowed that there was no way I would ever buy an Apple computer because software is the heart and soul of a computer. When the original Mac came out, it did look interesting if you were into desktop publishing or something similar that involved graphics. My continuing direction was towards custom financial software that I wrote myself for my business and stock market analysis. There was nothing Apple had to offer that interested me. And so it continued for literally decades.
Then one day I noticed that Apple was adopting the same Intel processor that the PC was using. Hmmmm, that’s interesting but it was still useless from a PC software point of view. But wait, Apple introduced “Bootcamp”, a method of booting your Apple iMac up into Microsoft Windows. Suddenly I was interested in an Apple computer because you had an Apple iMac plus a Windows PC rolled up into one machine. This sounded pretty good, I could use my Windows software on an Apple plus Apple had made great strides in introducing their own software and often it was easier and more reliable to operate than its Windows counterpart.
Not long after Bootcamp’s introduction (2008) I went to my local Apple store and fell in love with an iMac. I bought it and proceeded to use it for my Windows applications and also Apple applications. Things were so good that after a year I had almost completely abandoned my Windows software. Better still, the iMac operating system was so stable that I never saw the blue screen of death or its related Apple counterpart (does it exist???). No rebooting because things froze up or whatever else that might go wrong with PCs. I now started talking to friends about my Apple computer and how they had to buy one too. I was the proud owner of an iMac and had become a full fledged member of the Apple club. These were unbelievable words coming from my month, an avowed hater of Apple computers. A year later I bought a MacBook Pro (laptop) and was now a two computer owner of Apple products. My Apple brainwashing was almost complete and evidently I was turning into a mindless Apple borg collective member.
The Amazon Kindle came out and I had to have one, loved it but it didn’t do some things that I would like to see done by a small device like this. Boom, Apple announces the iPad and it does everything the Kindle does and LOTS more. I quickly sold my Kindle on eBay before the iPad was introduced and Kindle prices dropped because the world was going to wake up one day and realize that the Kindle wasn’t up to the job and expendable. I bought my iPad on the second day they were available (Monday after Easter 2010). I was now a 3 computer owner of Apple products. It’s official, I was now an Apple zombie, “me want more Apples”.
And here we are at present day, awaiting the arrival of the iPad 3. I will be buying an iPad 3 because I want the new features so widely rumored. I theorize that there are a LOT of other people that are thinking exactly like myself. They have an iPad 1 and want to trade up because the new features will be too advanced to pass up. Try to find an unhappy iPad owner. They “almost” don’t exist.
Now I don’t participate in first day activities with all the Apple devotees who can be a little bit crazy with their borg-type devotion. But I think it’s highly likely that the iPad 3 demand will exhaust the available supply on the first day . Second day buyers and beyond will be left with nothing but an order to be filled at a later date. On black Friday (Friday after Thanksgiving) the iPhone 4S was sold out throughout the country. There is obviously precedent for huge demand overwhelming supply. With this in mind, I must become part of the day one problems but I won’t be part of the opening craziness. I’ll be there about 2 hours after the open when the opening crazy rush is mostly finished (I hope its finished). It seems likely that there should be iPads available throughout most of day one. Hopefully that better not be wishful thinking or I’ll be standing in line waiting for nothing (yuk).
MUSING ABOUT APPLE
With all of this in mind, it seems extremely likely that Apple will have another blowout quarter of earnings propelled by the iPhone 4S and the new iPad 3. Apple’s guidance for the first quarter of 2012 was well above analyst’s expectations and that never happens. Apple ALWAYS predicts very conservative numbers that are easy for them to hit. So first and second quarters are very likely going to be sensational. Earnings for 2012 should be nothing short of spectacular. Apple TV (the actual televisions made by Apple) are rumored to also be coming in 2012. These will be top of the line televisions that you will speak commands (Siri) and they will do everything you want with no remotes cluttering your tables. The downside of these TVs will be price but as usual everything Apple makes is first rate and not the cheapest when compared to others. Apple has no peers when you compare features, only competitors that try to catch up and mimic last year’s Apple product and never quite catching up to Apple.
The stock price of Apple has had a very nice run since its consolidation around the $350-$360 level during the 4th quarter of 2011. The recent run up of about 150 points (over $500 presently) from $350 has been prompted by much better earnings than anticipated during the 4th quarter. This was caused by the blowout sales figures for the iPhone 4S plus the recent and long awaited announcement that the iPad 3 will be unveiled during the first week in March.
Apple now has 100 billion dollars in cash. That’s a lot of money. I think Apple’s new price over $500 per share makes Apple the most valuable company in the world eclipsing Exxon. I think it’s very likely that Apple will begin paying a dividend this year. Apple could pay a 4% dividend and still increase their cash reserves. A more likely figure for a beginning dividend is something on the order of 2% per year. Steve Jobs was never in favor of paying a dividend but Cook is amendable. One of the problems that Apple has is that many institutions have hit their limit on the amount of stock they can hold in a single company (Apple). This fact by itself limits severely the buying power available for Apple stock. If Apple begins paying a dividend a lot of institutions that can’t buy Apple due to no dividend payout will look favorably towards buying the stock. That’s new buying power plus a lot of individual investors will look favorably at Apple that passed before due to no dividend. Apple has all this money and uses a very small amount of it for acquisitions. It’s very strange. What did Steve Jobs have in mind by accumulating all this money???? It’s a mystery to me. Maybe he just wanted to see how much money he could accumulate before he passed.
A few recent comments about Apple’s money:
“Apple is not exactly hurting for cash; Cupertino revealed last month that it’s sitting on approximately $97.6 billion. But rather than burning those funds on acquisitions, half-baked technology, or iPads for all, Apple chief Tim Cook insisted Tuesday that the company is very practical about its money.
“We spend our money like it’s our last penny,” Cook said at Tuesday’s Goldman Sachs Technology and Internet Conference. “We’re judicious, we’re deliberate.”
Apple shareholders “don’t want us to act like we’re rich,” Cook continued. “That may sound bizarre, but it’s the truth.”
That being said, Apple isn’t just lounging in piles of gold coins Scrooge McDuck-style. Cook said Apple has spent billions on its supply chain, acquisitions, intellectual property (sorry, Samsung), infrastructure, and retail stores.
“But yes, we still have a lot [of money],” Cook conceded.
So what is Apple going to do with all this cash? “It is being discussed more now and in greater detail,” he said. “I’d be the first to admit, we have more cash than we need to run the business on a daily basis. And so we’re actively discussing it. I only ask for a bit of patience so we can do this in a very deliberate way and make the best decision for the shareholders.”
“Cook said the late Steve Jobs “drilled in all of us [that] we should stay extremely focused on a few things rather than try to do so many that we did nothing well.” But it’s clear that Apple has the desire the means to branch out at least a little in the years to come.”
One of the remarkable features of Apple stock is that it’s currently selling at 14 times trailing earnings and probably selling around 9 times forward earnings. This is EXTREMELY low valuation for a stock that is growing at double digit rates every quarter for years. As I said, the buying power is limited in this stock and that “may” be one of the reason why it is valued so low. There is probably a lingering feeling that with Steve Jobs gone, Apple will turn into tomorrow’s wasteland. The fact is that Steve left many, many years of projects in the pipeline. Also the entire mindset has changed at Apple (thanks to Steve), they now think differently than any other company. They aren’t followers like Microsoft and others like Samsung who is busy stealing Apple’s patents. Apple is now the leader of the pack and they think like winners. Another reason for a low valuation is the nagging fear that another recession/depression is coming. Most people view Apple as a technology company, which they are, but they are more correctly thought of as a end product consumer oriented stock. As the consumer pulls back in their buying habits, the thought is that Apple has to suffer also. The problem with that thinking is it hasn’t been true in the past. For instance when the economy went into a slowdown in mid-2011, Apple rolled right along at high speed. Apple’s uniqueness keeps their sales going when others are suffering. If the day comes when Apple loses their edge, the PE ratio that they carry presently will become reasonable but until that happens they will continue to surprise all of the naysayers.
Have you wanted to buy Apple but you kept waiting for a meaningful correction??? Yup, you and millions of other people are in that category. If you look at the charts for Apple in MY CHART LINK , page 31, you’ll find that Apple has a history of declining down to the peak of a prior high. It has done this repeatedly. For instance, 2007 to 2009, Apple declined from slightly over $200 to approximately $80. The $80 level was the peak made in 2006 followed by a small correction. This correction was followed by Apple’s almost uninterrupted run to the $200 level. If we had a large recessionary correction in the market at this time, I would expect in a worst case scenario that Apple would correct from the $500 level to $200 (2007 peak price). More than likely it would stop at one of the other peaks like the $360 level made during 2011. So watch those peaks for future support levels should Apple come under attack.
But I don’t really expect much in the way of a correction as long as the economy holds up. The economies strength is surprising a lot of people as many are still predicting a recession in 2012. But a lateral correction may be the worst that we will get until something very unexpected takes place (black swan event).
In the growth stock section of my charts (Apple, page 31), I have just added moving average lines, purple and gold. These are called the “Guppy Multiple Moving Averages”. You can read these chart lines using the tactics outlined below. These lines form an easily seen visual oscillator. Extreme points in the moving averages produce the same extremes in the oscillators that appear on each chart. This makes it easy to quickly follow overbought and oversold points of reference.
The “Guppy Multiple Moving Average” has the following features (see below chart for an example of Guppy Lines):
TACTICS
- Join established trends at points of price weakness
- Join established trends breaking to new highs
- Trade breakouts using rally dips and rebounds
- Trade downtrend rallies as rallies rather than trend breaks
- Recognize trend breaks as they develop
RULES
- Degree and nature of separation in the long term group define trend strength and weakness
- Degree and nature of separation in the short term group define the nature of trading activity.
- Degree and nature of separation between the two groups of moving averages define the character of the trend.
- Compression shows agreement on price and value.
- Compression of both groups at the same time indicate major re-evaluation of stock and potential for a trend change
- Trade in the direction of the long term group of averages
- The relationships between the groups provide the necessary information about the nature and character of the trend.
- Do not use as a moving average crossover tool
ADVANTAGES
- Enables effective analysis of the trend environment
- Improves selection of the appropriate trading tactics
- Better understanding of trend strength
- Effective evaluation of unusual price movements, such as dips and spikes
- Effective understanding of trading activity and behavior
DISADVANTAGES
- Not effectively applied to trend less stocks
- Cannot be applied to all trending stocks
- Do not use as a moving average crossover signal
Apple stock chart from page 31 (daily view for the last 18 months).

Wow and I had only intended to say a few words about Apple. Once I get started I don’t know when to shut up. But now you know the rest of the story.
WHAT’S HAPPENING?
I haven’t issued a sell signal recently and don’t expect to do so anytime in the immediate future. We’re going to ride the wave until the saw-tooth develops or I get too hyper to sit still any longer (it happens).
In one of the mechanical signal methods used on page 1 of my chart link, chart number 10.8, we are very close to a sell signal. With paper profits of about 100 points in the SP 500, this method is going to have a very good trade for its first transaction of 2012. In the real world of my interpretations, I believe that we could have one more upthrust with new recovery highs before a correction takes place. Until that happens, we may not see any real signs of a correction but I’m receptive to a correction beginning at any moment. I still believe that my “no more buying” was the correct move but it may not be readily apparent for another week or two. If the correction comes, I will issue a renewed buy signal at the conclusion of the correction. I have had several qualified buy signals in recent months (since Oct 4th).
We have had an irregular market since my last “don’t buy” update. We aren’t really going down, more of a sideways to up market depending on what index you are watching. Tuesday I thought we were going to start something but it aborted at the end of the trading day and traded back up to close little changed for the day. I had gone short early Tuesday morning and closed it out after the small 3 step down showed a little too much life on the upside for me. Made a little money but its a risky trade and I very definitely don’t recommend that sane people trade against the larger trend. It’s one of those axioms, don’t trade against the larger trend. It’s very sound advice but I’m a little crazy (not as bad as I used to be) and hence the risky short position taken early in the day. It could have very easily gone against me and I would have lost money.
John Murphy has turned a bit cautious as he commented on Tuesday:
“It seems reasonable to expect that an eventual upside breakout by the stock market will start to pull commodity prices higher. [Historically, stock prices have usually turned up before commodities]. In the meantime, however, relative weakness in commodity prices may be hinting that the stock rally is overdone.”
“I’ve written a couple of recent messages explaining the importance of Canada in the global intermarket picture. That’s why I remain focused in the inability of Canadian stocks to clear their November high and 200-day moving average as shown in Chart 4. Its short-term trend also appears to be weakening a bit. The 14-day RSI line is in danger of slipping below the 50 level, while the daily MACD lines have turned negative. Any weakness in Canadian stocks would make U.S. stocks more vulnerable to short-term profit-taking. That’s because the two neighboring markets are usually closely correlated. The inability of the CDW to breakout to the upside may also be helping to keep a lid on commodity prices.”
I have been establishing a new position in a stock (a stock???). I do own a few but I normally buy/sell SP 500 futures contracts and roll them over as they expire for any longer term holding periods. The stock that I have been slowly buying is Linn Energy (LINE). It’s considered a long term holding and I’m tranching in as a conservative entry point. The current price has a dividend payout of 7.7%. I had already mentioned LINE in my last comments and won’t bother to say anymore.
Meanwhile I had said that I would get back on board when the Nasdaq Composite resumed its relative strength. It has resumed its strong relative strength position but I I lied because I haven’t given an all clear for buying. The COMPQ has resumed an irregular higher move but once again it has showed a topping formation over the last four days, which was destroyed on Wednesday. It did this before when I warned of not buying and that also proved to be a false alarm in the Composite Index. I’m going to be conservative and not put the buy flag out yet. Any one who is nutty enough to listen to me in the past should have bought a long time ago and should only have been adding to these positions with new money as it became available. Right now the bank is where the new money belongs.
It’s possible that we may get one more push into new recovery ground before a correction begins. The chart below shows that we have completed 2 steps up (red 2 at top right) since December 19th. When the 3rd step up is completed, we can correct. Overall, we are only in a larger 2nd step up (black 2 of 2) since the October 4th bottom. 1st step up (blue 1) ended in late October. Since then we have been in a larger step up (blue 2 not seen on this chart). If the count is correct, we have much further to go before the final top. That top will end the bull market, which began in March 2009.
Did your eyes glaze over with that last paragraph??? Don’t worry, everybody always says, “huh” . . . what did you just say???? I think the concept is simple but explaining it in words is difficult and completely BS to understand. It’s one of those, a picture is worth a thousand words.
The minutes from the most recent FED meeting have just been released today and the stock market was unimpressed and selling off. Maybe the correction has begun. I have seen so many false starts in recent days that we have to wait and see. This market has been impressive on the upside with high persistence and continuing momentum.

2011-02-14 INDU DAILY
The Nasdaq Composite index burst through the upper red circle today (Wednesday). These topping formations seem to be built so they can be destroyed quickly. We are continuing to enjoy the ride but all new buying is deferred for the moment.

2011-02-14 COMPQ 5 MINUTE
The semiconductor index is showing poor relative strength and is often an early indicator of market turns. It clearly shows two steps down but in an eager bull market, we often only have two steps down with a truncated third step. That may be possibly indicated here and a higher high than 5 days ago will prove that case.

2011-02-14 SOX 5 MINUTE
The technology index stocks are showing good strength with a new recovery high today. That is certainly not an indication of any corrective type action. This index has been in a solid uptrend since the December 20th bottom.

2011-02-14 TXX 5 MINUTE
The banks (BKX) and the securities broker/dealer index have been acting poorly but show 3 completed steps down. If true, this indicates a good rally is forthcoming in these indexes. The only monkey wrench would be a 4th & 5th steps down, but with the underlying strength in the overall market, that doesn’t seem likely.

2011-02-14 BKX AND XBD 5 MINUTE
The Russell 2000 index (RUT) has been declining for several days, but today formed a higher low and all that is needed is for a higher high than Monday’s close. If today’s late rally carries over into tomorrow, we could easily best the Monday close.

2011-02-14 RUT 5 MINUTE
The SP 500 (SPX) has been going nowhere for the last week, but if you look closely at this chart you will see a reverse head and shoulders formation (bullish formation). The left shoulder is last Thursday, the head is Friday and the right shoulder is today. A break of the neckline (the highs across the top of this chart) would validate this formation and call for a move upward of 17 points above the neckline at approximately 1354. A target would be about 1371, which is precisely at the level of the May 2011 high.

2011-02-14 SPX 5 MINUTE
The DJ Transports have been in a downtrend for more than a week. The late rally today did very little to change that outlook.

2011-02-14 TRAN 5 MINUTE
A longer view of the Canadian blue chip index (TSX) has formed a double top and declined since the second peak. I would count this as somewhere in the second step down, where the first step down was between the double tops. Second step down began immediately after the second peak. I like watching the TSX as it has less “noise” than some of the American indexes. Institutions of all sorts have a temporary distorting effect on the American indexes. Consequently the distortions can make counting steps more difficult in some of the indexes. This is the reason why I have 10 indexes on each page with the same chart period. The hope is that one of these indexes will have a clear picture of what’s happening. Frequently that’s true but when its not, my life becomes more difficult.

2011-02-14 TSX 15 MINUTE
The 30 minute TSX chart shows exactly what has happened since the December 19th bottom. This index formed a bottom on December 15th. Nice leading motion by the index showing the way for the bottom on the 19th. You can see that the index counts very nicely since the December bottom with an obvious channel break taking place since the first peak on January 26th. The red Fibonacci levels indicate possible stopping points on the way down. Any correction that turns up before it makes it to the 38% level must be deemed strong and eager to go up. We’ll see what happens here, but I could make a case for a 3 step down since the second peak on February 3rd.

2011-02-14 TSX 30 MINUTE
Notice the nice channel that has formed since the December bottom (blue dotted lines). We also have in red, the speedlines based on earlier market action that shows the most recent peak in this index taking place precisely on one of the speedlines. This is not an infrequent occurrence when you have a valid speedline.

2011-02-14 COMPQ 30 MINUTE
This index illustrates the strong and well confined channel that has been in effect since the December 19th bottom. Counting the steps in this index is not clear and is a perfect example of an extended uptrend where counting the steps has become next to impossible in real-time. This is where the channel break tells you when the step has ended. My theory is that when you lose track of the steps on the up or downside, the market move is an extended primary move. Counting the steps will be a lot easier when the channel break takes place, but for now we rely on the channel break, which doesn’t exist yet.

2011-02-14 TXX 30 MINUTE
The next chart which is for the same time period as the TXX chart above is the banks (BKX) and securites broker/dealers (XBD) and it shows a rather clear 3 steps up since the December 19th bottom. A perfect example of why I have 10 indexes on each page for the same chart period (30 minutes).

2011-02-14 BKX & XBD 30 MINUTE
A lot of people have become more bullish in recent weeks and that often precedes a temporary reversal, but this indicator is notoriously wrong in the later stages of a bull market. The period leading up to the 2000 bull market peak was an excellent example of rampant bullish behavior but no correction until the market had expended the buying power available. When there is no one left to buy because everyone has spent their money, you are only left with sellers.
I remain in an “overall” uptrend theme as per previous updates. That means zig-zag not straight lines.
Told you this was a windy comment. I can really bore the crap out of you if I start talking about the stock market. But I have learned to restrain myself because nobody loves this stuff like I do. Talk about it for a couple of minutes and then stop. If they want to continue the conversation, they’ll tell me. But you guys are a captive audience (maniacal laugh here). Only in 1999 did everyone want to talk about the stock market and I was telling them to sell, not what they wanted to hear. Also nobody wants to buy when there is blood in the streets and nobody wants to sell when everything is so good that making money in the stock market is a sure thing. I always like to say “Don’t confuse genius with a bull market”. Nobody understood that in 1999 and they thought they had learned more in a short time than I had since 1957 (they were thinking this guy is really dumb!). I have made peace with this attitude and always expect it. I don’t even say later, “I told you so”. Usually the person will say it for me.
Never forget that the driving force in the stock market is emotions and those primary thoughts are “fear, hope and greed” as displayed in the following chart.

Fear, Hope, and Greed
CHARTS
- These are my personal charts and my playground for doodling trend lines, wave counts and other ideas.
- I draw the trend lines and wave counts on a daily basis (sometimes more often). You can find these doodles from 1 minute to monthly charts.
- I usually restrict my trend lines and wave counts to the first three charts on each page, TSX, DJI & COMPQ. The other charts on the page are usually for confirmation of the trend and wave structure.
- Page 1 – Buy/Sell Signals & Misc Charts
- Page 2 – Indexes With 1 Minute Bars
- Page 3 – Indexes With 5 Minute Bars
- Page 4 – Indexes With 15 Minute Bars
- Page 5 – Indexes With 30 Minute Bars
- Page 6 – Indexes With 60 Minute Bars
- Page 7 – Indexes With Daily Bars
- Page 8 – Indexes With Weekly Bars (since 1981)
- Page 9 – Indexes With Monthly Bars (since 1981)
- Page 10 – Indexes With 60 Minute Bars, Candlestick
- Page 11 – Indexes With Daily Bars, Candlesticks
- Page 12 – Indexes With Weekly Bars, Candlestick
- Pages 13 through 14 are shorter term indicators. The indicators are used to simply look for some type of leading action before a turn or confirming action of the wave count. Page 13 is a look-everyday indicator page. The other indicator pages are less frequently visited.
- Page 15 – Hurst FLD Projections
- Page 16 – Indicators, Long Term
- Page 17 – International Indexes
- Page 18 through 30 are sector ETFs. They represent most of the active sector ETFs and are always a good hunting ground when looking for something that is breaking in a new direction.
- Page 31 through 46 are growth stocks with indicators. These are stocks that have been in a lengthy uptrend. One qualification is that they must not be severely damaged in a bear market so they can’t rise to significant new highs in the following bull market.
- The growth stocks show daily market action for the last 1.5 years and weekly prices since 1992. This gives a good perspective of how they have behaved in the immediate past (daily charts) and how they behaved during good and bad times (weekly charts).
- Page 46 – Last 6 charts are trades from the mechanical sell/buy signals
WAVE COUNTS SIMPLIFIED
- My wave counts are not Elliott Wave! It’s different, simple and functions without a maze of exclusions.
- There are 3 peaks (or valleys) to a completed wave count. A reversal of trend takes place after a completed wave count. Often times it’s as simple as counting 3 bumps (or dips) on a chart . . . Other times, not so easy.
- In a downtrend the same rules apply except you are counting 3 dips instead of 3 bumps.
- 3 steps must stay confined to a channel. Laying a pen or pencil on the chart will help you visualize the channel.
- As the larger trend progresses, all of the steps that make up the trend will also be confined to a larger channel. Sometimes a channel is not clear until the surge phase (vertical move) has ended.
- When the market breaks its channel (regardless of the perceived wave count), the step has been terminated. (Make sure your channel was correctly drawn before calling a termination). Sometimes this may be your best indicator that a wave count is completed.
- The correction following the second step is larger than the correction that followed the first step, and obviously the correction following third step is larger than the second step correction.
- A single wave may sub-divide into another 3 waves. I will call this an extension. When this happens (1) the trend is still intact, (2) the channel will widened and (3) instead of a total of 3 steps, there will be 5 steps.
- Sometimes I will use the terms “step” and “wave” interchangeably.
- Reading the glossary helps in the understanding of this blog. There are many other important facts in the glossary.
- Glossary Link
ABBREVIATIONS
- DJI = Dow Jones Industrials
- DJT = Dow Jones Transportations
- SPX = SP 500
- ES = SP 500 Futures
- COMPQ = Nasdaq Composite Index
- TSX = Toronto Stock Exchange (Canadian blue chips)
- SOX = Semiconductors
- TXX = Technology
************************************************************************************
- Long Term – UP
- Uptrend
- Mar 2009 To Present
- Step 2 Up (of 3) Completed
- Step 3 Up Has Likely Begun
- From the bottom in March 2009
- Large step one up ended in May 2010
- Large step two up ended in May 2011
- Large step three is underway

12-28-11 LONG TERM
************************************************************************************
- Very Long Term – DOWN
- Downtrend
- Jan 2000 To Present
- Step 2 Down (of 3) Completed
- Currently In Rally Phase From Step 2 Down

12-28-11 VERY LONG TERM
VERY LONG TERM COMMENTS
We have 3 possibilities for the future.
- We have entered a very wide swinging market (megaphone formation) similar to that of 1965 to 1974. During that era we had three bear markets with two intervening bull market rallies. Each bear market had a lower low than the previous bear. The intervening bull market rallies saw new all time highs before the next bear market began.
- We also have formed a huge head and shoulders formation since 1998. If this formation is valid, the downside measurement calls for a bottom around Dow Jones Industrials 1,000.
- We began a long term bull market in March 2009.
- I favor the megaphone formation as the most likely scenario.
Since 2000 we have had two bear markets, 2000 to 2003 and 2007 to 2009. Like 1966 to 1974, the recovery from the first bear market saw a new all time high (2007 peak). It’s possible that we may experience another all time high during the present recovery period. This would support the megaphone formation. A failure to make new highs would support the head and shoulders argument. In both formations the conclusion of the present recovery would call for a third and final bear market. An estimated time for the conclusion of the final bear market is approximately 2018.
The lesser downside target of both formations is the megaphone formation as it likely calls for a bottom 1,000 to 2,000 points below the 2009 low, which would be around Dow 5,000.
In the head and shoulders formation the measurement calls for a bottom around Dow Jones Industrials 1,000. This is almost an unimaginable event regarding the possible fundamentals to create this scenario. If this did happen, everything that could go wrong would have to go wrong. This scenario is so dark that it doesn’t seem possible but nevertheless, the head and shoulders formation is there and will be waiting until we pierce the all-time highs of October 2007.
Remember these are simply possible scenarios and are not embedded in fact. Whatever the outcome, it never hurts to be a little cautious with some of your money. But in the worst case scenario, everything that we take for granted as being safe . . . . would not be safe. This is something to never forget in the event things go very badly.
Hopefully we will never have to think about the worst case scenario.
************************************************************************************
EDSON GOULD
- Edson Gould, Premier Stock Market Strategist – Edson Gould had a profound influence on the development of my techniques and indicators. Prior to me subscribing to his advisory service, I was just one of the crowd.
- After 40 years I still have many of the publications from his advisory service, “Findings & Forecasts”. Fearing the loss of these hard copy reports I have recently scanned and created pdf files of these reports. Now I have hard copies and computerized versions of the reports.
- My series #1 indicator was mentioned by Gould only once in his market letters. If you didn’t catch its importance, too bad, because he only gave you a peek. I believe that he used this tool extensively and never told the world it’s importance. Prior to Gould writing about this indicator I had been looking for one that had similar characteristics without success. Thus when Gould wrote about it, I recognized instantly that I had struck gold. I have modified this indicator slightly and researched it back to 1939 for the Industrials, Transportations and Utilities . This was a lot of work as it was before computers and online data (remember when Barrons was available only on paper, still is for the distant past).
- Edson Gould was truly a legend in his own time. It’s too bad that today many people have forgotten or never heard of him or his discoveries. Below you will find only the first page of these reports. A teaser is what you might call it. The rest of the reports are available upon request. This is a man that deserves to be remembered throughout technical analysis market history.
- The following are links to Edson Gould reports.
- My Most Important Discovery by Edson Gould
- It was also my most important discovery, for it explained the irrational volatility of markets that had mystified me in my early years. During those early years I found nothing worked in predicting these irrational market swings. But the fog lifted after reading this report and I began to understand how to begin predicting the market. The book “Extraordinary Popular Delusions and the Madness of Crowds” is very useful in explaining crowd behavior.
- Swing Principle by Edson Gould
- A measuring indicator
- Utilities by Edson Gould
- A forecasting indicator
- Dividends by Edson Gould
- Bonds by Edson Gould
- Speed Lines by Edson Gould
- Sentimeter by Edson Gould
- With companies failing to pay dividends commensurate with their earnings, this indicator has failed. As the market deteriorate in the coming years, I would expect dividends to return to their former levels and this indicator will once again become useful. Prior to the late 1990s, it had 100 years of success.
- Bottoms by Edson Gould
- This was written and directed at the upcoming bottom in 1974 but it applies to all major bottoms.
- Three Steps by Edson Gould
- Where do you think my three steps principle came from? Straight from this report although I modified the concept through the years.
- Edson Gould’s 1974 Forecast
- Gould’s 1974 forecast kept me bearish and short throughout 1974 until the week before Christmas 1974, during which I began making long term purchases. After that it was ride the bull phases that transpired from 1975 to 1982. 1982 to 2000 was the greatest bull market of all time.
- Edson Gould’s 1975 Forecast
- Edson Gould’s 1976 Forecast
- Edson Gould’s 1977 Forecast
- Edson Gould’s Five Year Forecast 1977 to 1982
- This was a remarkable forecast in 1977, where the Dow Industrials had never been higher than 1,000. NO ONE had predicted a rise of this magnitude in 1977. Most were waiting for a resumption of the bear market.
- As part of the 1977 to 1982 forecast I have the following story. On Wednesday August 4, 1982 I went long the market for the first time in months. By Friday, August 6 I was worried that I had made a mistake as I was deep in the red (I was long the Kansas City Stock Market Contracts). The Kansas City Stock Market Contract was the first of the stock index contracts (February 1982). It was based on the Value Line Arithmetic Index, margin requirement were quite low, and it had a multiplier of 100 times the Value Line Arithmetic Index, which meant the leverage was very high. On Friday (Aug 6), my wife and I went to dinner and I told her my tale of woe and asked her whether I should sell my long positions. I explained that my series #1 indicator had reversed and continued higher on Thursday and Friday but the market had continued lower. Since the key indicator was usually correct, we decided to stick it out awhile longer (I was crazy in those days). On Monday August 9, 1982 the market took off like a rocket and never looked back. The ignition for the 1982 to 2000 bull market was underway. I skyrocketed out of the red and had a big profit. In August 1982 the only people that were bullish were Edson Gould, Robert Prechter and myself (probably a couple of others but I didn’t know them). Everyone else was extremely bearish. It was a perfect example of extreme crowd behavior.
************************************************************************************
TRANSACTION SIGNALS
- All actionable signals are only for short term time frames. These signals are not designed for intermediate or long term time frames BUT . . . . .
- After a short term buy signal, long term tax status can be achieved by a continuation of the upward trend, which causes short term actions to morph into long term holdings.
- See more details in the glossary under “Taxes, Futures Contracts” and “Money Management”.
TRANSACTION RECORD
- In this blog a warning of an impending bottom (or top) is often issued well in advance of the formal buy or sell date. This allows thoughtful consideration prior to a formal action signal. To get a sense of how this works, you should read the days prior to a formal buy/sell signal. I often buy/sell in my personal account based on the early warnings.
- The transaction record near stock market bottoms will show that I am very skittish and usually remain so until the new direction is well underway.
- STOP BUYING – FEBRUARY 6, 2012
QUALIFIED BUY – DECEMBER 15, 2011 - QUALIFIED BUY – DECEMBER 12, 2011
- QUALIFIED BUY – DECEMBER 5, 2011
- ACKNOWLEDGED BOTTOM – OCTOBER 16, 2011
- PREVIEW TO A BUY SIGNAL – OCTOBER 2, 2011
- BLOG SUSPENDED ON 9/27/11
- This blog was suspended the first time on 9/17/11 due to a death accompanied by a family illness. It was suspended a second and longer time on 9/27/11 due to an extremely serious family illness. Blog resumption with comments and charts began again on 11/27/11. Unfortunately due to illness I clearly missed issuing a formal & important buy signal closer to the 10/4/11 bottom. Hopefully this error will not be repeated.
- SELL – SEPTEMBER 9, 2011
- BUY – AUGUST 30, 2011
- SELL – AUGUST 30, 2011 – Stopped out, re-bought quickly
- BUY – AUGUST 29, 2011
- SELL – AUGUST 25, 2011
- BUY – AUGUST 23, 2011
- SELL – AUGUST 1, 2011
- BUY – JUNE 23, 2011
************************************************************************************
MISCELLANEOUS
- There are useful items throughout this blog. For instance, the “Wall Street Quotes” can be very instructive. So make sure and look all through the blog.
All Rights Reserved © ™
Explore posts in the same categories: IN DEPTH, UPDATE
Leave A Reply