October 2009 – T Theory® Update

Terry Laundry’s T Theory Observations for October 2009
…Of everything I read Terry Laundry’s Magic T Theory made the most sense to me. …Terry was an eccentric genius living out on Nantucket Island. He was a fellow Marine, a jughead, who’d graduated from MIT and was now using his considerable engineering skills to analyze the market. Terry believed that the market spent the same amount of time going up as it did going down…When you look at the letter T, hence, the Magic T Theory…With the Magic T there was order in the universe a high and low tide every…The Magic T and I became as one.
– Marty Schwartz, legendary trader and author of the “Pit Bull”
Update for Saturday October 31 2009
For today’s discussion we have two charts below; the first for the near term outlook using my regular daily charts, the second for the longer term Ts. See these charts or download them if you wish, then listen to my audio commentary, part A for the first chart, part B for the long term chart. Helpful Hint for Windows users; I have been told that if you are not getting the audio stream to work for you, right click on the audio link and it will download the audio file to your computer, after which you can play it. Daily Updates will continue at the Foundation site as noted above.
Daily Chart Download SRT20091030
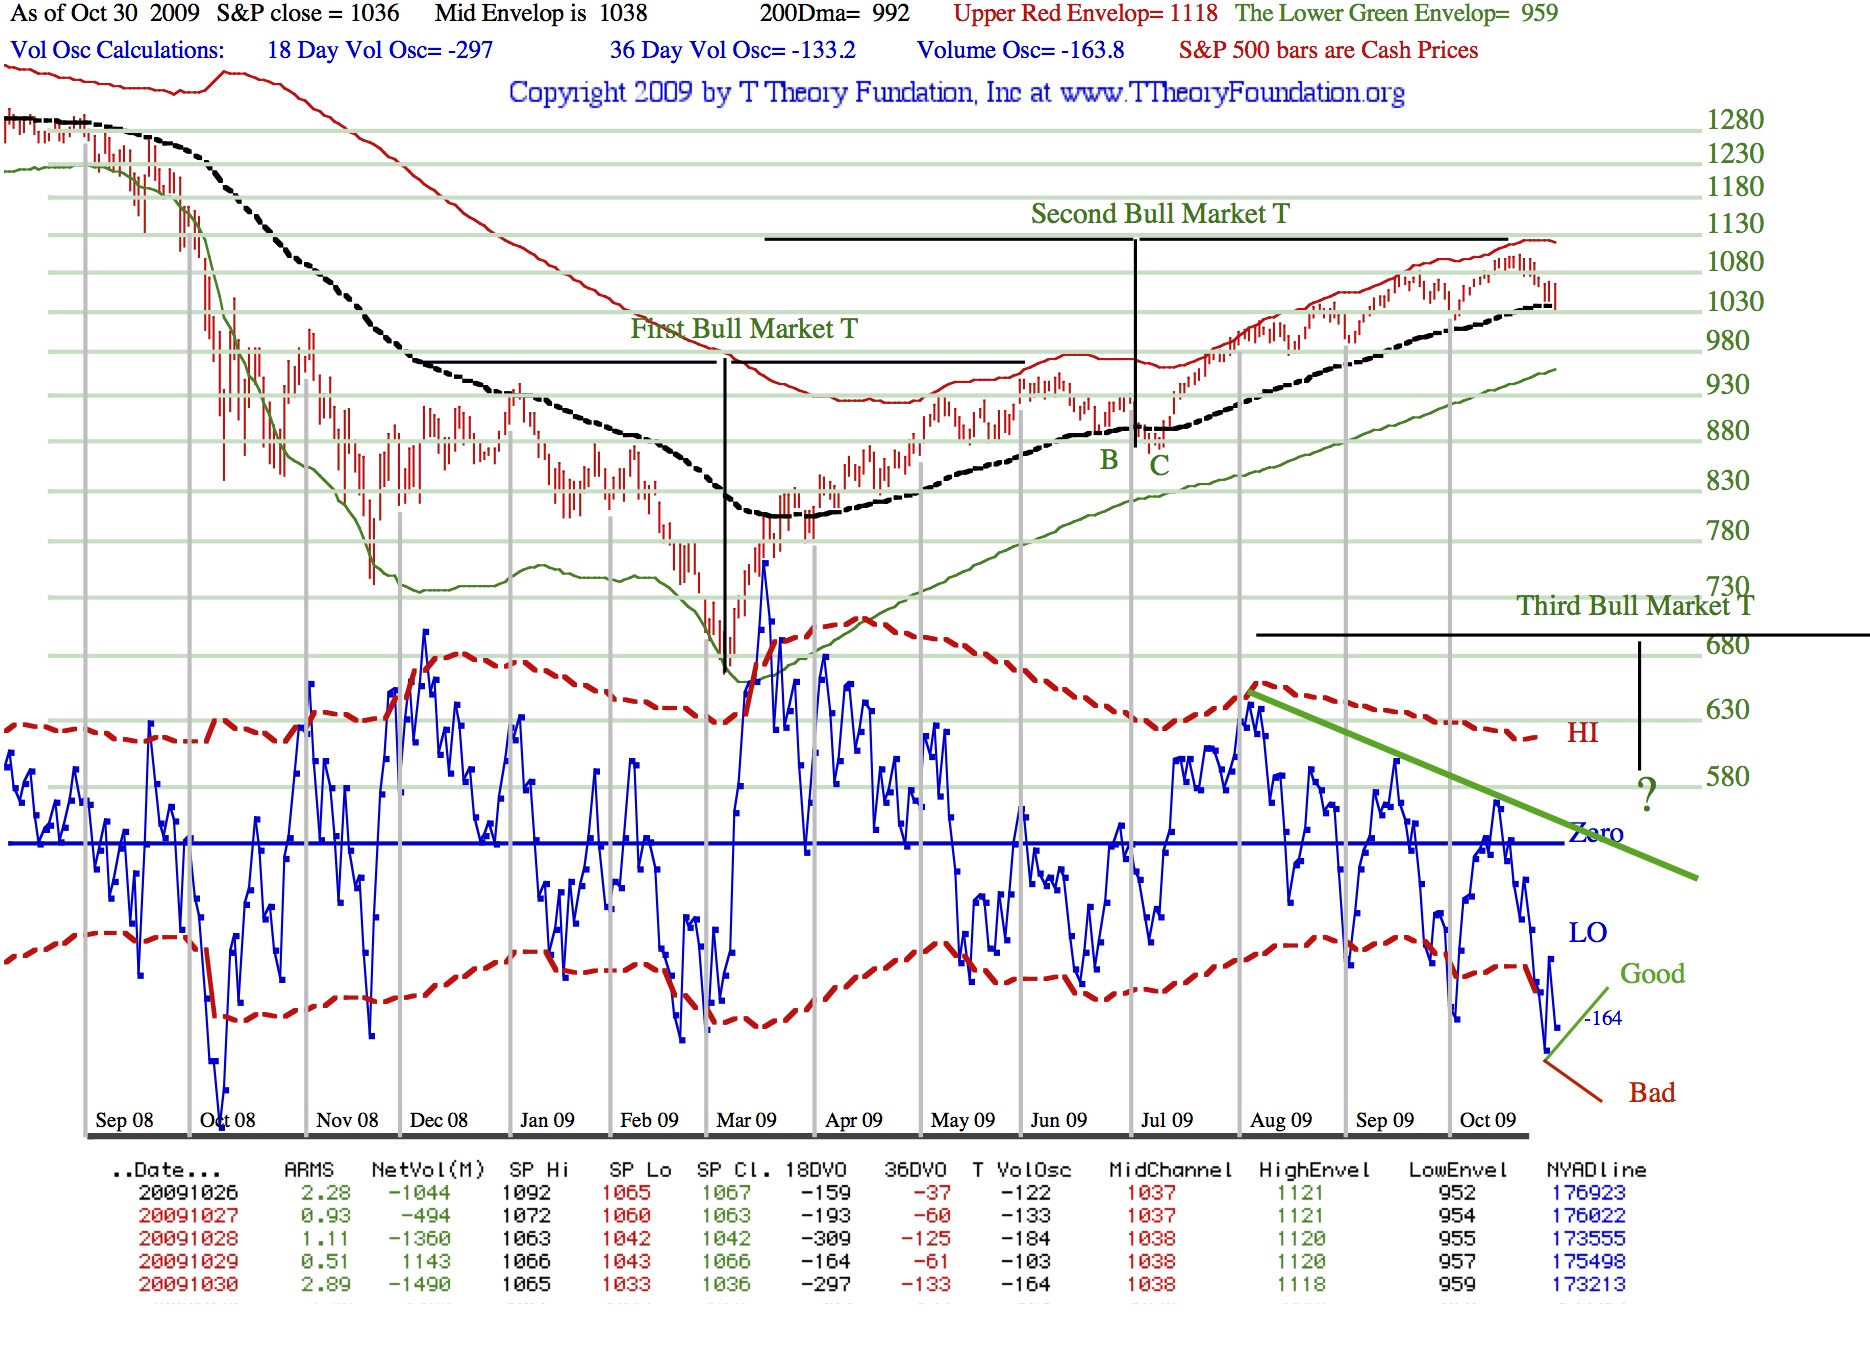
Audio Commentary for the Daily Chart above Download TTO20091031A
Longer Range T Chart for Bond Fund and China Fund
Download FAGIX vs MCHFX abcdTs
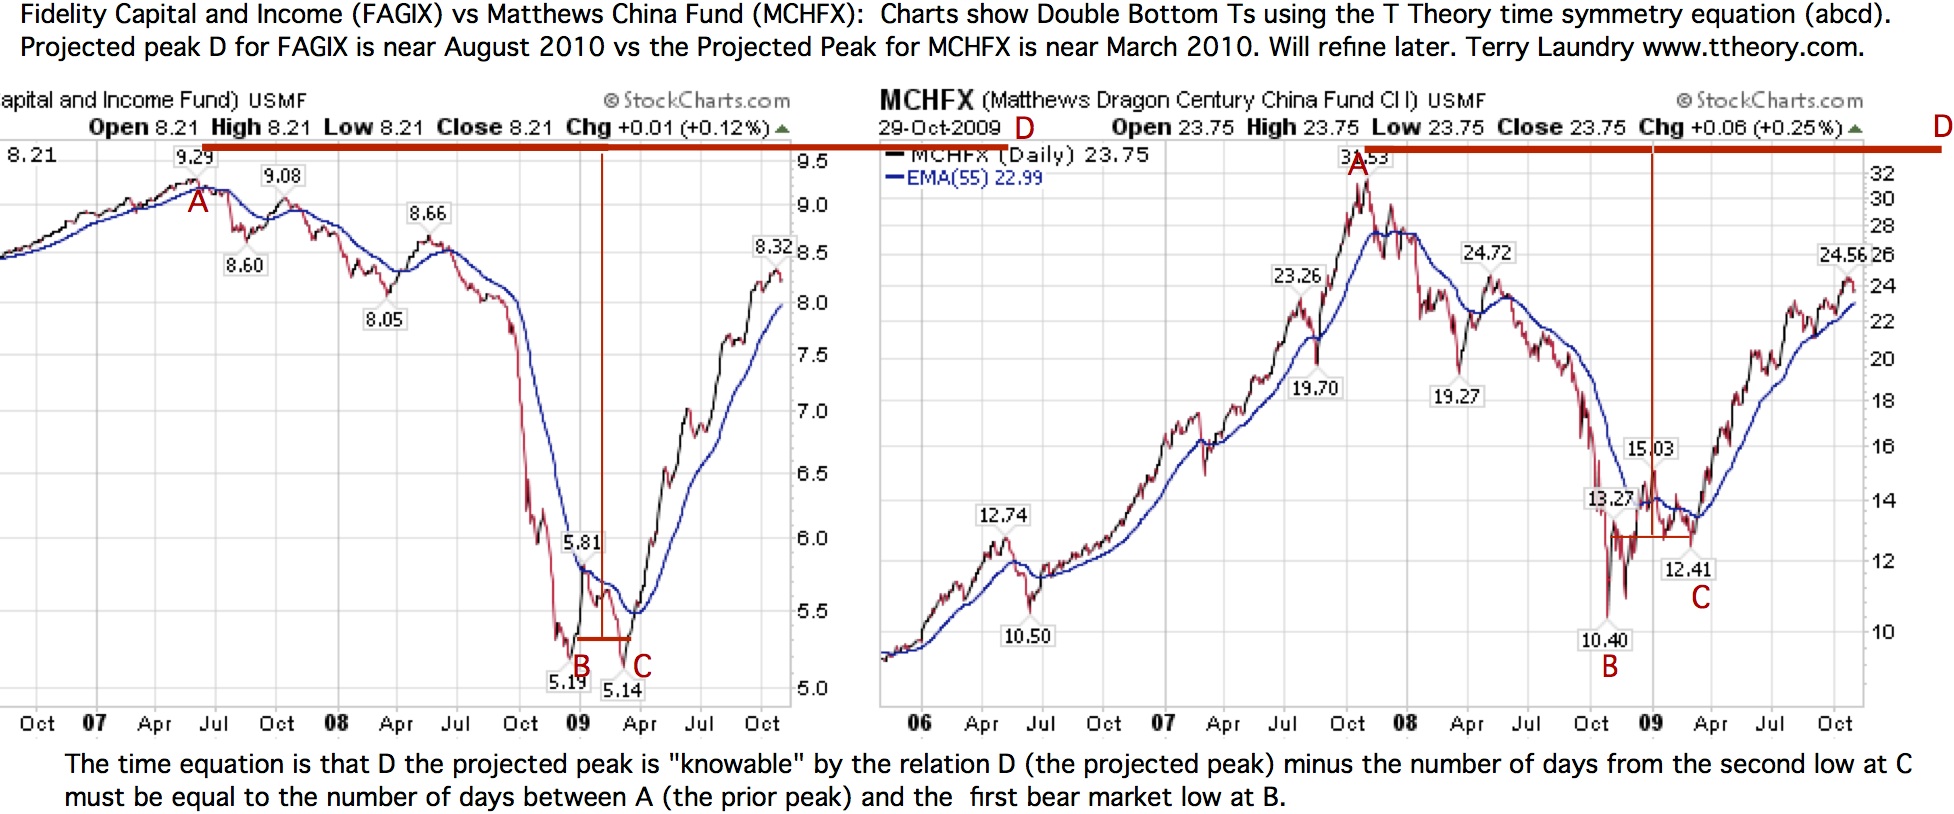
Audio Commentary for the Fund Chart above Download TTO20091031B
Update for Sunday October 25 2009
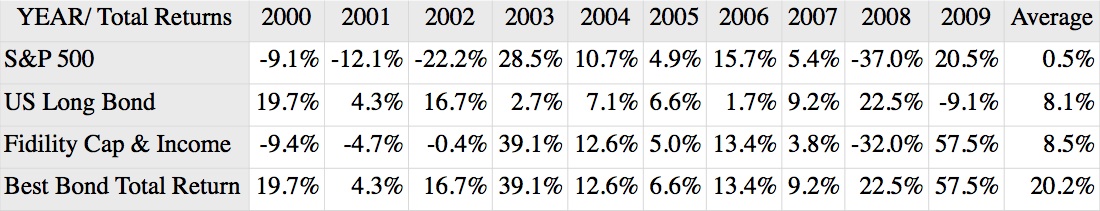
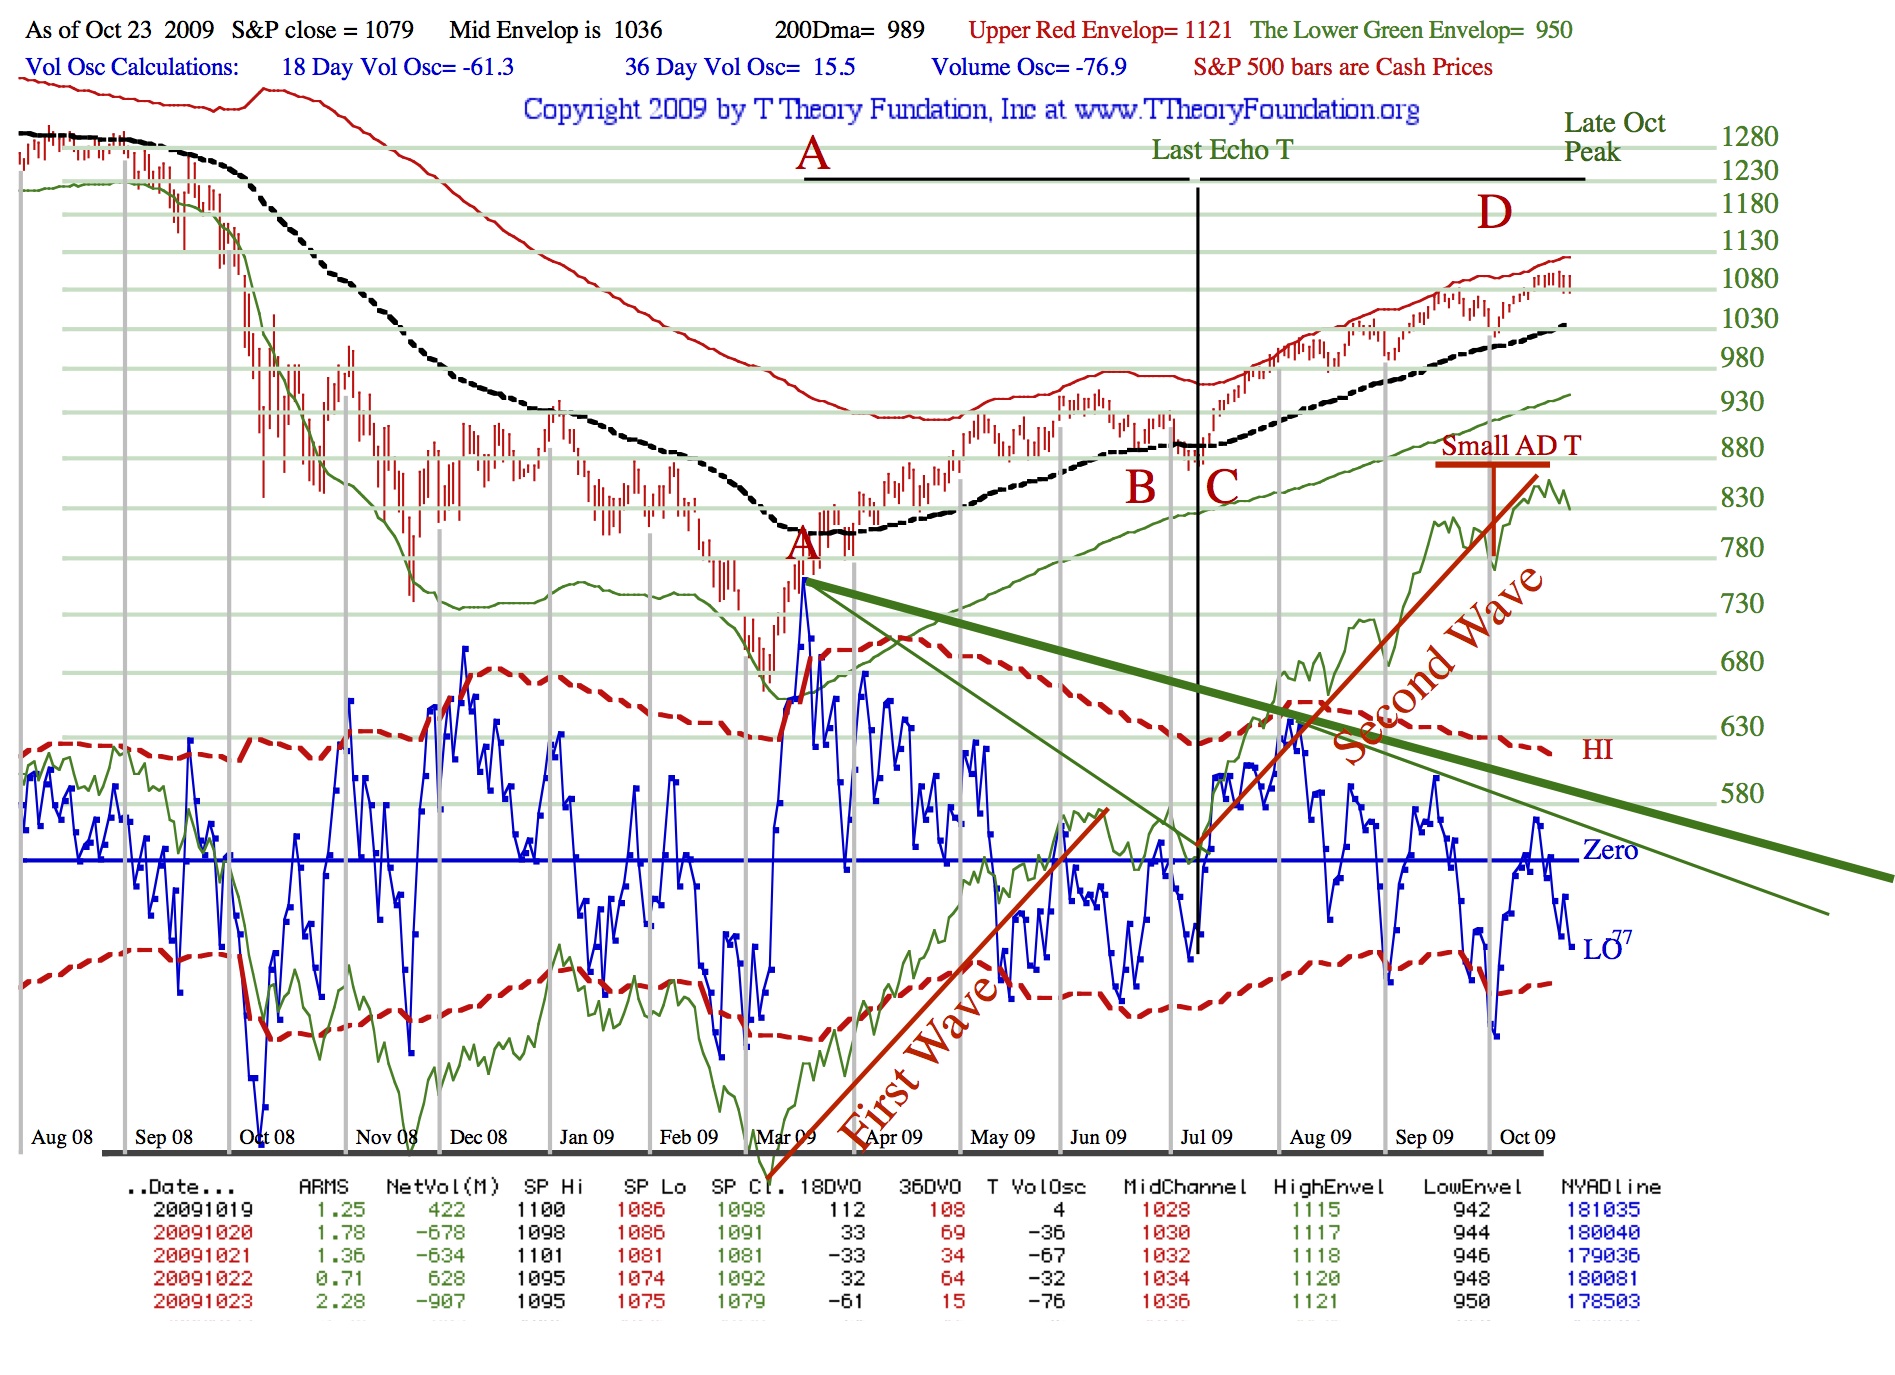
For today’s discussion see the two charts below; the first for Best Bond, the second for the standard T Theory indicator chart. The audio discussions for part A and B relate to the discussion I had with Peter Eliades last week. I hope these topics help to answer a variety of email questions I have received. Part C is my general forecast which will be refined by the end of day updates, as noted above, that will come by 6:30 pm ET at the Foundation site.
Table Chart Download BestBondpdf
Daily Chart Download SRT20091023
Audio Commentaries:
First Audio Download TTO20091025A
Second Audio Download TTO20091025B
Third Audio Download TTO20091025C
Update for Sunday October 18 2009
Today we have just one chart with data added and a number of discussions that help resolve questions I have received. First Download the new Chart below.
New Daily Chart Download SRT20091016
Then Listen to the three Audio Commentaries below.
Summary Commentary Download TTO20091018A
Projection Commentary Download TTO20091018B
New Projects Commentary Download TTO20091018C
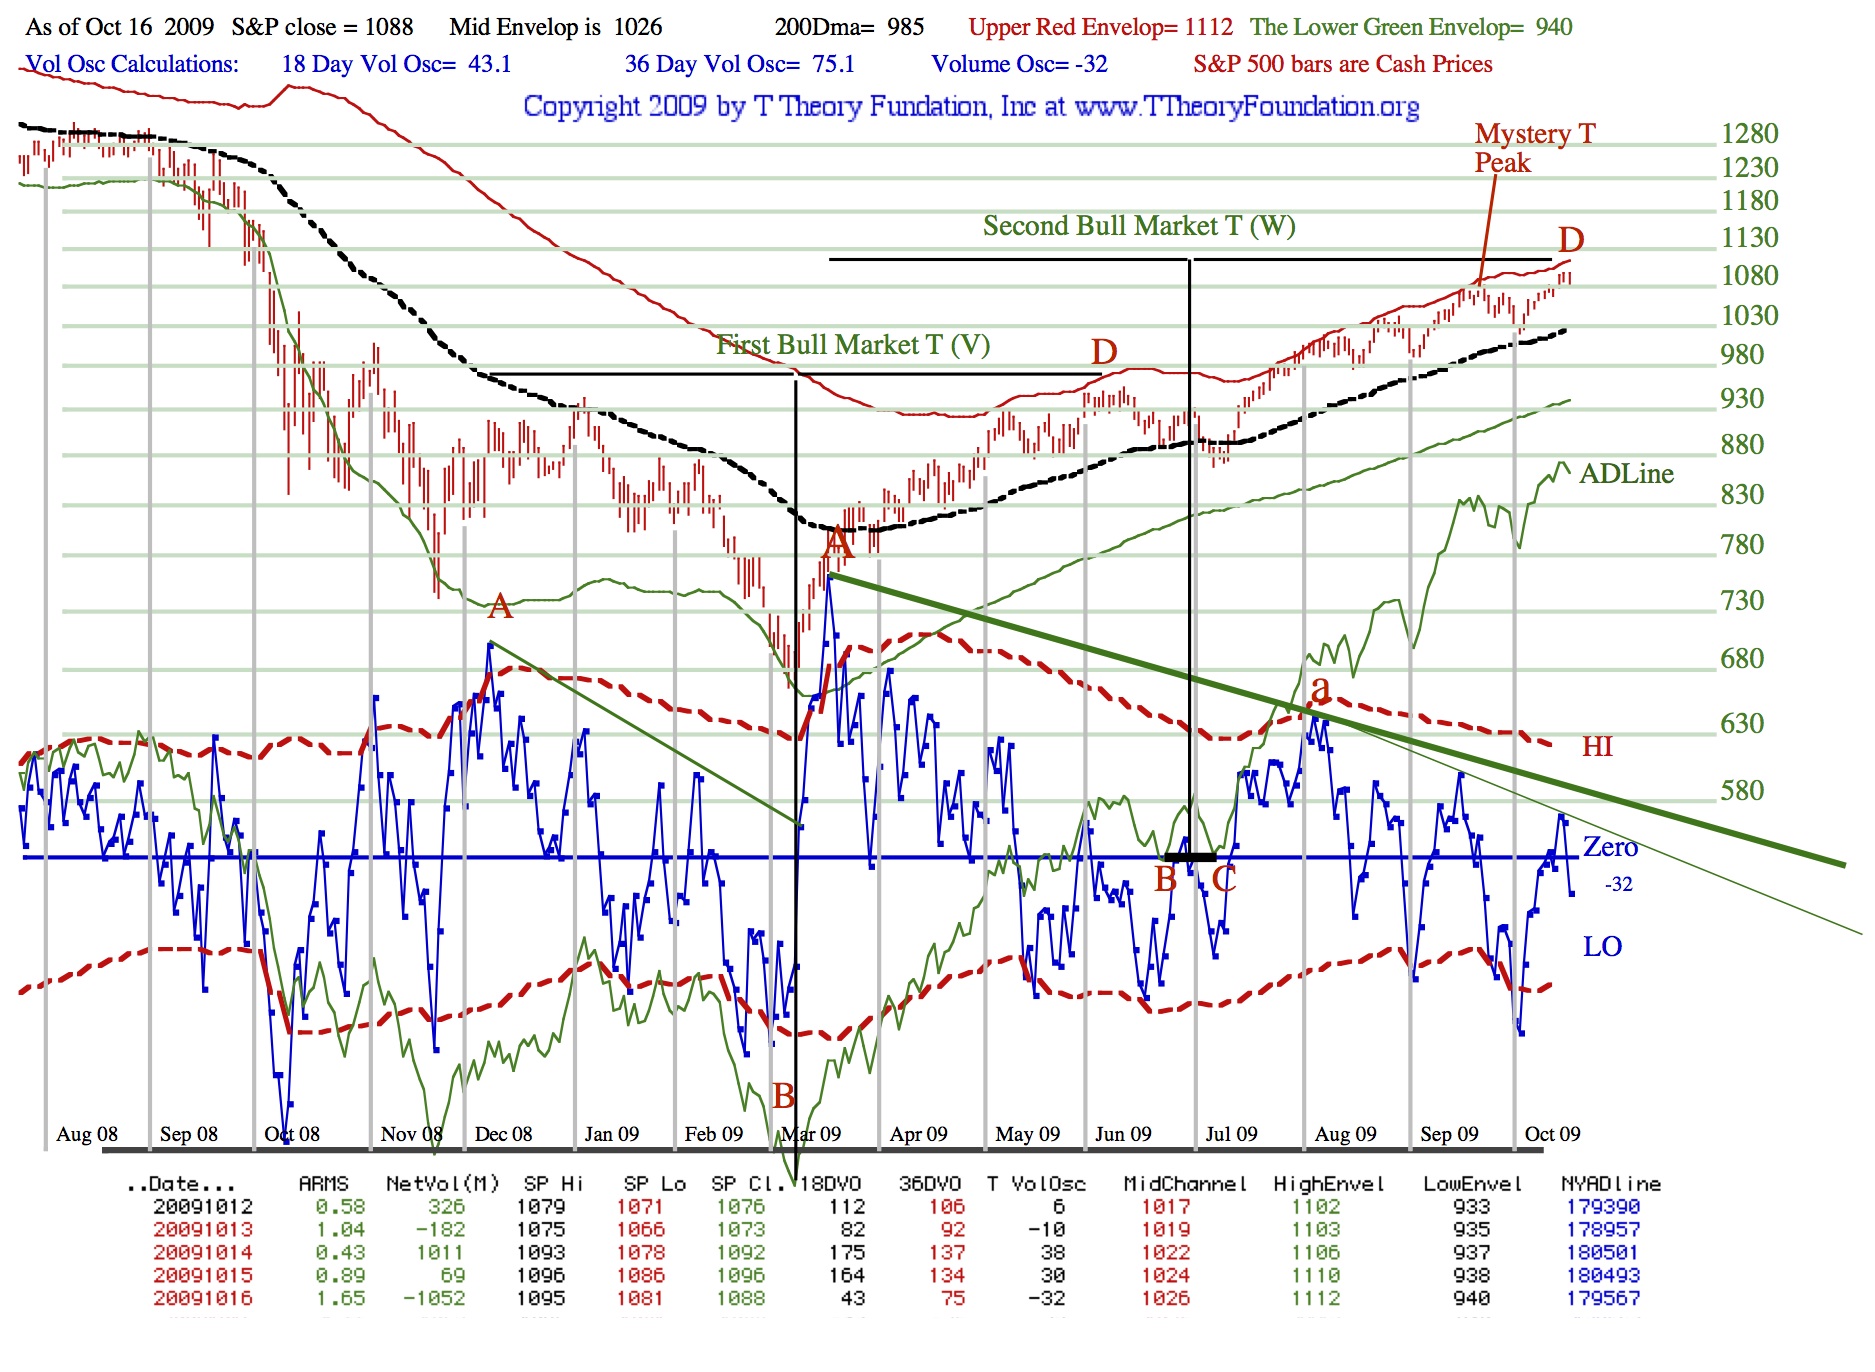
Update for Wednesday evening Oct 14
Todays strong gain meets nearly all the peak requirements for the ABCD T construction on a closing basis. The date is within range and the market is at token new highs above the Mystery T’s mid September peak. The closing S&P is just shy of the upper envelop target level of 1106 but that might be reached tomorrow. The very short term T on Sunday can have its center date more later by one day so it is possible we have seen the momentum peak today and the upside strength will rapidly dissipate.
Update for Sunday October 11 2009
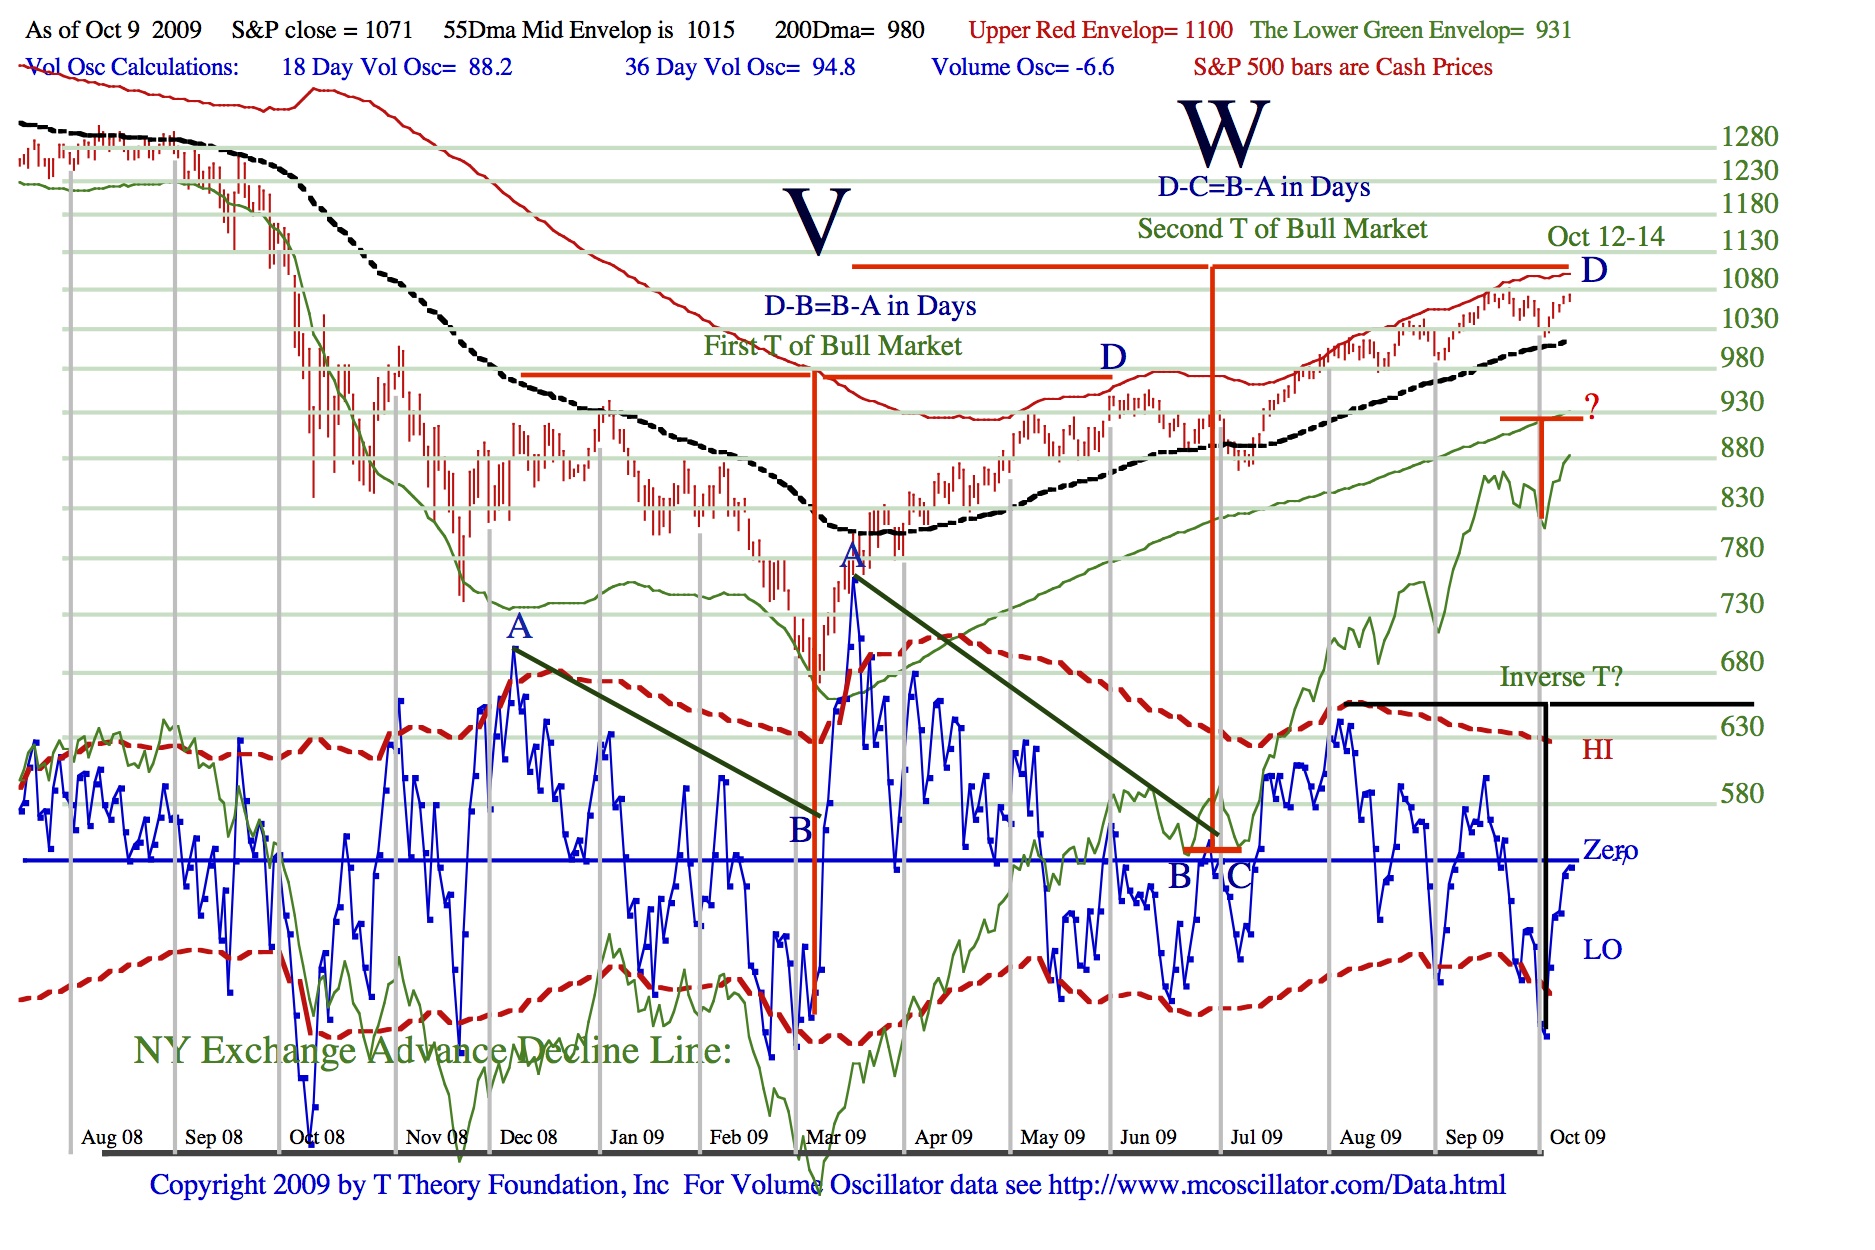
Lots to talk about today in the two charts below and the extended commentary which confirms top projection Oct 12 to Oct 14 as per last weeks notes. Then we move on to explaining T Theory in term of “echos” to better explain the longer term outlook into August 2010.
Daily Chart Download SRT20091009
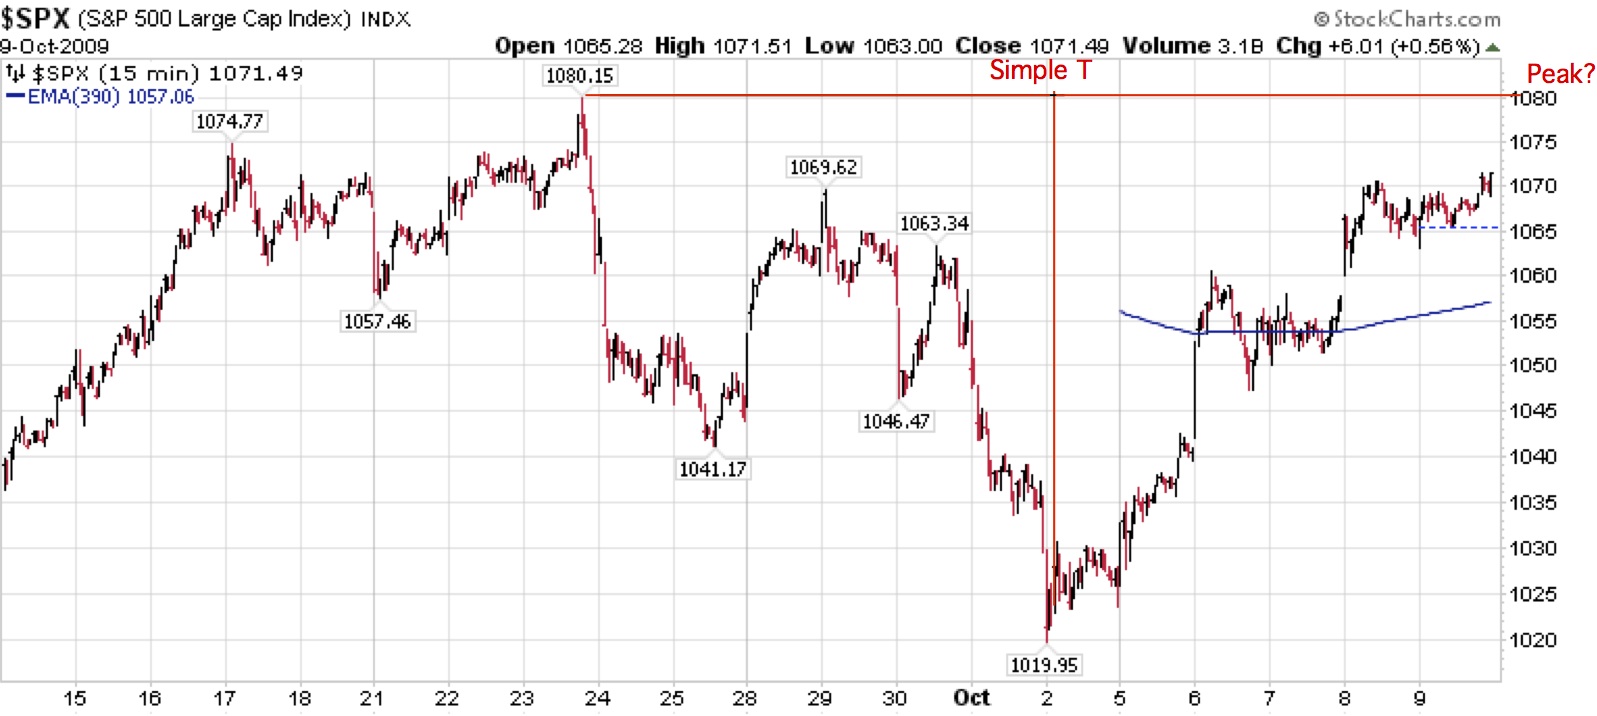
15 Minute S&P Chart Download SPX15min091009
Forecast Audio Commentary Download TTO20091011A
Historical Audio Commentary Download TTO20091011B
T Theory Echo Concepts
(in the later part of this audio I mis-spoke the B bottom when I meant the C bottom relative to late October and post September 2007)
Oct 9th Morning Note
Jim reports:
From your PDF file, using 15 minute real time data, it looks like “A” occurred on 3/19/09 @ 9:30 AM (S&P 803.24) and “B” occurred on 6/23/09 at 11:00 AM (S&P 888.86). This represents a 68 day, 2 hr time lapse from “A” to “B”.
The subsequent July low “C” (S&P 870.05) occurred on 7/8/09 @ 12:15. Therefore, the October high “D” looks like it may occur on 10/12/09 @ 14:15.
Looks good to me…Terry
Oct 8 note
I am changing my outlook back to the original forecast of an important peak and selling point on Oct 12 13 14 as below. The performance on Thursday was negative in my view as we are losing momentum and the volume oscillator is probably topping at the zero line.
Oct 5 after close note
The mid Oct peak(D) is being estimated as Oct 12, 13, or 14th. It is positive that the Arms selling climax and Wrong Ts bottom date has halted the slide to the 55 Day MA. Should be headed up from here.
Update for Sunday October 4 2009
Expect Low early next week (Monday) intraday at S&P 500 cash 1008 then rally to mid October high sell point. See long discussion in three audio parts with two PDF Charts.
Chart Download SRT20091002WrongT
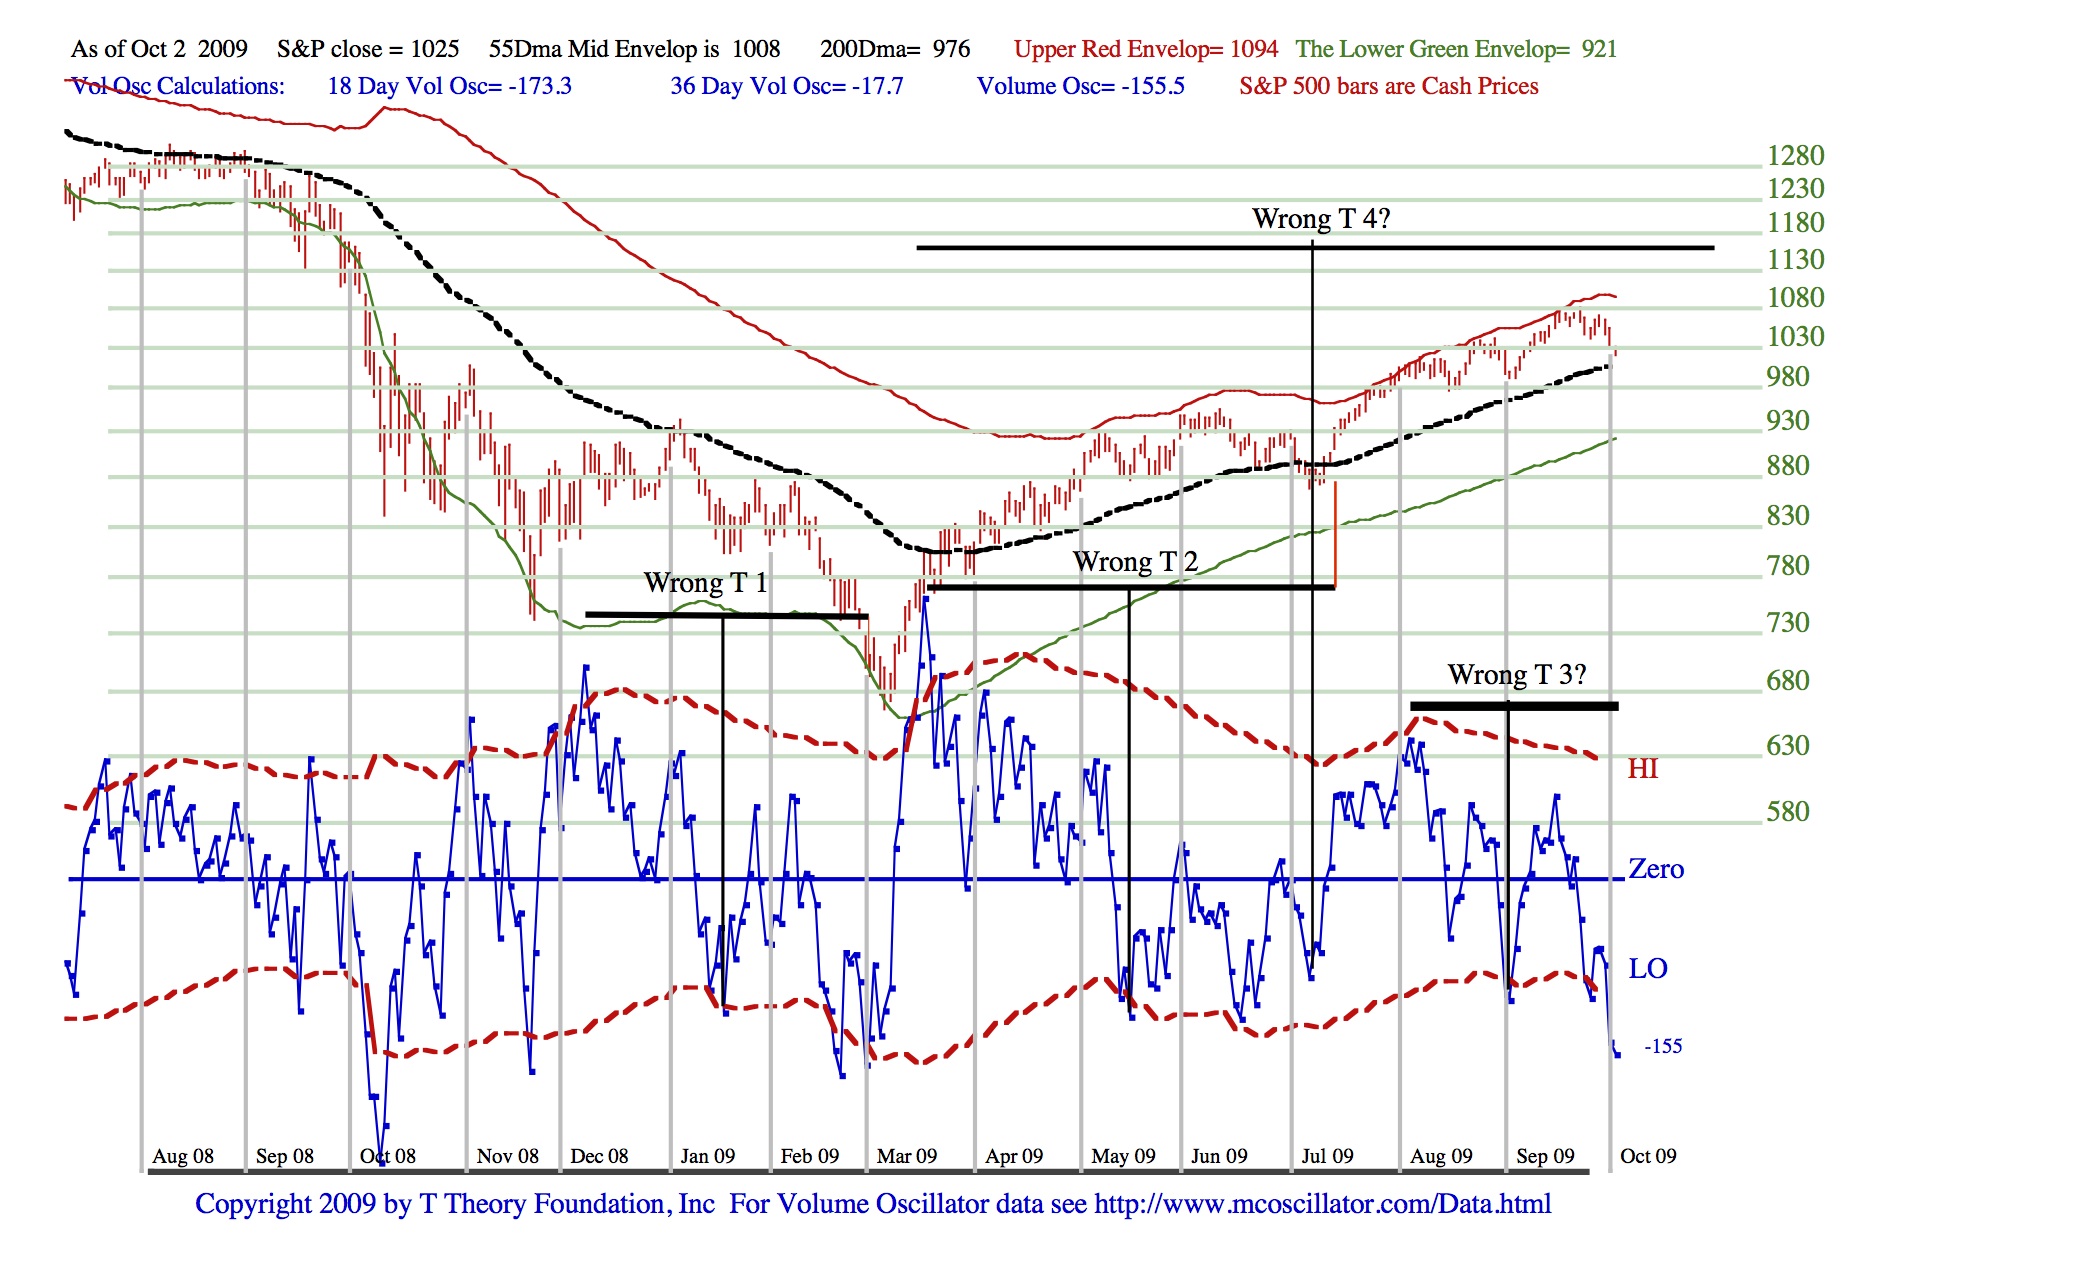
Chart Download TTO20091004ADT
Audio Comment Part A Download TTO20091004 A Intro
Audio Comment Part B Download TTO20091004Projects
Audio Comment Part C Download TTO20091004ADT
****************************************************************************************
All Rights Reserved By The T Theory® Foundation ©
Order the T Theory® Encyclopedia
For a complete understanding of the T Theory® and how to successfully use Terry’s unique methods, order the Encyclopedia from Paula at the above link. There is additional material in the encyclopedia not covered here. Paula will be more than happy to answer your questions too.
Many thanks to Paula Burke for her permission to re-post Terry’s old T Theory® explanations. The period re-blogged on these pages are some of Terry Laundry’s best work and was published here from public domain.
****************************************************************************************
I claim no credit for the material found under T Theory® on this blog. All of this material is the creation of Terry Laundry and was downloaded from Terry’s free blog site (TypePad). I have created a mirror of Terry’s original material and now there is a second site containing Terry’s T Theory®. One or both of these websites hopefully will survive through time as Terry’s material is too important to be lost to the ravages of time. This site is simply a memorial to his lifetime work.
The page content re-blogged here is exactly as Terry created on his original webpages (saved on my computer with ScrapBook)). Nothing has been left out from the period Dec 2003 to June 2011. From Terry’s site, I made a lot of formatting changes, creating a more easily readable webpage appearance. The PDF chart duplicates of the JPEGs have been omitted for ease and speed of recreating Terry’s pages. References to PDF charts should be ignored (but no chart was left out).
After June 2011, Terry created a paid subscription website. None of that material is found here.
There were many many, many hours spent on this project; downloading Terry’s individual charts & audio files, followed by the uploading of Terry’s charts and audio to my WordPress blog library, after which I had to insert the uploaded material into my new T Theory® webpages (hopefully in the correct places). This was a dull and arduous project and I hope you enjoy it. I don’t believe there remains any more of Terry’s material in free domain, so my T Theory® project is probably finished. If I’ve missed something, you can leave me a comment.
If you find an uploaded reference error (chart or audio in the wrong place), please note the month and year of the webpage, plus the exact name of the referenced error file. Include any other info that will help me locate the problem file and where it occurs on the webpage. Leave a comment for me with the info and I’ll fix it.
Terry’s material is very long and will take many weeks for you to finish. Don’t hurry, it’s not a marathon and you will absorb more if you go through it at a reasonable rate. This is especially true for those who don’t invest in the T Theory® reference encyclopedia. The encyclopedia is a written reference for T Theory® and includes everything of importance for Terry’s T Theory®. Without the reference encyclopedia you must depend on your memory and Terry’s method carries some rules that you could easily violate. The encyclopedia also includes new information never seen on his website.
You are welcome to save any or all of my blog material to your computer. You also have my permission to re-blog my information, but you must (1) credit me and my blog in an obvious manner and (2) don’t change my material.
FYI – I find the best way to save a webpage is using “ScrapBook” (it’s an add-on for the FireFox browser). ScrapBook saves a webpage to your computer EXACTLY as it appears on the day you saved it. You can’t tell the difference between the internet webpage and your ScrapBook saved webpage. The saved pages are not pictures. Instead the pages consist of HTML and page functionality remains identical on your computer. There is also a second method for using ScrapBook, where you can save all of the webpages down to a defined link depth. This optional method means all links will function on your computer to the link depth specified (meaning you can click on links on your saved webpages and tunnel down into pages within pages). Saving the normal way will only save the top webpage but the links that exist could continue to function by taking you to the website on the internet instead of on your computer. But sometimes the linked website doesn’t exist anymore. I’ve had this happen on some very good webpages with unique information (they just disappear into the internet void). That’s a bummer when you lost some really good info and thus rose my need for ScrapBook. You can also filter the pages saved using the optional ScrapBook method, which can exclude all pages not coming directly from the specified website (filtering is recommended using this method otherwise you wind up with a LOT of useless stuff).
.
Explore posts in the same categories: . . . T Theory®
Leave A Reply