May 2006 – T Theory® Update

Advance-Decline T Update
In this Observation report I am summarizing my review of the big Advance-Decline T which has projected the rise from the late 2002/early 2003 low will last into 2007 despite corrections along the way.
A purpose of my current work is to refine the final projected peak date, which looks to big about September 2007 and then consider the Rate T forecasts of market lows along the projected bullish path as the primary T Theory tool needed to refine this long term forecast.
To present the analysis I will use two charts. The first graphic below, taken from my December 7, 2004 posting, located in the Archives, shows the successful projection of the first long term peak coming out of the 1929-1932 bear market. It makes use of the simple time equations needed to handle double bottoms as noted in that posting.
In my 1973 original T Theory publication I realized the center post of any T located in an equity price low that has multiple bottoms as per the 1932-1933 period or the late 2002-2003 period, needs to have the T’s center post placed midway between the earliest low and the latest low, if an accurate projected market peak is to result at the right end date of the T.
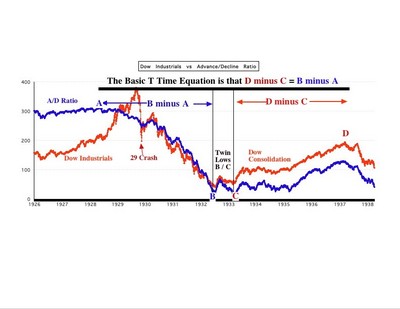
The early example in the first chart was my first chance to look back into the 1930’s with accurate data and verify the technique. It is also the first example of a new data approach I am researching. I was pleased to see the accurate projection of the peak at point D in 1937 because the big Mega-T concept which uses the Dow Jones Industrial Average to develop major T forecasts from 1800 concludes that the 1929 peak was a major peak. Therefore the first recovery from the 1932 low area was destined to self-destruct at some point in order to allow the longer term corrective process inherent in the Mega-T concept to continue.
The fact that this T made the accurate projection is key to my future because the second chart which brings us up to date for the present situation has the same general picture. I am of the opinion that when the recovery is completed for the current Advance-Decline T in 2007, we will see a similar self destruction in equities as the longer term negatives of US non competitiveness allow a massive and sudden correction to take place from the right end date projected by this T.
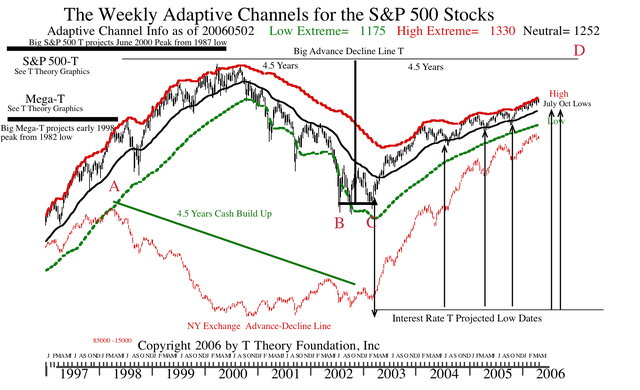
Of course there isn’t any way to guarantee that the current market advance, forecast to last well into 2007 by T Theory, will in fact last until September 2007. However, in the present situation we do have rate T projections of market lows along the way to help us navigate past the dips that might confuse the validity of the longer term bullish projection. The projected low dates derived from my Rate T concept are taken from my T Theory Foundation study and graphically indicated for the 2003-2006 period at the lower right of this chart. If the remaining July and October lows prove roughly accurate, we will have all the information needed to handle the remainder this year.
Come 2007 we will only need to add the new rate Ts that reach out into the new year and we will have the next series of projected lows. By then we will have seen the results of the next two 2006 rate Ts lows, and be able to gauge their accuracy as a primary tool in T Theory. We should also have the the first chance to look at the Kemp buying criteria coming out of an oversold condition to gauge its place in the overall scheme of developing a buy criteria within a bull market.
When we get to the vicinity of the projected peak for this T, estimated to be around September 2007, I then want to seriously address the potential for very long Rate Ts to project the rough dates of future major market-lows. As you may remember when I first detailed the Rate T concept comments were posted stating that the very long Ts constructed in the 30 year bond rates had correctly projected major lows, including the late 2002 low. When I get the time, the next step will be to scan the 1978 to present history of these very long rate Ts for an estimate of the bear market low that should follow the current A-D T’s projected September 2007 peak.
This should bring the state of T Theory up to what I want for the future. Advance-Decline Ts look reliable all the way from 1929 to the present, once one has identified the center post low of each new T. Rate Ts which are a much more recent development, look to be capable of finding most if not all lows, but the research is not competed as yet. The final step will be to incorporate a historical study of the Kemp oversold buy criteria once it has been researched more completely. At that point I think T Theory will pretty well cover all the needs we want for a practical approach to investment timing.
Before moving on I would ask anyone who is interested in refining the current Advance-Decline T projected peak make the calculations and post the results as a comment to this topic. My data shows the left end of the T at point A, defined as the prior peak in the A-D Line, was April 3, 1998, Point B was October 9, 2002, and the final low at C was around March 12, 2003.
If you locate the mid point between B and C and call it the Ts center post date, as my chart suggests, then the cash Build Up phase that defines the left side of the T last the number of days from A to the midpoint of B and C. All Ts require that the general market averages or other prices advance in the right side of the T for an equal time, so it becomes possible to estimate the final peak date at the T’s right end. This date is only of technical interest now but the estimate needs to be made sooner or later. Alternatively use can use the time equation in the first chart. The results have to the same.
The eventual projected date that this bull market will peak obviously can not be guaranteed, but the big Mega-T forecast of an early 1998 peak and the S&P 500 projection of a mid 2000 peak noted at the upper right of this chart and made well before the fact, worked well, so it should prove reasonably reliable. But for posterity sake I want to make the best estimate possible so that by 2008 we can look back and see how my best efforts came out much as I did with the prior big Ts.
The key point that I want to make here is that using big T projections for the equity market are considerably more practical now that we have Rate T projections of upcoming correction lows. Corrections which normally occur in any bull market typically hold at the 39-40 week (i.e. 200 day) moving average, shown here as the black line in the center of the red and green envelops. This is good to know from a historical perspective, but their seemingly random appearance over time makes us all nervous and often prevents maximizing one’s rate of return, mainly due to the needed to continually offset the potential downside risk back to the 200 day moving average which otherwise could “Happen At Any Time”.
However once it is assumed the duration of the overall advance in the right side of a major T being fixed by what I assume is a natural property of investment trends, and the lesser counter trend corrections are also fixed in time by Rate Ts for the same reason, we can move onto the more practical question of maximizing price appreciation, rates of return, selection of best investment sectors, etc with the proviso that we must still correct for errors with “stops” (to limit losses) if and when something deleterious unexpectedly occurs.
In this more advanced T Theory view of major trends vs counter trends, the Advance-Decline Ts, Rate Ts and the Kemp criteria will combine to produce the best benchmark for aggressive timing at the expense of the Short Range Volume Ts. The Short Range Volume Oscillator Ts are still important and by June I will have to address the question of where the next projected peak prior to the next correction might occur. However it is now seen as undesirable to address the question of any T’s center post date (which is largely random in its time distribution) as part of any investment strategy because the rate Ts plus the Kemp criteria provide a more predictive estimate that gives the greater advantage when rates of return are considered.
To illustrate an example, let’s summarize the T Theory forecast looking out a few months and point out why this combination of the A-D T and the Rate T provide the better approach, assuming we add “stops” for any unexpected behavior that is out of line with their combined expectation. In the chart we see the Rate Ts are doing a good job of projecting lows for the S&P, but of course they don’t project the highs that precede the correction lows.
Well my response is that you can’t have everything from one indicator but is it is reasonably true that it you are in a time period that has no Rate T lows projected, as we are now, then one might reasonably believe the investors are just putting a positive spin on the competing outlook for excellent corporate earnings growth (a positive for stocks) vs increasing long term rates( a negative for equity valuation). This optimistic outlook results in the steady overbought up-trend in the S&P which has pinned the trend at the top of the red envelop channel currently given as 1330 on the S&P as a statistical upside “very high” extreme estimate.
My prior forecast of this outcome was based largely on the rather extreme, and potentially risky assumption, that all market lows are predetermined by long term rate concerns that propagate through time from the left end of a Rate T to the predetermined right end date where investors suddenly recognize the risk to the maximum degree possible. My research suggest the operative concept is that all market lows can be defined as the point in time at which interest rate concerns are maximum and therefore the downside equity pressure should be at a maximum. Once past that point in time fading concerns allow equities to rise out of the low.
Right now rates are rising and represent a reason for concern for a market correction, but investors instead are concentrating on the strong earnings and the potential for a pause in the Fed’s steady rate increases. But as we get closer to July, according to Rate T Theory , these concerns will begin to surface as the more dominate concern, and by October, the worst of the Rate T’s negative effects should surface. I have written in detail how interesting these July/October twin rate T lows should interact, but basically the October low projection should represent the traditional 4 year low and market an exceptional buying opportunity for the next rally phase which should persist into point D later in 2007.
Of course before we get to the major low we need to refine the current rally and judge when its going to peak before the market corrects into the first July low. The usual way, via the Short Range T, isn’t reliable at least for now because we can’t locate the center post without a more clearly defined oversold condition. However there is another way, and using it, I chose to forecast the rally from the October 2005 low would likely last until June 2006 with the S&P holding its 55 day MA (now 1293) on corrections. This has been the case so far but we need to put a better target range of the date for a top.
One approach is to note that most rate T corrections last 1 to 2 months in duration, with 6 weeks being about the norm. The correction labeled for “July” in the chart is technically projected to end August 11, so if we back track to the earlier top using a nominal 6 weeks correction, a late June peak results, which is about right for a guess.
The unusual characteristic is that in an ongoing bullish trend like the 1990’s examples I presented earlier, Ts that start very softly often tend to finish on a strong note. I would hope that is going to be the case as we move through May and into June, but it may not occur unless the Fed pauses, etc. In any case, the Rate T tells us that a peaking in May would be too early under normal circumstances but a peak in July would be too good to be true. So I estimate we will see the peak in the second half of June.
Moving on to the next rate T low targeted specifically for early November, the “bad phase” is likely during October but the peak 6 weeks earlier is most likely in September. The close proximity of the twin projected lows make the next short range T potentially caught in a difficult situation, so I propose to switch my analysis to the Kemp criteria which should be at a more advanced by the end of Summer when we need it. If, as expected, an oversold condition well under the 55 day MA develops in July, the Kemp criteria may signal a trade-able low and the 10 day MA of the volume oscillator should signal an upturn whenever the market is ready. This saves us the task of finding the next T’s center post.
The new rally will generate a new short range T, but I would be inclined to simply look to the following overbought condition as a selling opportunity because it is again clearer from the standpoint of the Rate Ts, that any rally to a high level will almost immediately come at risk to the neighboring projected October low, which I would expect will produce the more oversold condition. Once we achieve a full oversold condition in the Fall, then I think the market will be ready to start a major new advance into the final A-D T peak at point D in the chart.
In summary then, a better way to look at bull market trends as projected by the right side of an A-D T is to simply assume the trend is bullish throughout the right side except of the roughly 6 week period that precedes any Rate T’s projected low date. Then refine the trend based on what you actually see developing.
Terry Laundry
Look for basing at S&P 1290
All equity sectors were hit hard into Friday May 12 on disappointment with the Fed’s apparent failure to suggest a pause in rate rises was in the works. I expect we are now forming a bottom pattern with a final recovery into early June.
Nevertheless the important technical action in the daily chart is that the S&P peaked at the upper channel bound and has fallen to the normal support level around 1290. In order for my forecast to play out we should see the S&P begin to dig in just under the support level. This process may take a few days so one should be patient to let a base near the S&P 1290 level develop first.
Once the base pattern has set the stage for a recovery rally I will post a full analysis of the next important phase which is a “sell” , targeted to avoid the next rate T’s projected fall into a late July/early August low. Gold is lagging the S&P by about 2 days
Terry Laundry
Comments May 18 2006
On Wednesday the 55 day MA was clearly violated on horrendous downside breadth and the major advance that began in October 2005 certainly appears to have ended.
The market will find an oversold conditions reasonably soon but the eventual lows call for by the Rate Ts, as discussed in earlier postings, don’t project important, fully developed lows until late July/early August or the late October/early November time periods. So I don’t believe near term rallies will last for any substantial period.
I am hanging onto my Gold investments in case a serious Global decline results, but the evidence so far is that Gold suffers on the downside whenever the general market does, so I expect to lose at least for a while. You may not want to. Nevertheless I trust the HUI Ts projection of continued strength and it is possible that the demand for Gold as a defensive investment may yet come about as a result of some future crisis. I will report on any interesting developments as we go forward.
As to the near future, I will turn to the full development of the Kemp criteria and post new charts illustrating its history with a few weeks. We will have it available in plenty of time to analyze the next oversold condition.
In the meantime keep in mind a precondition for any important buying opportunity by his criteria has been a very oversold condition in the daily volume oscillator as measured by a long term moving average of about 79 days.
So while it is true the volume oscillator has fallen to very oversold readings over the last few days, the historical criteria needed for a sustained low is a continued oversold condition that lasts some weeks so as to allow the slower moving longer term average readings to sink to a significant low. This requires persistent weakness so there is no reason to look for favorable buy points near term.
One other observation. Based on my 35 years of experience I feel the current situation is potentially very dangerous due to the globalization of investments despite the strong A-D T picture for the US market. What is developing right now seems to me to be what I saw in 1987 where the fundamentals were strong and remained so but investors began losing confidence and suddenly many decided to take their substantial accrued profits.
I don’t believe this kind of a panic sell off can originate in the US under present circumstances, but the ASIA emerging markets do have the big profits and a less sophisticated financial systems without many of the safe guards and circuit breakers we have.
So it might be possible to start a sell off in that geography that spreads around the globe and eventually impacts our market to produce a short lived panic sell-off before the A-D T restores the bullish trend into 2007.
Thus I would keep a close eye on the emerging markets for any signs of unusual weakness, remembering they are now the engine of growth, and any instability there could easily be reflected in a US market shock, and perhaps a complete reversal of the Feds present policy of raising rates, as they see an increasing recession risk.
At the extreme, such a series of events are probably remote, but its the only way I can see at this date of a way to clear out the big picture problem of of a big A-D T that needs an oversold condition to carry out its ultimate projection of an August/September 2007 major peak within in dynamic fashion from a major low in the Summer/Fall.
In any case their is no harm in being very defensive over the weeks ahead because the rate Ts are negative over the near term and their internal workings are based on concerns of rising rate which are probably the root cause of the present decline.
Terry Laundry
****************************************************************************************
All Rights Reserved By The T Theory® Foundation ©
Order the T Theory® Encyclopedia
For a complete understanding of the T Theory® and how to successfully use Terry’s unique methods, order the Encyclopedia from Paula at the above link. There is additional material in the encyclopedia not covered here. Paula will be more than happy to answer your questions too.
Many thanks to Paula Burke for her permission to re-post Terry’s old T Theory® explanations. The period re-blogged on these pages are some of Terry Laundry’s best work and was published here from public domain.
****************************************************************************************
I claim no credit for the material found under T Theory® on this blog. All of this material is the creation of Terry Laundry and was downloaded from Terry’s free blog site (TypePad). I have created a mirror of Terry’s original material and now there is a second site containing Terry’s T Theory®. One or both of these websites hopefully will survive through time as Terry’s material is too important to be lost to the ravages of time. This site is simply a memorial to his lifetime work.
The page content re-blogged here is exactly as Terry created on his original webpages (saved on my computer with ScrapBook)). Nothing has been left out from the period Dec 2003 to June 2011. From Terry’s site, I made a lot of formatting changes, creating a more easily readable webpage appearance. The PDF chart duplicates of the JPEGs have been omitted for ease and speed of recreating Terry’s pages. References to PDF charts should be ignored (but no chart was left out).
After June 2011, Terry created a paid subscription website. None of that material is found here.
There were many many, many hours spent on this project; downloading Terry’s individual charts & audio files, followed by the uploading of Terry’s charts and audio to my WordPress blog library, after which I had to insert the uploaded material into my new T Theory® webpages (hopefully in the correct places). This was a dull and arduous project and I hope you enjoy it. I don’t believe there remains any more of Terry’s material in free domain, so my T Theory® project is probably finished. If I’ve missed something, you can leave me a comment.
If you find an uploaded reference error (chart or audio in the wrong place), please note the month and year of the webpage, plus the exact name of the referenced error file. Include any other info that will help me locate the problem file and where it occurs on the webpage. Leave a comment for me with the info and I’ll fix it.
Terry’s material is very long and will take many weeks for you to finish. Don’t hurry, it’s not a marathon and you will absorb more if you go through it at a reasonable rate. This is especially true for those who don’t invest in the T Theory® reference encyclopedia. The encyclopedia is a written reference for T Theory® and includes everything of importance for Terry’s T Theory®. Without the reference encyclopedia you must depend on your memory and Terry’s method carries some rules that you could easily violate. The encyclopedia also includes new information never seen on his website.
You are welcome to save any or all of my blog material to your computer. You also have my permission to re-blog my information, but you must (1) credit me and my blog in an obvious manner and (2) don’t change my material.
FYI – I find the best way to save a webpage is using “ScrapBook” (it’s an add-on for the FireFox browser). ScrapBook saves a webpage to your computer EXACTLY as it appears on the day you saved it. You can’t tell the difference between the internet webpage and your ScrapBook saved webpage. The saved pages are not pictures. Instead the pages consist of HTML and page functionality remains identical on your computer. There is also a second method for using ScrapBook, where you can save all of the webpages down to a defined link depth. This optional method means all links will function on your computer to the link depth specified (meaning you can click on links on your saved webpages and tunnel down into pages within pages). Saving the normal way will only save the top webpage but the links that exist could continue to function by taking you to the website on the internet instead of on your computer. But sometimes the linked website doesn’t exist anymore. I’ve had this happen on some very good webpages with unique information (they just disappear into the internet void). That’s a bummer when you lost some really good info and thus rose my need for ScrapBook. You can also filter the pages saved using the optional ScrapBook method, which can exclude all pages not coming directly from the specified website (filtering is recommended using this method otherwise you wind up with a LOT of useless stuff).
.
Explore posts in the same categories: . . . T Theory®
Leave A Reply