June 2007 – T Theory® Update

June 25 2007
Short Range T Update- Friday’s sharp decline has brought the blue volume oscillator back down to an oversold condition from which a more extensive bullish oscillator rising bottoms pattern can be generated.
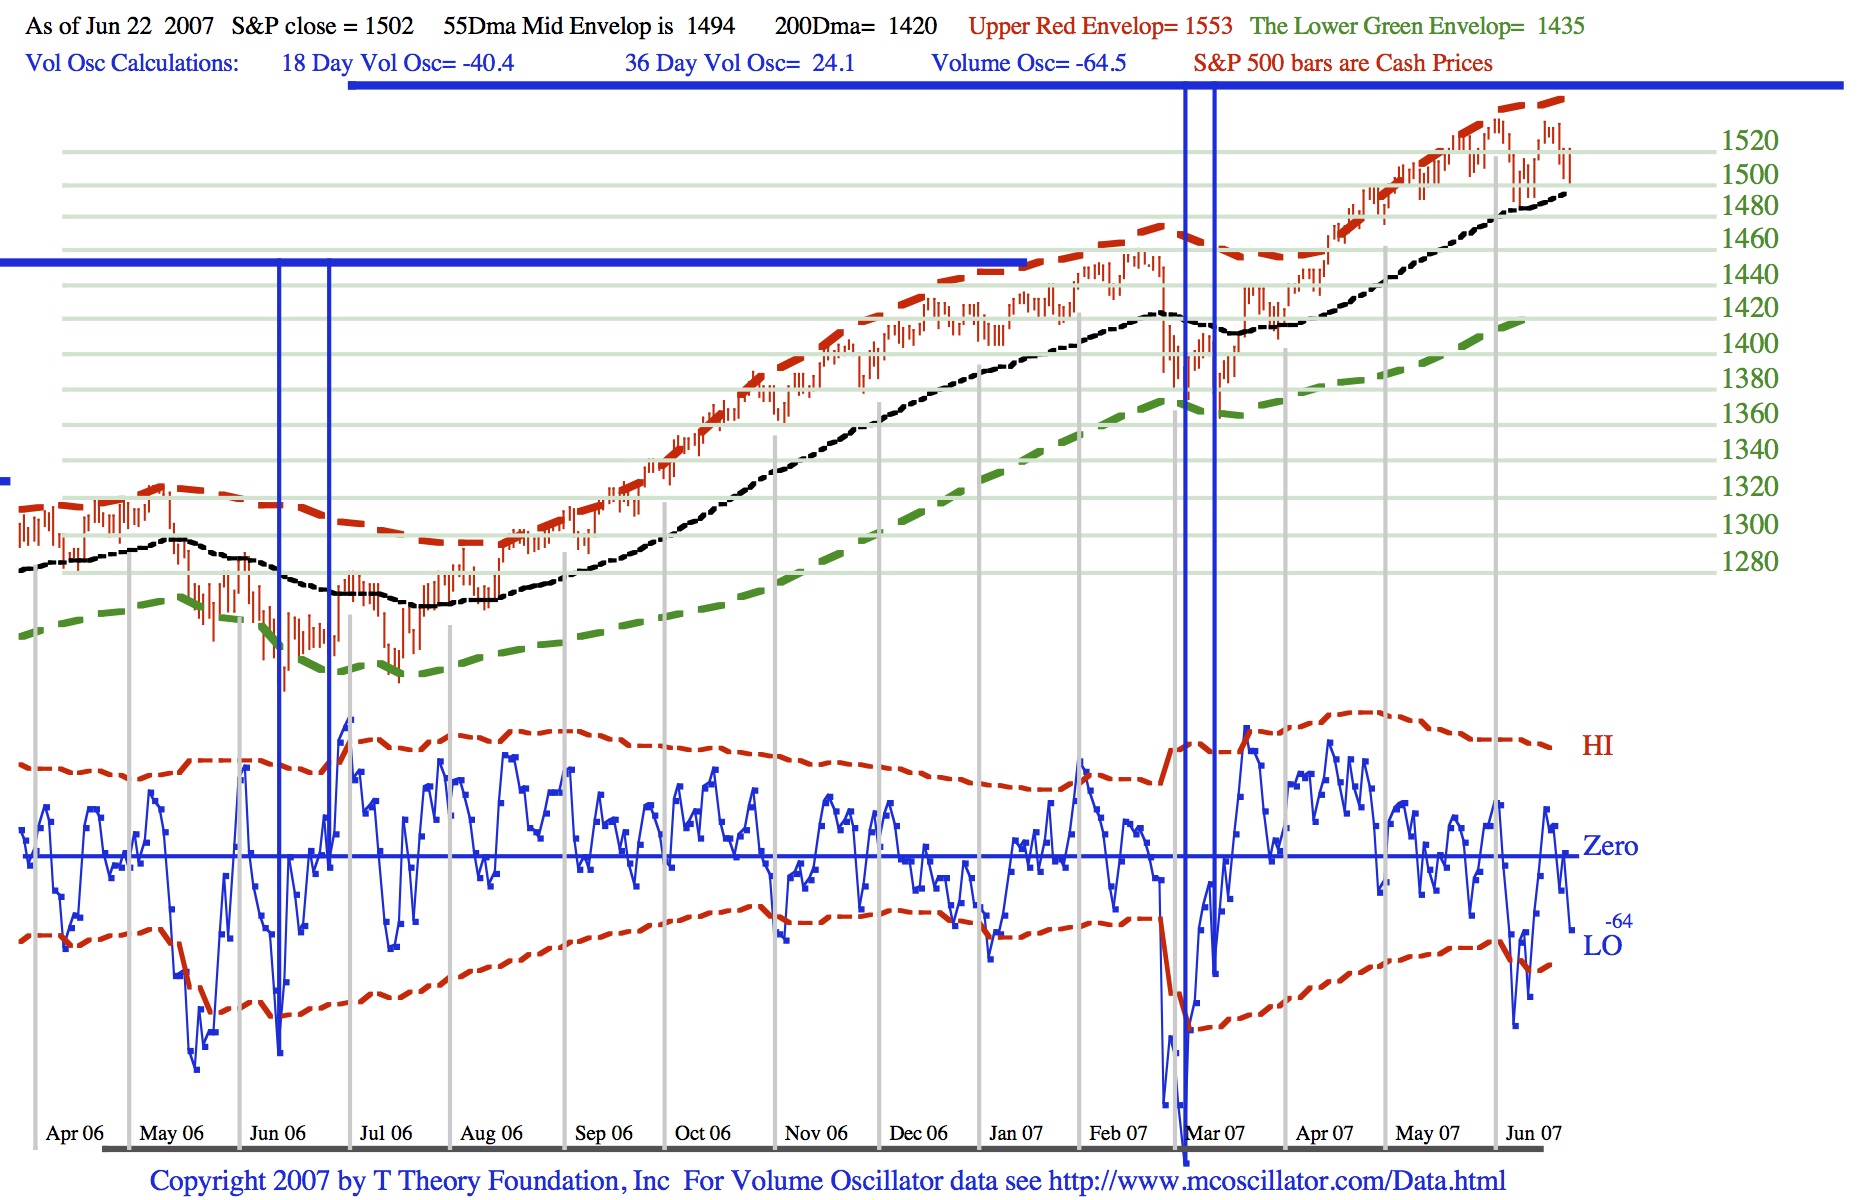
The only requirement to sustain the current Ts projection of strength into the late Fall is to see these corrections hold at the 55 Day Moving Average as noted in the chart by the mid channel black line. I expect this to occur with the T’s basic up trend renewed as we move into July. Next update July 2.
JUNE 18
2007 Short Range T Update- Last week’s recovery from the overbought condition can be seen in the PDF file below. Click on this link to see.
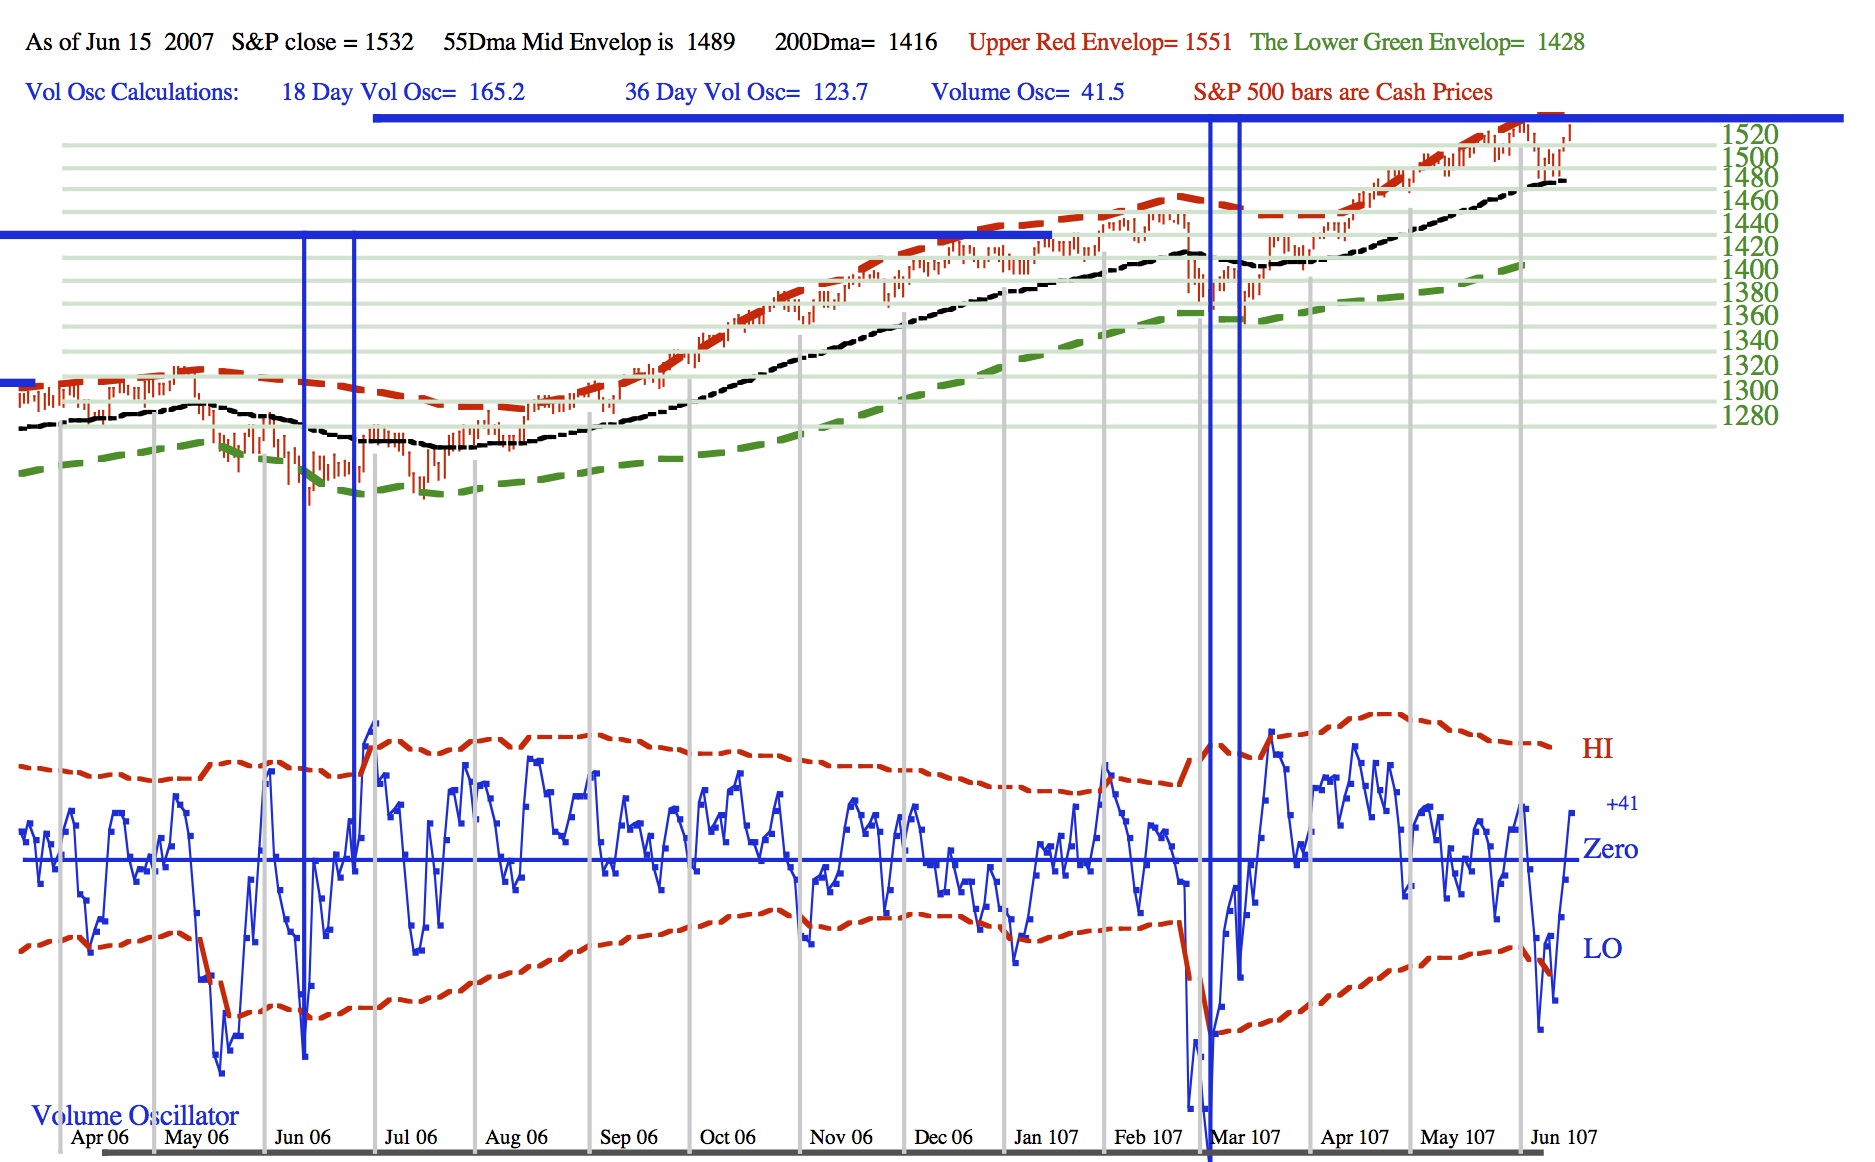
Note the rising bottoms in the lower plot as the Volume oscillator made a nice rising bottom on the second selloff last week. This is the most common way that daily calculation of the volume oscillator can be used to find buying opportunities. It usually signals a turning of the market’s momentum in an ongoing bull market.
The S&P’s turn back up within the right side of the current T should be sustainable going into the July new earnings reporting phase for the 2nd quarter, but I will post a weekly update of the chart on Mondays just to track this T’s progress. However longer term this T projects a run into a November peak. The right end of this T has been cut off by the chart limit, but its influence is long in time. How strong and speculative it becomes remains to be seen.
June 11 Update- Last week’s sharp correction from the overbought condition can be seen in the PDF file below. Click on this link to see.
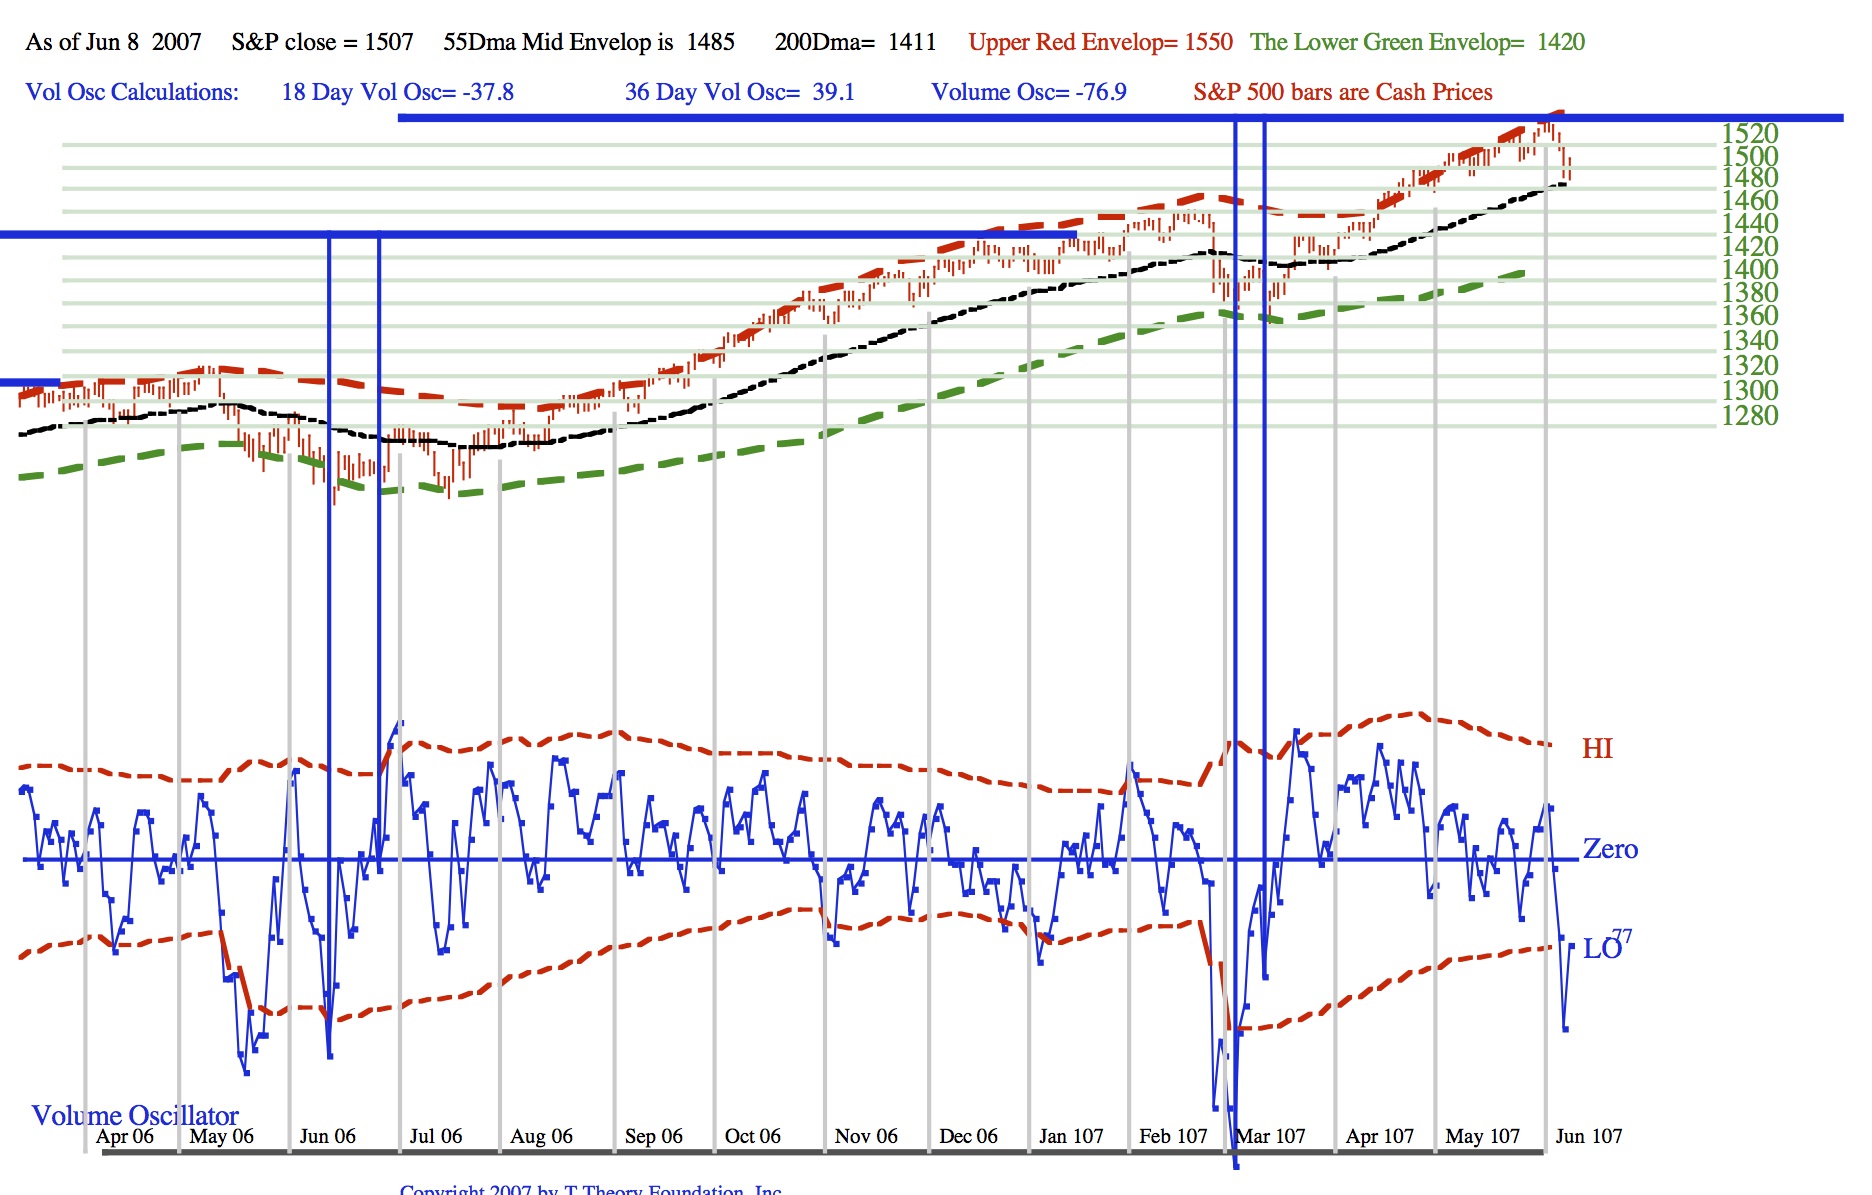
The Low ARMS ratio noted in my late May post, plus rising long term interest rates, triggered the sharp drop to the 55 day MA as you can see in the chart. It should act as support and we should see further basing along the MA (S&P 1485-ish) at the worst.
During June I will be discussing my key T Theory conclusion that the market advance into late Fall will result in a significant speculative equity market peak. More specifically my T Theory already claims history will conclude it will be an important from the standpoint of the very long term investor, so it is potentially a very important topic. I believe this is likely to occur by late Fall when the ongoing Ts that I have discussed earlier end their bullish outlook. But judging from history, in order to produce an important equity peak, the current up trend must sustain the kind of advance that encourages and attracts a unique speculative interest. This we need to see as the up trend unfolds.
The possibility of a major peak interests me most for the near term because it conforms to the Magic T Complex Theory concept that I developed in 1973 as laid out in my original publication, Principle of the Magic T. Today we are seeing sign of increased speculation in China’s Shanghai market which if continued might help to suggest such a speculative peak. Also we are seeing long term bearish observers of the equity market turning bullish on the major trend after many years of pessimism. For example, Richard Russell, the respected and long term interpreter of the Dow Theory from the 1950’s is now reportedly becoming optimistic on the long term out look for equities. At the same time my T Theory sees an important all time peak coming later this year. Should the general public adopt this bullish expectation of a very long term “new era” of growth for equities, then the T Theory Complex concept I discovered in 1973 will call for a much more severe economic/market decline than the two year post 2000 economic/market contraction. There are a number of ways to resolve this T Theory forecast and I will cover all of them in the weeks ahead so as to be ready from such an event.
To initially present and lay the groundwork for future discussions of my early background, using more advanced T Theory concepts, I have reproduced below a xerox copy of a 2 page announcement for my July 18th 1973 talk to a Technical Analyst group in San Francisco in which I discussed the time symmetry I discovered, and how it could be applied to the very long term trends of the market. The quality is poor, however the concept of the Trend Time Advance-Decline line at the bottom of the page 2 plot represents my final, and to this day, the most complete expression of T Theory. It remains my important thinking as it might apply to final speculative market peaks near term that could proceed major depressions. I will be delving into this topic over the next few months using more recent charts.
Next Monday June 11 I will post the next installment of this concept. Until then the current Short Range T appears to be progressing normally for an overbought condition. I will post a new daily chart when it becomes interesting. Terry Laundry
****************************************************************************************
All Rights Reserved By The T Theory® Foundation ©
Order the T Theory® Encyclopedia
For a complete understanding of the T Theory® and how to successfully use Terry’s unique methods, order the Encyclopedia from Paula at the above link. There is additional material in the encyclopedia not covered here. Paula will be more than happy to answer your questions too.
Many thanks to Paula Burke for her permission to re-post Terry’s old T Theory® explanations. The period re-blogged on these pages are some of Terry Laundry’s best work and was published here from public domain.
****************************************************************************************
I claim no credit for the material found under T Theory® on this blog. All of this material is the creation of Terry Laundry and was downloaded from Terry’s free blog site (TypePad). I have created a mirror of Terry’s original material and now there is a second site containing Terry’s T Theory®. One or both of these websites hopefully will survive through time as Terry’s material is too important to be lost to the ravages of time. This site is simply a memorial to his lifetime work.
The page content re-blogged here is exactly as Terry created on his original webpages (saved on my computer with ScrapBook)). Nothing has been left out from the period Dec 2003 to June 2011. From Terry’s site, I made a lot of formatting changes, creating a more easily readable webpage appearance. The PDF chart duplicates of the JPEGs have been omitted for ease and speed of recreating Terry’s pages. References to PDF charts should be ignored (but no chart was left out).
After June 2011, Terry created a paid subscription website. None of that material is found here.
There were many many, many hours spent on this project; downloading Terry’s individual charts & audio files, followed by the uploading of Terry’s charts and audio to my WordPress blog library, after which I had to insert the uploaded material into my new T Theory® webpages (hopefully in the correct places). This was a dull and arduous project and I hope you enjoy it. I don’t believe there remains any more of Terry’s material in free domain, so my T Theory® project is probably finished. If I’ve missed something, you can leave me a comment.
If you find an uploaded reference error (chart or audio in the wrong place), please note the month and year of the webpage, plus the exact name of the referenced error file. Include any other info that will help me locate the problem file and where it occurs on the webpage. Leave a comment for me with the info and I’ll fix it.
Terry’s material is very long and will take many weeks for you to finish. Don’t hurry, it’s not a marathon and you will absorb more if you go through it at a reasonable rate. This is especially true for those who don’t invest in the T Theory® reference encyclopedia. The encyclopedia is a written reference for T Theory® and includes everything of importance for Terry’s T Theory®. Without the reference encyclopedia you must depend on your memory and Terry’s method carries some rules that you could easily violate. The encyclopedia also includes new information never seen on his website.
You are welcome to save any or all of my blog material to your computer. You also have my permission to re-blog my information, but you must (1) credit me and my blog in an obvious manner and (2) don’t change my material.
FYI – I find the best way to save a webpage is using “ScrapBook” (it’s an add-on for the FireFox browser). ScrapBook saves a webpage to your computer EXACTLY as it appears on the day you saved it. You can’t tell the difference between the internet webpage and your ScrapBook saved webpage. The saved pages are not pictures. Instead the pages consist of HTML and page functionality remains identical on your computer. There is also a second method for using ScrapBook, where you can save all of the webpages down to a defined link depth. This optional method means all links will function on your computer to the link depth specified (meaning you can click on links on your saved webpages and tunnel down into pages within pages). Saving the normal way will only save the top webpage but the links that exist could continue to function by taking you to the website on the internet instead of on your computer. But sometimes the linked website doesn’t exist anymore. I’ve had this happen on some very good webpages with unique information (they just disappear into the internet void). That’s a bummer when you lost some really good info and thus rose my need for ScrapBook. You can also filter the pages saved using the optional ScrapBook method, which can exclude all pages not coming directly from the specified website (filtering is recommended using this method otherwise you wind up with a LOT of useless stuff).
.
Explore posts in the same categories: . . . T Theory®
Leave A Reply