January 2010 – T Theory® Update

…Of everything I read Terry Laundry’s Magic T Theory made the most sense to me. …Terry was an eccentric genius living out on Nantucket Island. He was a fellow Marine, a jughead, who’d graduated from MIT and was now using his considerable engineering skills to analyze the market. Terry believed that the market spent the same amount of time going up as it did going down…When you look at the letter T, hence, the Magic T Theory…With the Magic T there was order in the universe a high and low tide every…The Magic T and I became as one.
– Marty Schwartz, legendary trader and author of the “Pit Bull”
Update for Sunday January 31 2010.
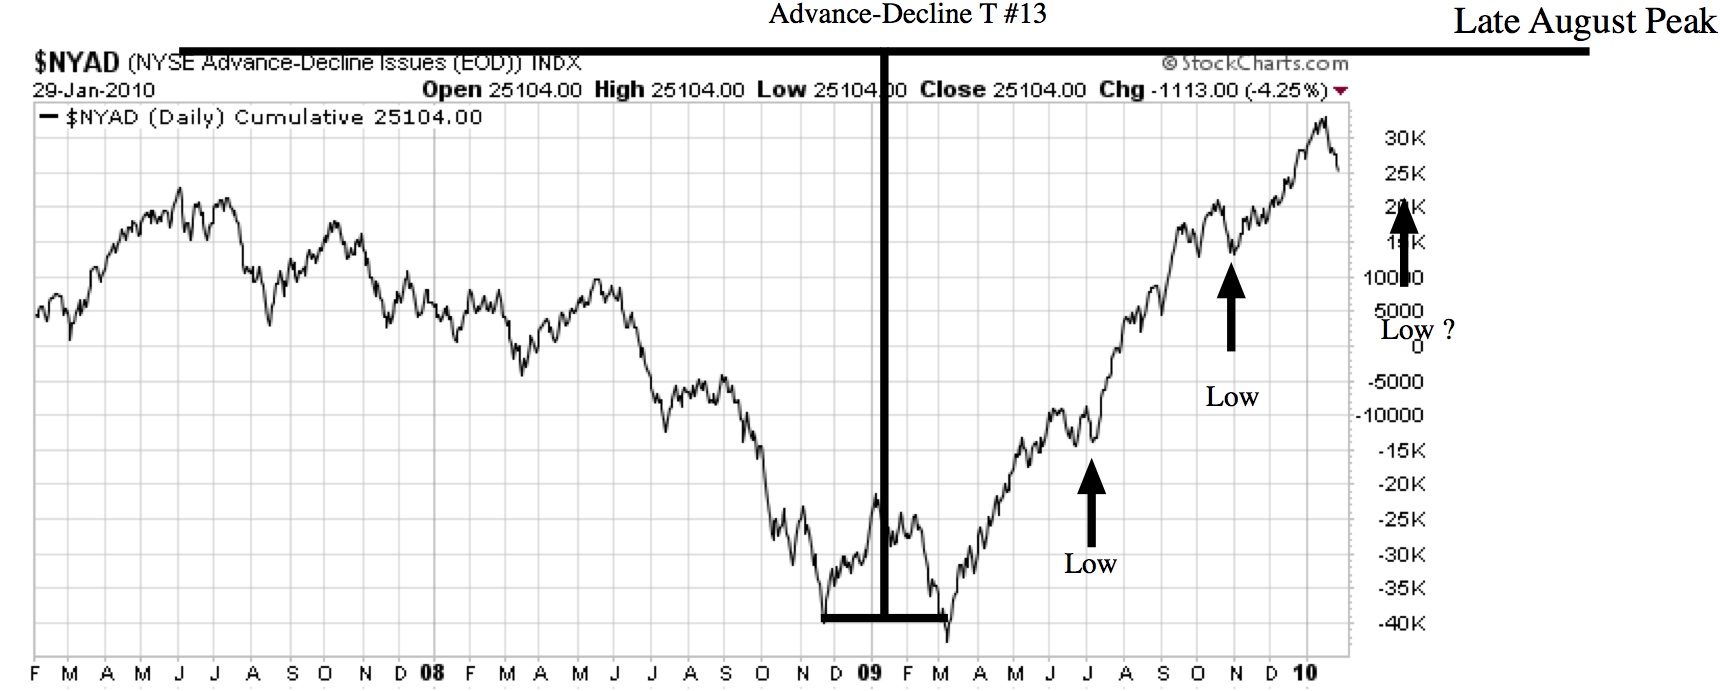
This week I summarize the status of the ongoing bullish Advance-Decline T#13 and the current correction. Open the PDF Chart below and listen to the accompanying audio file.
Audio CommentaryDownload
Download Advance-Decline T#13 Status
Update for Sunday January 24 2010.
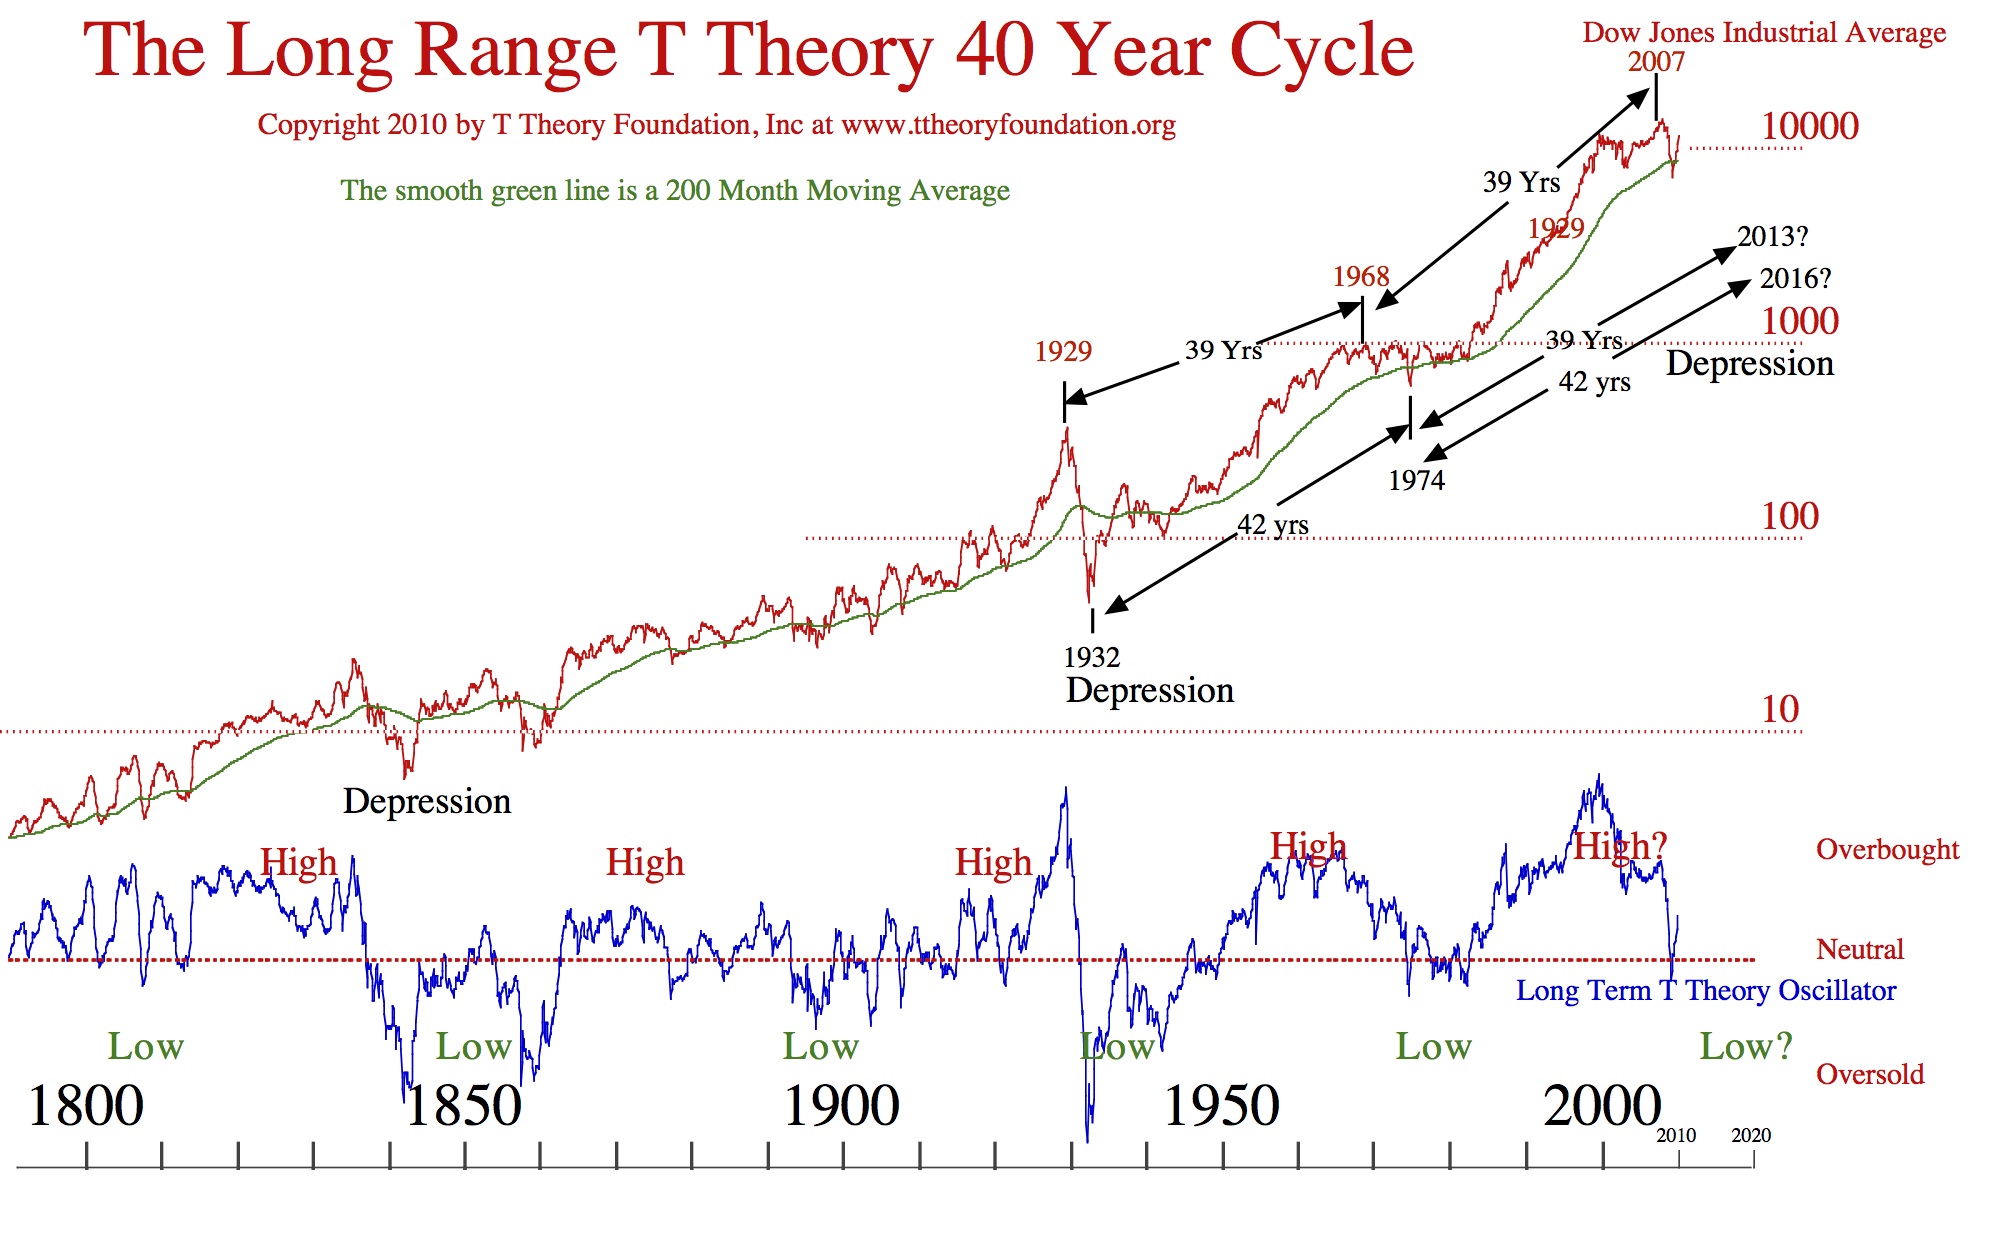
This week I summarize my current T Theory project on the 40 Year Cycle as it applies to the coming Depression. Open the PDF Chart below and listen to the two audio files that refer it it.
Chart Download 40YCycleDepressions with first Audio Commentary
Update for Sunday January 17 2010.
This week I summarize my current Company project on the Best Bond Strategy in the following text. Next week I hope to get the 40 Year Cycle Article completed then I can do a commentary on the combined picture for the next bear market.
ASIC’s Proprietary “Best Bond Strategy™”
By the year 2000 my T theory forecast had concluded the era of great growth during the 1980s and 1990s had reached a dangerous over extended condition with great risk to equities for some years to come. In response, I spent the following years devising a new, more conservative bond investment strategy which has become unique to our company. It is derived from the Confidence Index, devised and maintained by Barrons Financial and has been published for many decades as a basic indicator of investor confidence in the future economic outlook. We call ASIC’s interpretation of its logic the “Best Bond Strategy”. Its annual back performance since 2000 is summarized in the table below.
The Barrons Confidence Index is derived from the bond investors basic need to choose between a higher yield, but riskier, low quality bond that promises a greater income return, or alternatively, choosing a safer, higher quality bond that promises default protection in hard times but which necessarily provides a lower yield. The Confidence Index monitors ongoing investor preference between these two options. Thus the trend of this indicator provides an insight as to investor confidence as the bond market judges the relative future prospects for these alternatives. This process is constantly being re-evaluated by bond investors in light of ongoing economic developments, thus a dynamic and insightful indicator can result.
In our program we simplify these two basic choices to either the Fidelity Capital and Income fund, a high yield, well managed bond fund of lower quality, but which the fund manager thinks can ultimately survive economic setbacks, or alternatively to a very high quality Vanguard US Government long term bond fund that places safety above current yield. My business partner Paula Burke spends much of her time evaluating the relative performance of these two alternatives and her conclusion is that Fidelity Capital and Income provides the best low quality high yield fund for our program while the Vanguard organization provides the best and most efficient, safe alternative with either the Vanguard Long Term or Vanguard Intermediate Term US Government bond fund.
Its basic operation is to own the safer, lower yielding Vanguard US Government Bonds when confidence in the economic outlook is declining, then switching to the higher yielding Fidelity Capital and Income once the Federal Reserve makes it clear they are committed to pulling the economy out of a crisis situation.

As noted in the Table above the Total Return for the S&P 500 benchmark, which includes gains/losses plus dividends has over the last decade, returned a disappointing average return (1.1%). This has resulted from the recent gross over valuation of equities, the failure for regulator to limit past speculative practices, the general inability of the US economy to compete with Asia, and the US preoccupation with running up ever increasing debts which it can ill afford.
In contrast, we see the average returns over this same period for the either of the two bond alternatives to be far more attractive. If one had implicit faith in the management of Fidelity’s Capital and Income (whose symbol is FAGIX) to prosper long term no matter what the negative economic consequences going forward, then the average performance of FAGIX since 2000 looks to be quite attractive (9.9%) relative to equities (1.1%). On the other hand if one were ultra conservative, the Vanguard Long Term US government Bond fund would have provided an alternative superior average return (7.9%) although not as high over this period as the lower quality fund Capital and Income return.
This divergence is not unexpected. As a general rule it is always true, when viewed over sufficient time, that if one seeks safety and security above all other considerations, one must accept a lower return as the price for “sleeping at night”. Our first principle is that not that one kind of bond is superior to the other going forward, as there is room for both considerations because both look to be superior. Rather the over-riding consideration is that there is an alternative approach to the common equity investment for growth that we used in our early decades. Our program makes use of these two types of bonds. It is not a simple income approach as can be seen by the best Bond Total Return (21.6%) when the better of the two alternatives is selected retrospectively for any one year.
There are important points to note for the 10 year average total return for the Best Bond. First is a retrospective view, second its results are not guaranteed, and third it does not require trading within a one year holding pattern. Because it is retrospective it should be noted that the selection of which fund we use in our program is dictated by my T Theory which involves time symmetries in the chart below of Fidelity Capital and Income’s price movements over the last 12 years. These time symmetries are represented by the graphical Ts which essentially conclude the the period of maximum price appreciation of the fund coming out of any major low has to be equal to the period of prior decline.

So for example, T#1 has its graphical pattern fixed by the decline from the early 2000 peak down to the late 2002 bottom pattern. This defines the time span that becomes the left side of the T. In 1973 I discovered that the duration of the subsequent advance must last an equal time period to the point of maximum appreciation rate. So the Time symmetrical T forecasts a peak in the funds price in early 2005. It is true the fund price moved higher into late 2007, but the maximum rate of price appreciation was completed in the equal time requirement of T Theory.
T # 2 develops along similar lines except the duration of the decline was shorter, so the projected up time ends rather quickly in August 2010. (Click on the image to get the full view) In our program that means by the end of this coming summer we will have sold our Fidelity Capital and Income holdings after capturing the maximum price appreciation that T Theory sees as likely. By September 2010 we will be invested primarily in the highest quality US Government bonds until the next attractive opportunity presents itself.
In general, the direction of this fund price tracks the Barons Confidence Indicator reasonably well. That is, a declining trend in the price FAGIX parallels a decline in investor confidence as bond investors, fearful of the economic future, move more of their income investments away from the riskier low quality bonds to the relative safety of the higher quality alternatives. In the event of a serious loss of confidence, such as occurred at the center of both Ts, extreme concern can depress the fund to the point that its indicated yield rises above 10% per annum to 15% per annum or so.
At these major price lows the fear of lower quality bond default keeps bond investors at bay, but in time all recessions end, and at some point these very high yields can be captured in our program by converting the high quality US bond assets which have appreciated during this period of declining confidence, into a very high yielding investment which has high capital appreciation potential once the crisis blows over. This process is basically how our “Best Bond” program operates over the very long term assuming an ongoing systemic bond default risks exist.
Terry Laundry
Update for Sunday January 10 2010.
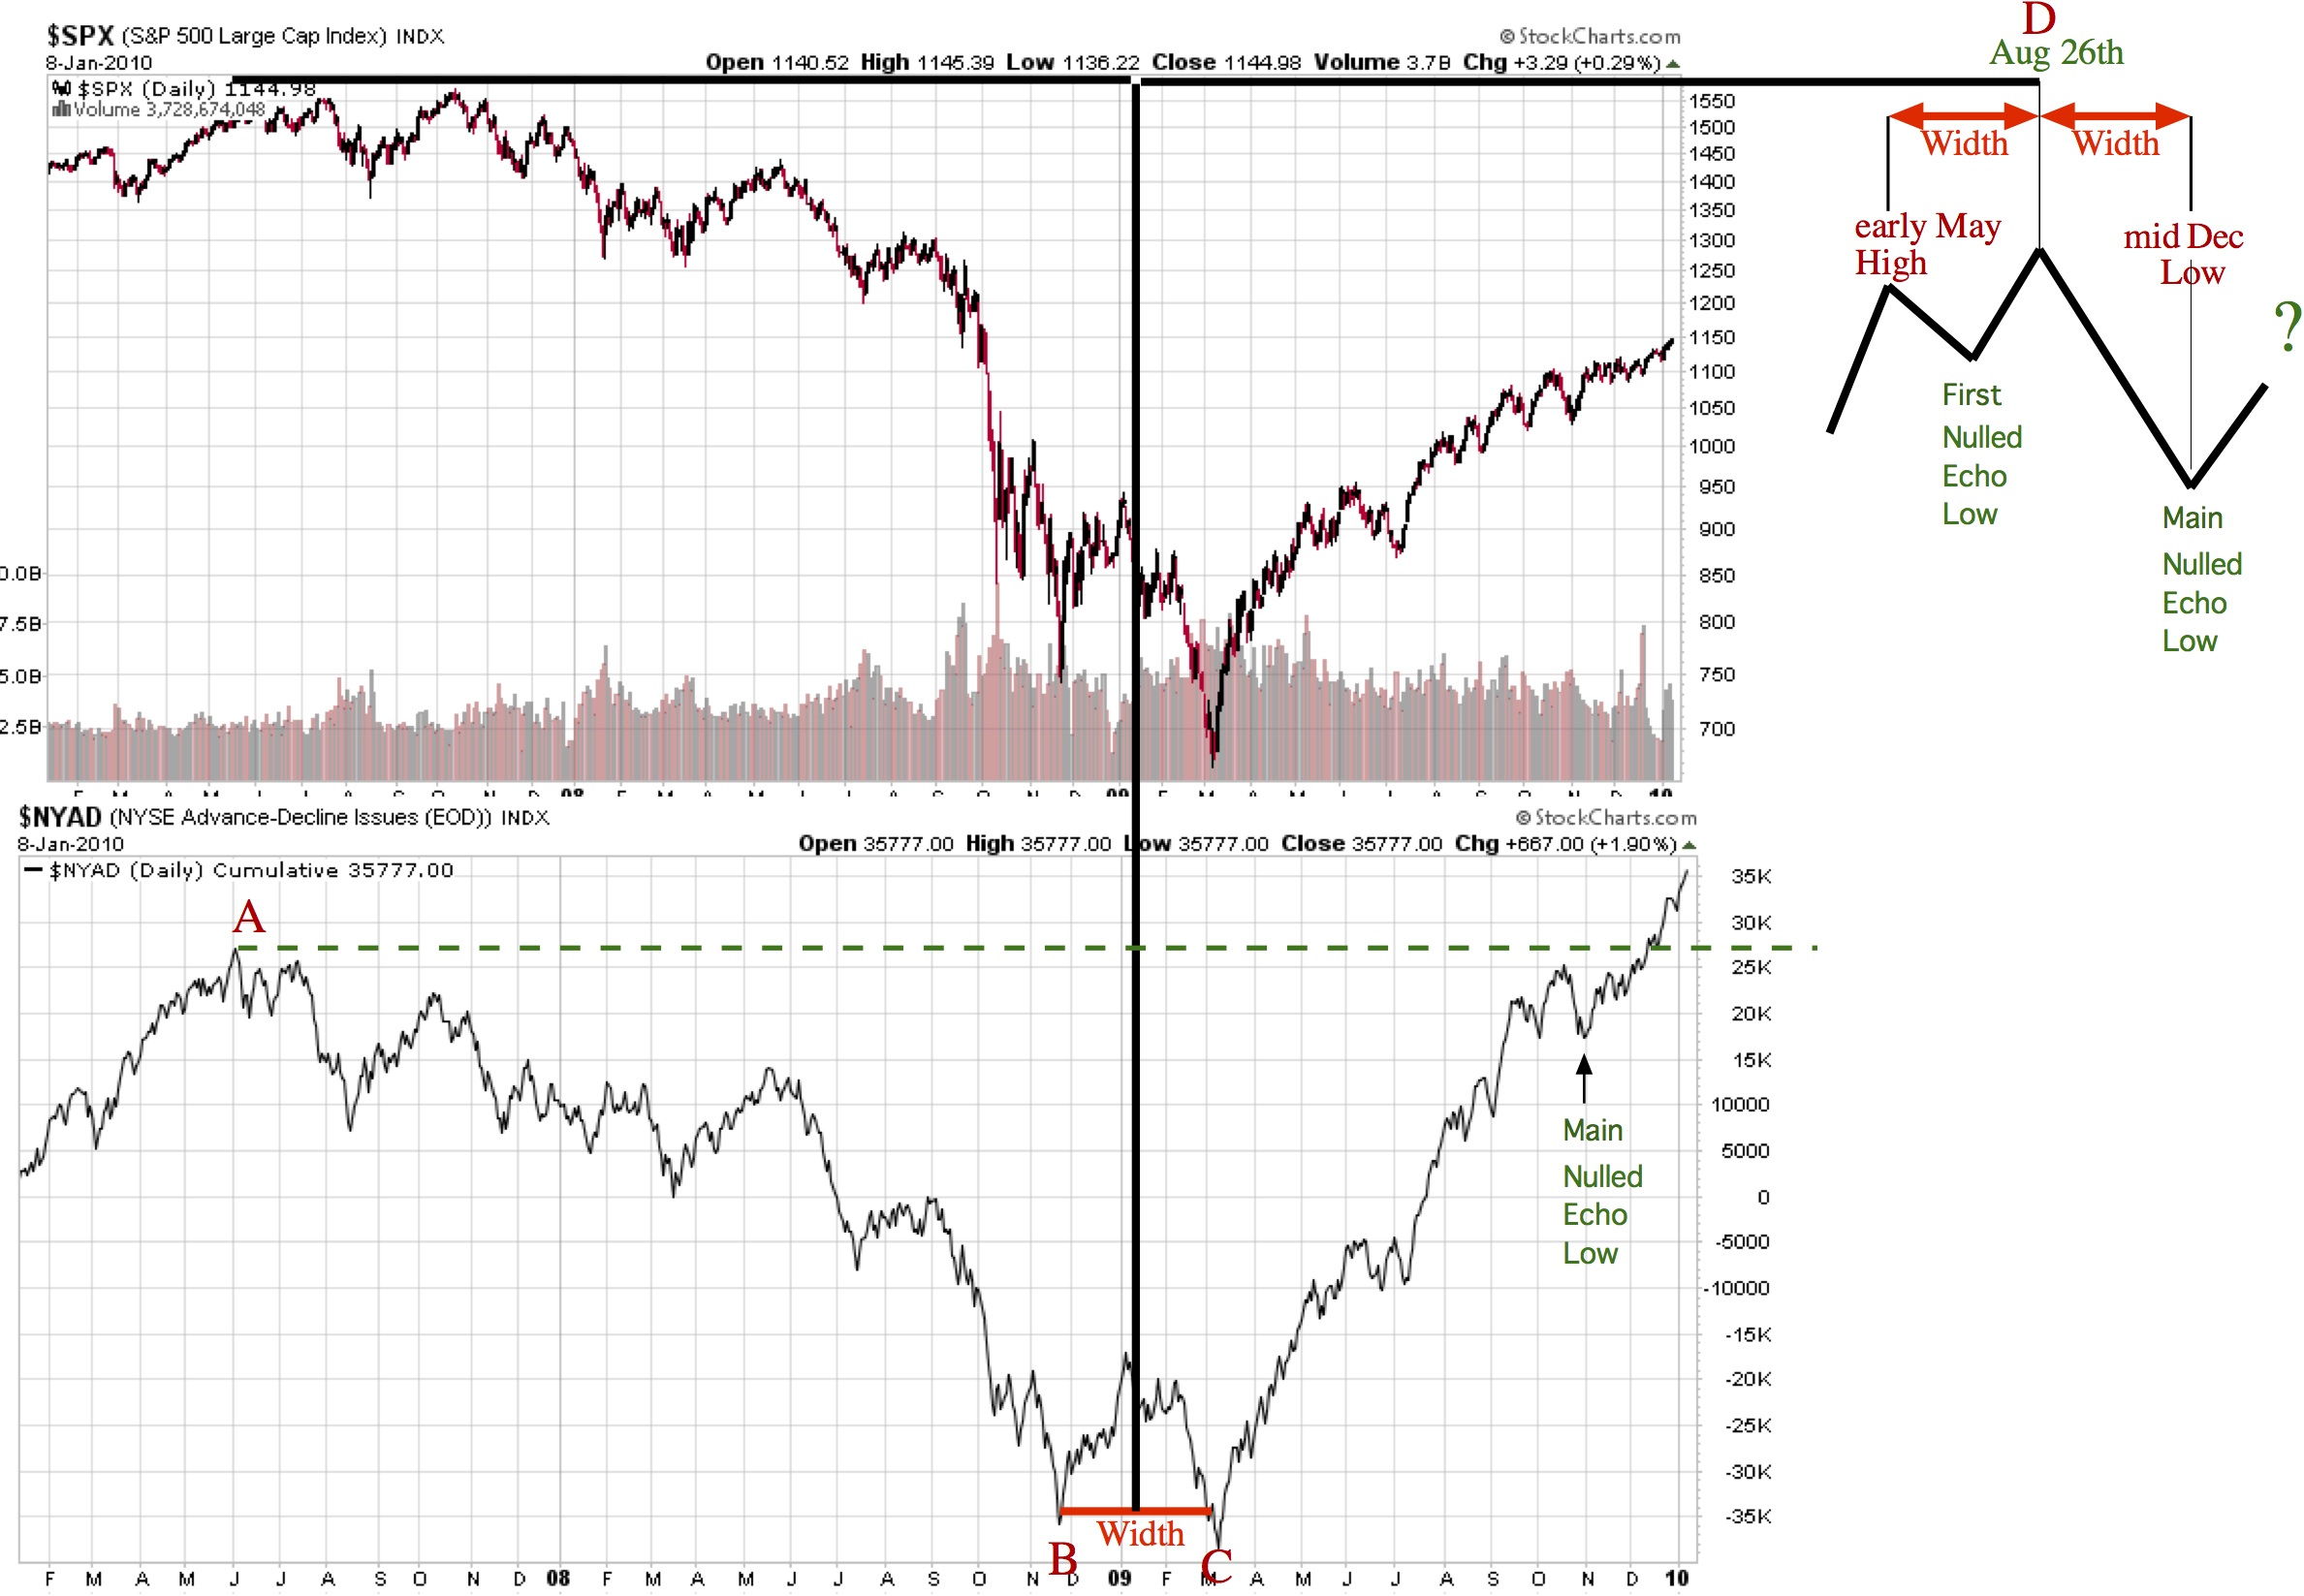
This week I summarize the long term outlook and introduce a new T Theory concept called the “null echo” in order to better lay out the details of my 2010 forecast. In the second audio topic I describe some new short term projects of interest to traders.
As always it is best if you first click on the audio file below and get it started, then put it into the background, then open a new window in your browser and pop open the PDF chart in the new window to follow the chart’s in-progress audio discussion.
Today’s PDF Chart Download ADTvsSPXnull100108
First Topic Audio Download TTO20100110A
Second Topic Audio Download TTO20100110B
Update for Sunday January 3 2010.
Happy New Year. This week and next week I will be spending most of my time updating the year-end data at American Shareholders OnLine. Our Managed accounts gained 40% for the calendar year with very low volatility based on my “Best Bond” strategy. Part of my updating for the new year requires reviewing this key approach to accommodate the current Advance-Decline Ts projection of a major August 2010 equity peak as the logical endpoint of the rally from the March 2009 low. This very long term view will become the basis for a whole new strategy needed to accommodate the next Bear Market.
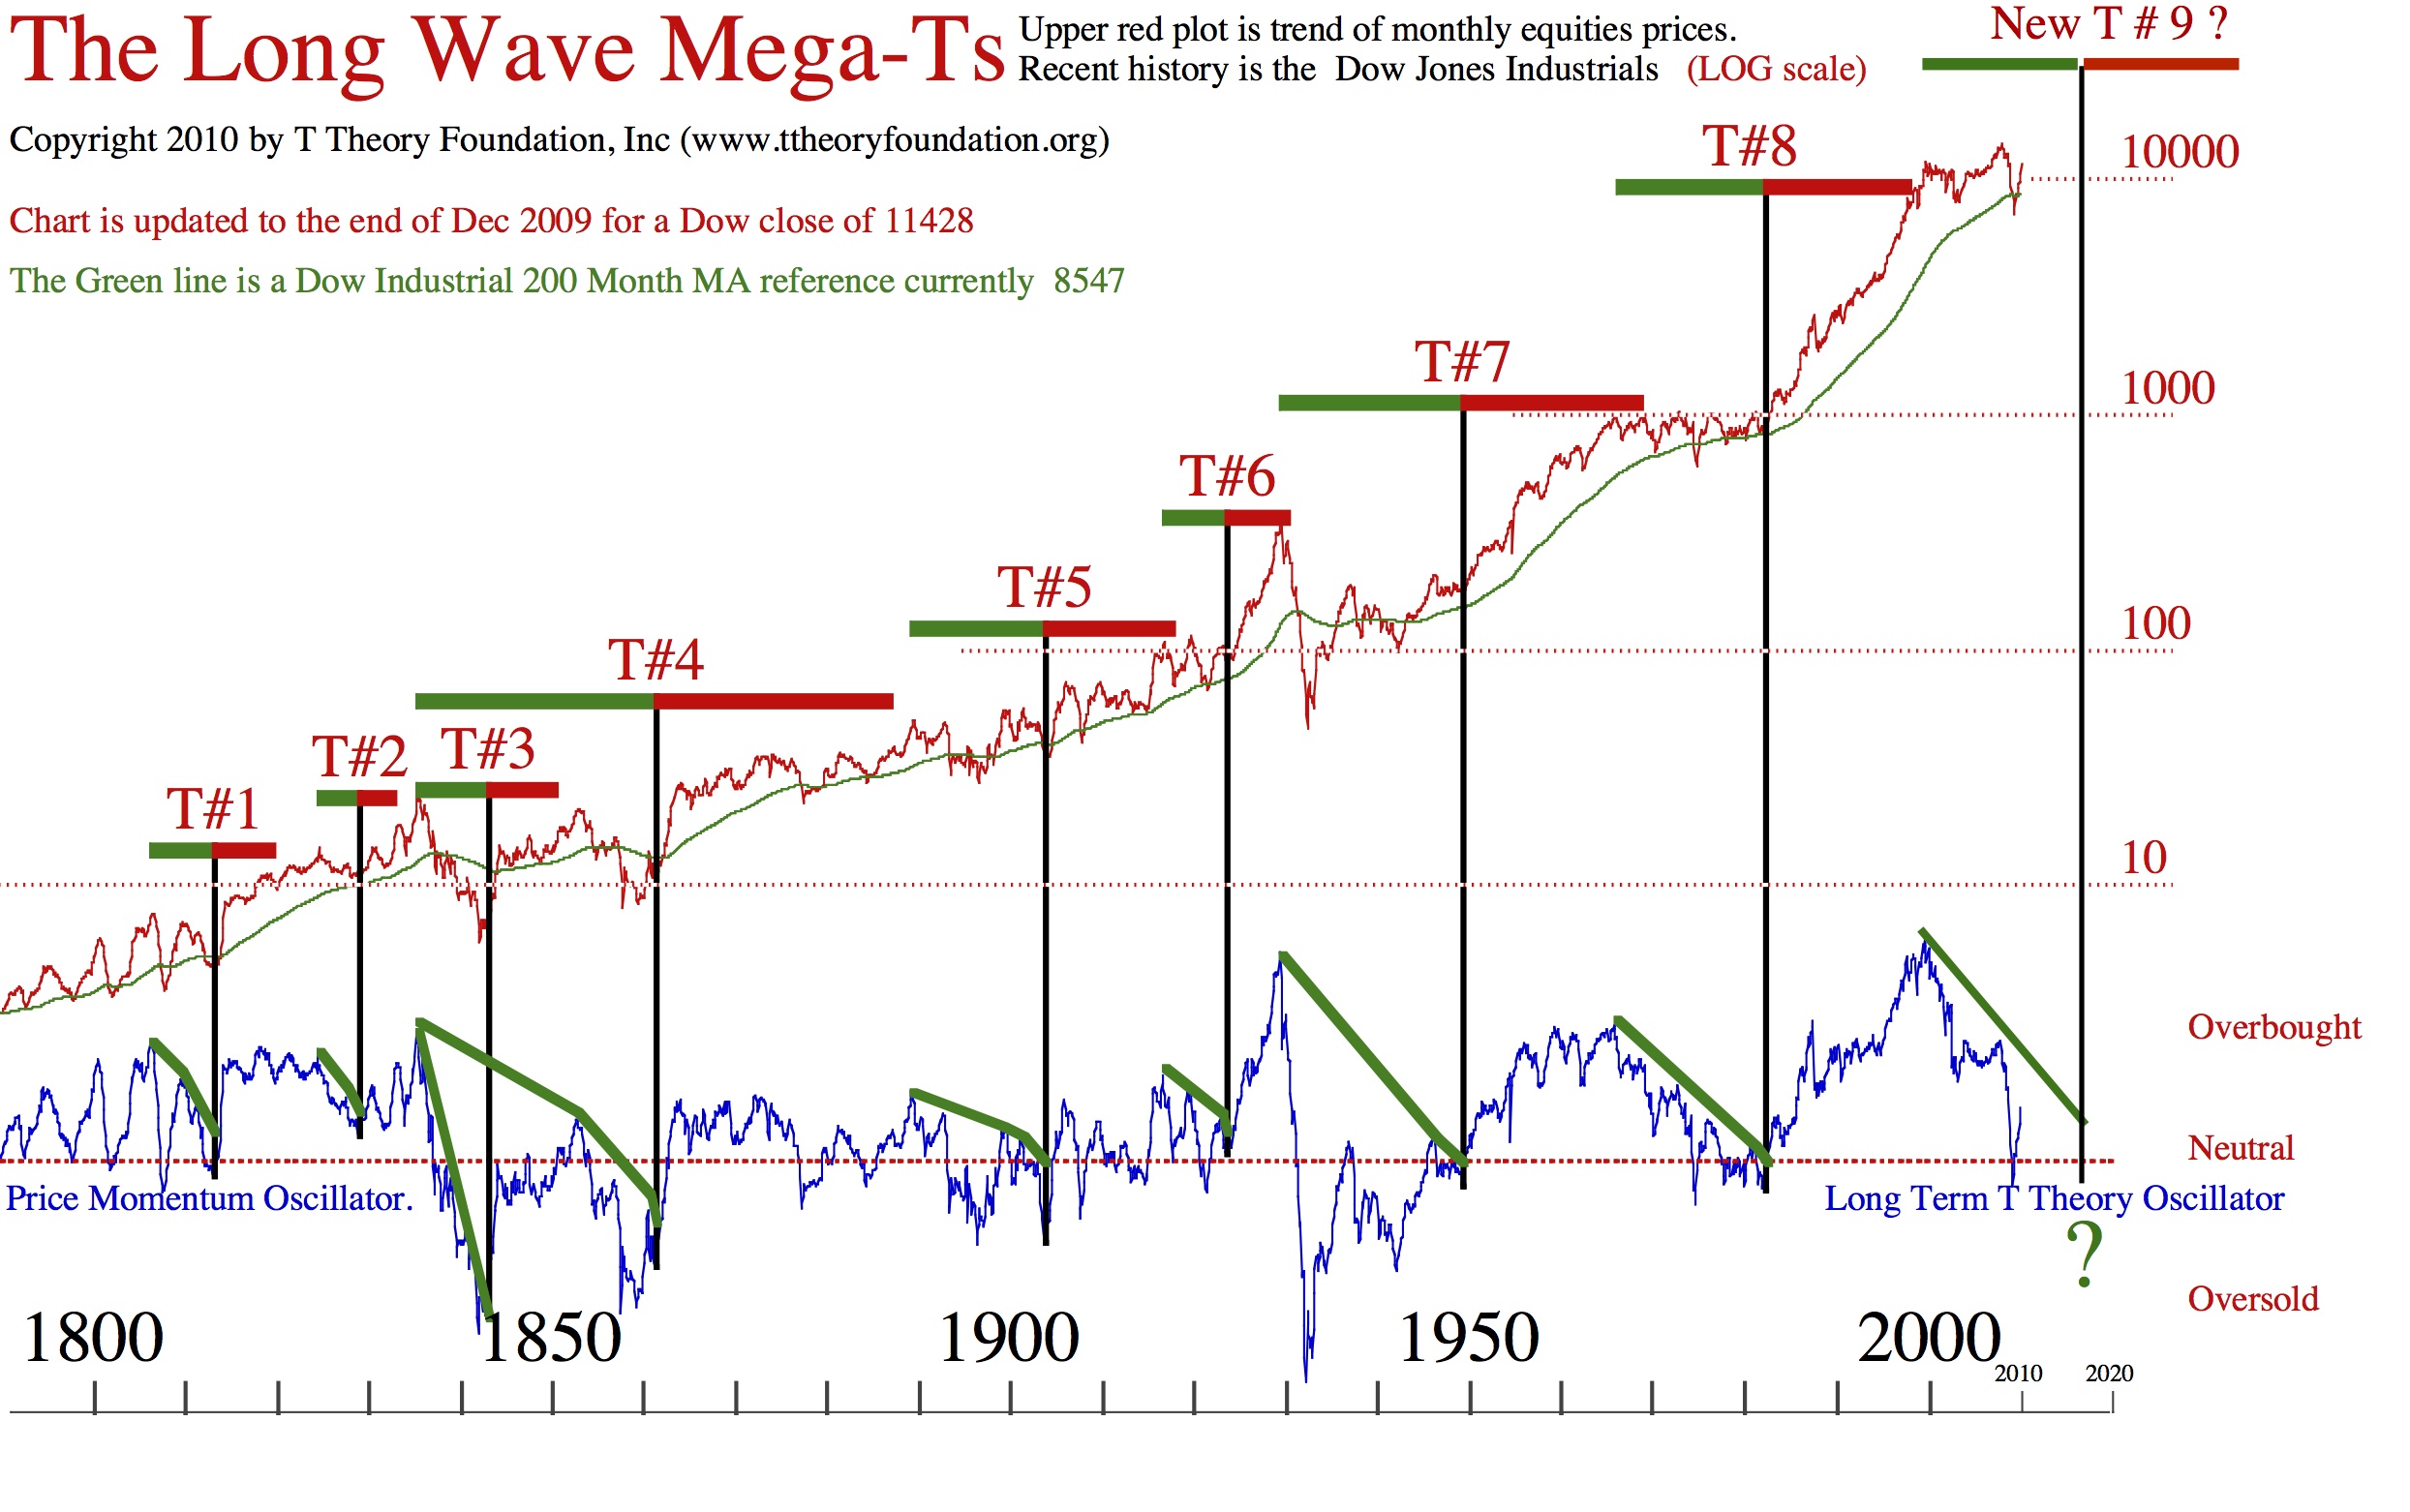
So this week my single topic is consideration of my Longest Range MegaTs which provides the necessary 10 to 20 year perspective to prepare us for the next bear market. This equity decline should last from the current projected August 2010 major peak to the next 40 year cycle low expected around 2013.
To view this discussion it is best if you first click on the audio file below and get it started, then put it into the background, then open a new window in your browser and pop open the PDF chart in the new window to follow the chart’s in-progress audio discussion.
Open Audio Commentary
****************************************************************************************
All Rights Reserved By The T Theory® Foundation ©
Order the T Theory® Encyclopedia
For a complete understanding of the T Theory® and how to successfully use Terry’s unique methods, order the Encyclopedia from Paula at the above link. There is additional material in the encyclopedia not covered here. Paula will be more than happy to answer your questions too.
Many thanks to Paula Burke for her permission to re-post Terry’s old T Theory® explanations. The period re-blogged on these pages are some of Terry Laundry’s best work and was published here from public domain.
****************************************************************************************
I claim no credit for the material found under T Theory® on this blog. All of this material is the creation of Terry Laundry and was downloaded from Terry’s free blog site (TypePad). I have created a mirror of Terry’s original material and now there is a second site containing Terry’s T Theory®. One or both of these websites hopefully will survive through time as Terry’s material is too important to be lost to the ravages of time. This site is simply a memorial to his lifetime work.
The page content re-blogged here is exactly as Terry created on his original webpages (saved on my computer with ScrapBook)). Nothing has been left out from the period Dec 2003 to June 2011. From Terry’s site, I made a lot of formatting changes, creating a more easily readable webpage appearance. The PDF chart duplicates of the JPEGs have been omitted for ease and speed of recreating Terry’s pages. References to PDF charts should be ignored (but no chart was left out).
After June 2011, Terry created a paid subscription website. None of that material is found here.
There were many many, many hours spent on this project; downloading Terry’s individual charts & audio files, followed by the uploading of Terry’s charts and audio to my WordPress blog library, after which I had to insert the uploaded material into my new T Theory® webpages (hopefully in the correct places). This was a dull and arduous project and I hope you enjoy it. I don’t believe there remains any more of Terry’s material in free domain, so my T Theory® project is probably finished. If I’ve missed something, you can leave me a comment.
If you find an uploaded reference error (chart or audio in the wrong place), please note the month and year of the webpage, plus the exact name of the referenced error file. Include any other info that will help me locate the problem file and where it occurs on the webpage. Leave a comment for me with the info and I’ll fix it.
Terry’s material is very long and will take many weeks for you to finish. Don’t hurry, it’s not a marathon and you will absorb more if you go through it at a reasonable rate. This is especially true for those who don’t invest in the T Theory® reference encyclopedia. The encyclopedia is a written reference for T Theory® and includes everything of importance for Terry’s T Theory®. Without the reference encyclopedia you must depend on your memory and Terry’s method carries some rules that you could easily violate. The encyclopedia also includes new information never seen on his website.
You are welcome to save any or all of my blog material to your computer. You also have my permission to re-blog my information, but you must (1) credit me and my blog in an obvious manner and (2) don’t change my material.
FYI – I find the best way to save a webpage is using “ScrapBook” (it’s an add-on for the FireFox browser). ScrapBook saves a webpage to your computer EXACTLY as it appears on the day you saved it. You can’t tell the difference between the internet webpage and your ScrapBook saved webpage. The saved pages are not pictures. Instead the pages consist of HTML and page functionality remains identical on your computer. There is also a second method for using ScrapBook, where you can save all of the webpages down to a defined link depth. This optional method means all links will function on your computer to the link depth specified (meaning you can click on links on your saved webpages and tunnel down into pages within pages). Saving the normal way will only save the top webpage but the links that exist could continue to function by taking you to the website on the internet instead of on your computer. But sometimes the linked website doesn’t exist anymore. I’ve had this happen on some very good webpages with unique information (they just disappear into the internet void). That’s a bummer when you lost some really good info and thus rose my need for ScrapBook. You can also filter the pages saved using the optional ScrapBook method, which can exclude all pages not coming directly from the specified website (filtering is recommended using this method otherwise you wind up with a LOT of useless stuff).
.
Explore posts in the same categories: . . . T Theory®
Leave A Reply