February 2009 – T Theory® Update

Update for Monday February 23 2009.

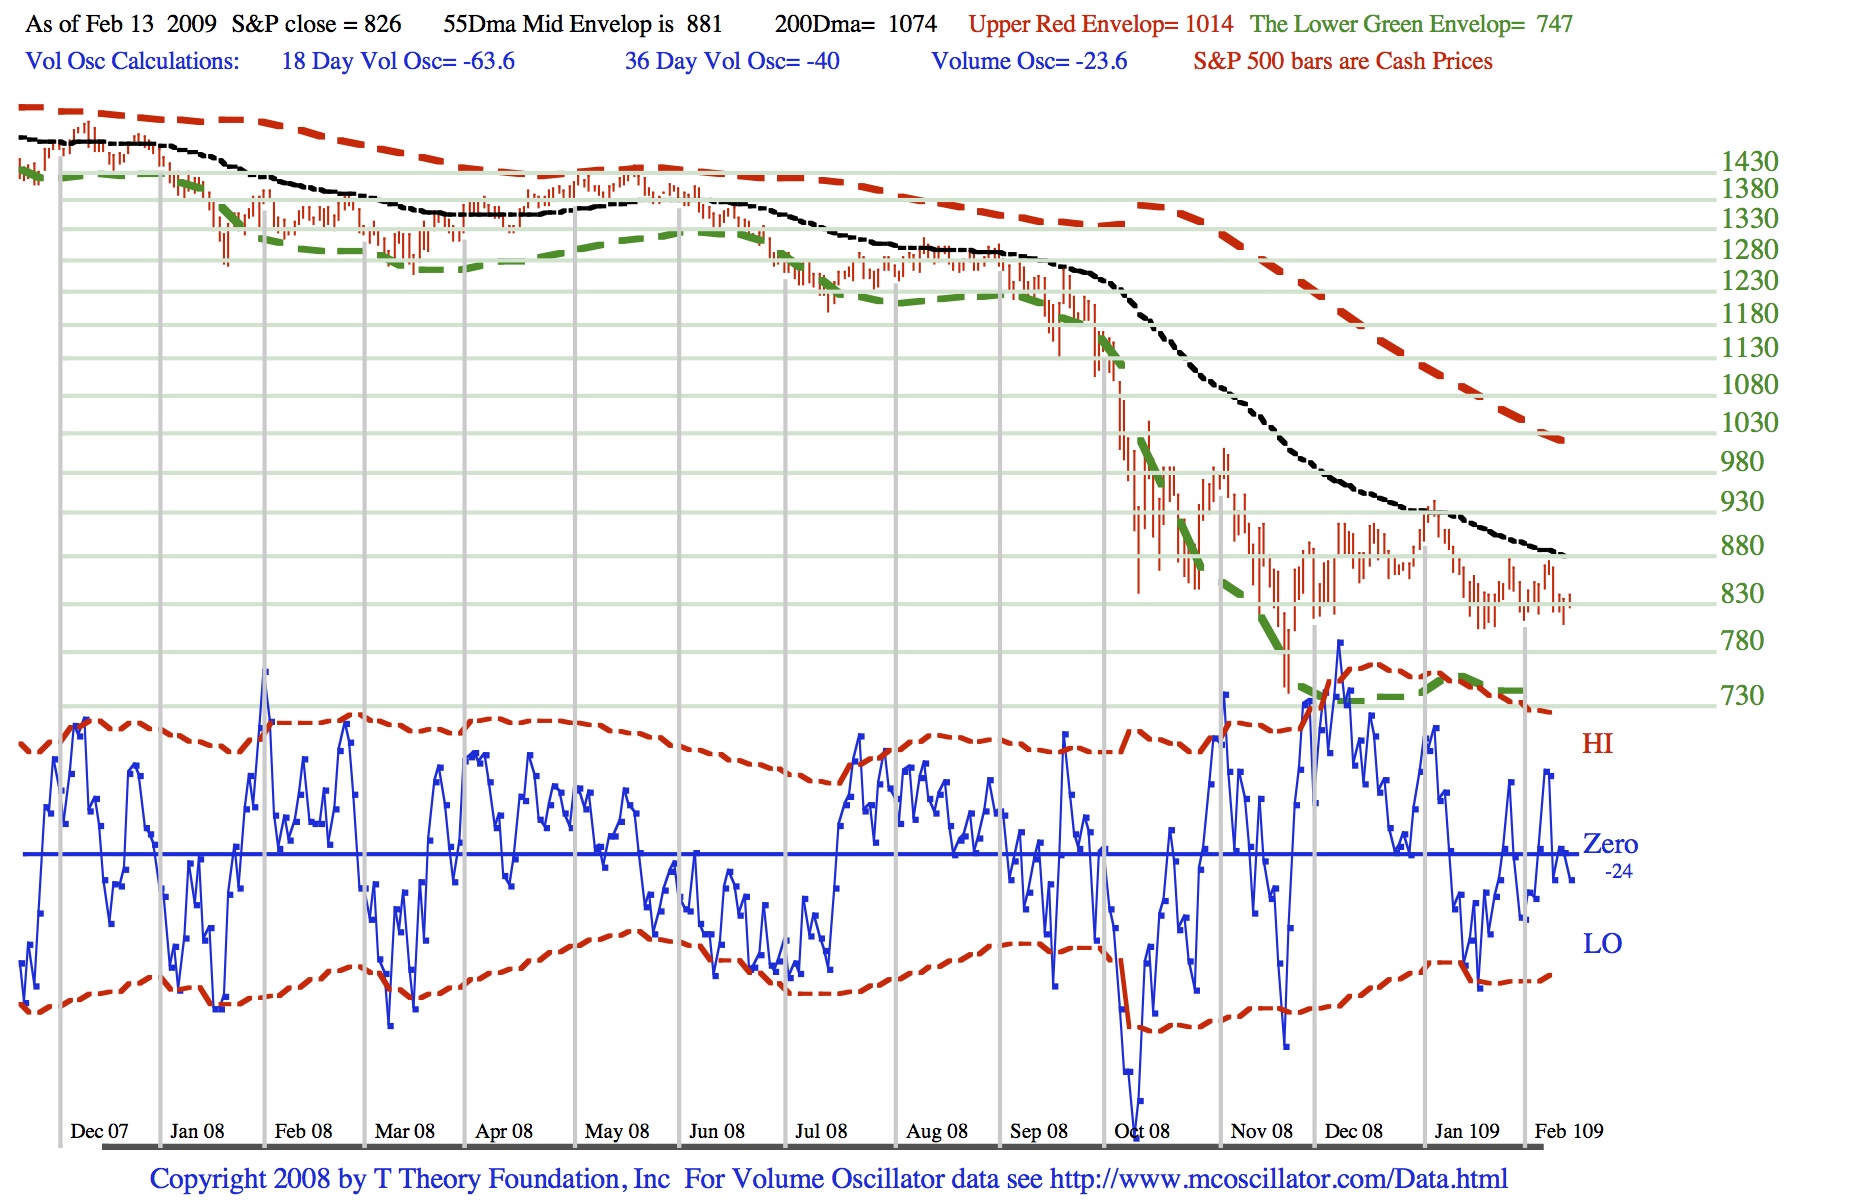
Today’s chart features my estimate of the implied black arrowed upper and lower arrowed channels that I believe best represent the eventual high and low S&P 500 trend channel limits as derived from the adaptive channels. Basically the trend of the S&P 500 should generally be limited by the upper black arrows and will be limited on the downside by the lower black arrows over the next month or two. I believe a lower channel limit will be reached in March and will comment on its development in my next update March 2 2009
More specifically it is important to note that the way I set up the equations for the adaptive channels (i.e. the red dashed upper line and green dashed lower line) any oversold condition that might be important for the very short term require the S&P to penetrate below the lower bound as stated at the upper right of the chart. Currently the lower channel is stated as 734 for the cash S&P but it is falling lower each day. As the chart illustrates, key oversold conditions like that seen in mid September 08, October 08 lows, mid Nov 08 low, require a downside penetration by some 10 points + before a significant rally can be expected for the current down trend.
Based on this criteria today’s decline, starting from 770 on Friday couldn’t make an interesting oversold condition until the S&P went well below the current 734 lower adaptive bound. When I see an interesting level in the days ahead I will post a special update.
Update for Monday February 16 2009.
Listen to the topics below by clicking on the Audio links after you have had a chance to review today’s Chart links and Referenced Prof. Roubini topics. Next Update February 23 2009.
Audio for Intro090216
Audio Comments for DailyChart090216
SimpleOscModel audio file 090216

HomePriceOsc090216
Roubini Audio link 090216
Prof. Roubini Commentary for Reference
See Prof. Roubini; Davos audio iTunes>podcasts>Audio products>business news>bloomberg news>bloomberg on economy>1/28/09 Roubini says top 4 banks are insolvent
See Prof. Roubini; google “NY Times Roubini” for text summary

Special Update for Noon Tuesday Feb 10
Treasury Secretary Geithner’s stern comments has put the market down in a way that is uncharacteristic for a new bullish T. It is too early to make a definitive judgement but I personally am acting on the assumption this new T will likely collapse in its right side based on this action unless it is reversed quickly. Since the center line of the channel was not penetrated to the upside, the best forecast is a decline to the green line near S&P 750.
Update for Monday February 9 2009. (Update is completed) Listen to the topics below by clicking on the Audio links after you have had a chance to review today’s Chart link and Referenced article from the 2005 archives. Here we see the new Short Term T that will produce a bear market rally into mid March.
This is the daily indicator chart with a simple new T construction.
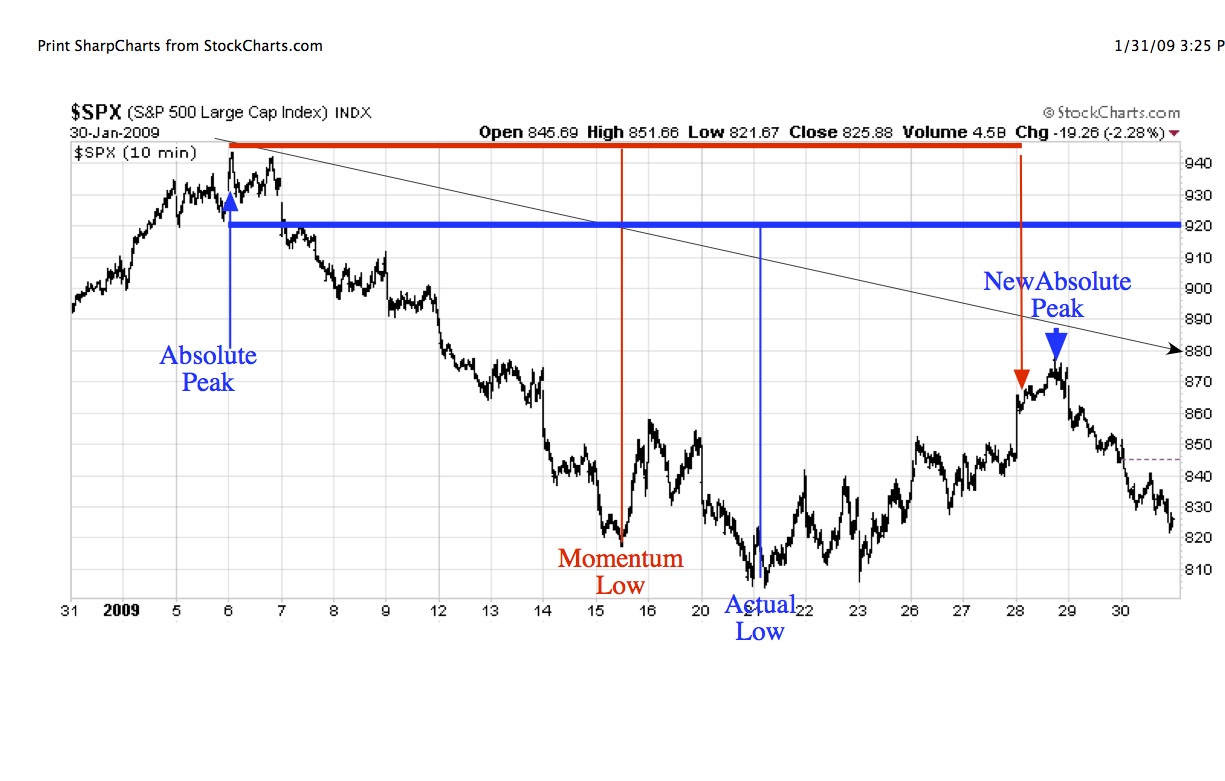
This Archived topic shows the more correct way to construct a T using the double bottom criteria. It illustrated how in 2005 I was able to forecast the September 2007 major top for equities. We will use this technique as applied to the $SPX 10 minute charts next week during the Feb 16th update to calculate the more precise mid March peak date.
Audio File Confirming New T 090209
This is the basic example in chart form we will use to recalculate the mid March short term peak in the 10 minute charts.

Audio File for T Construction Details 090209
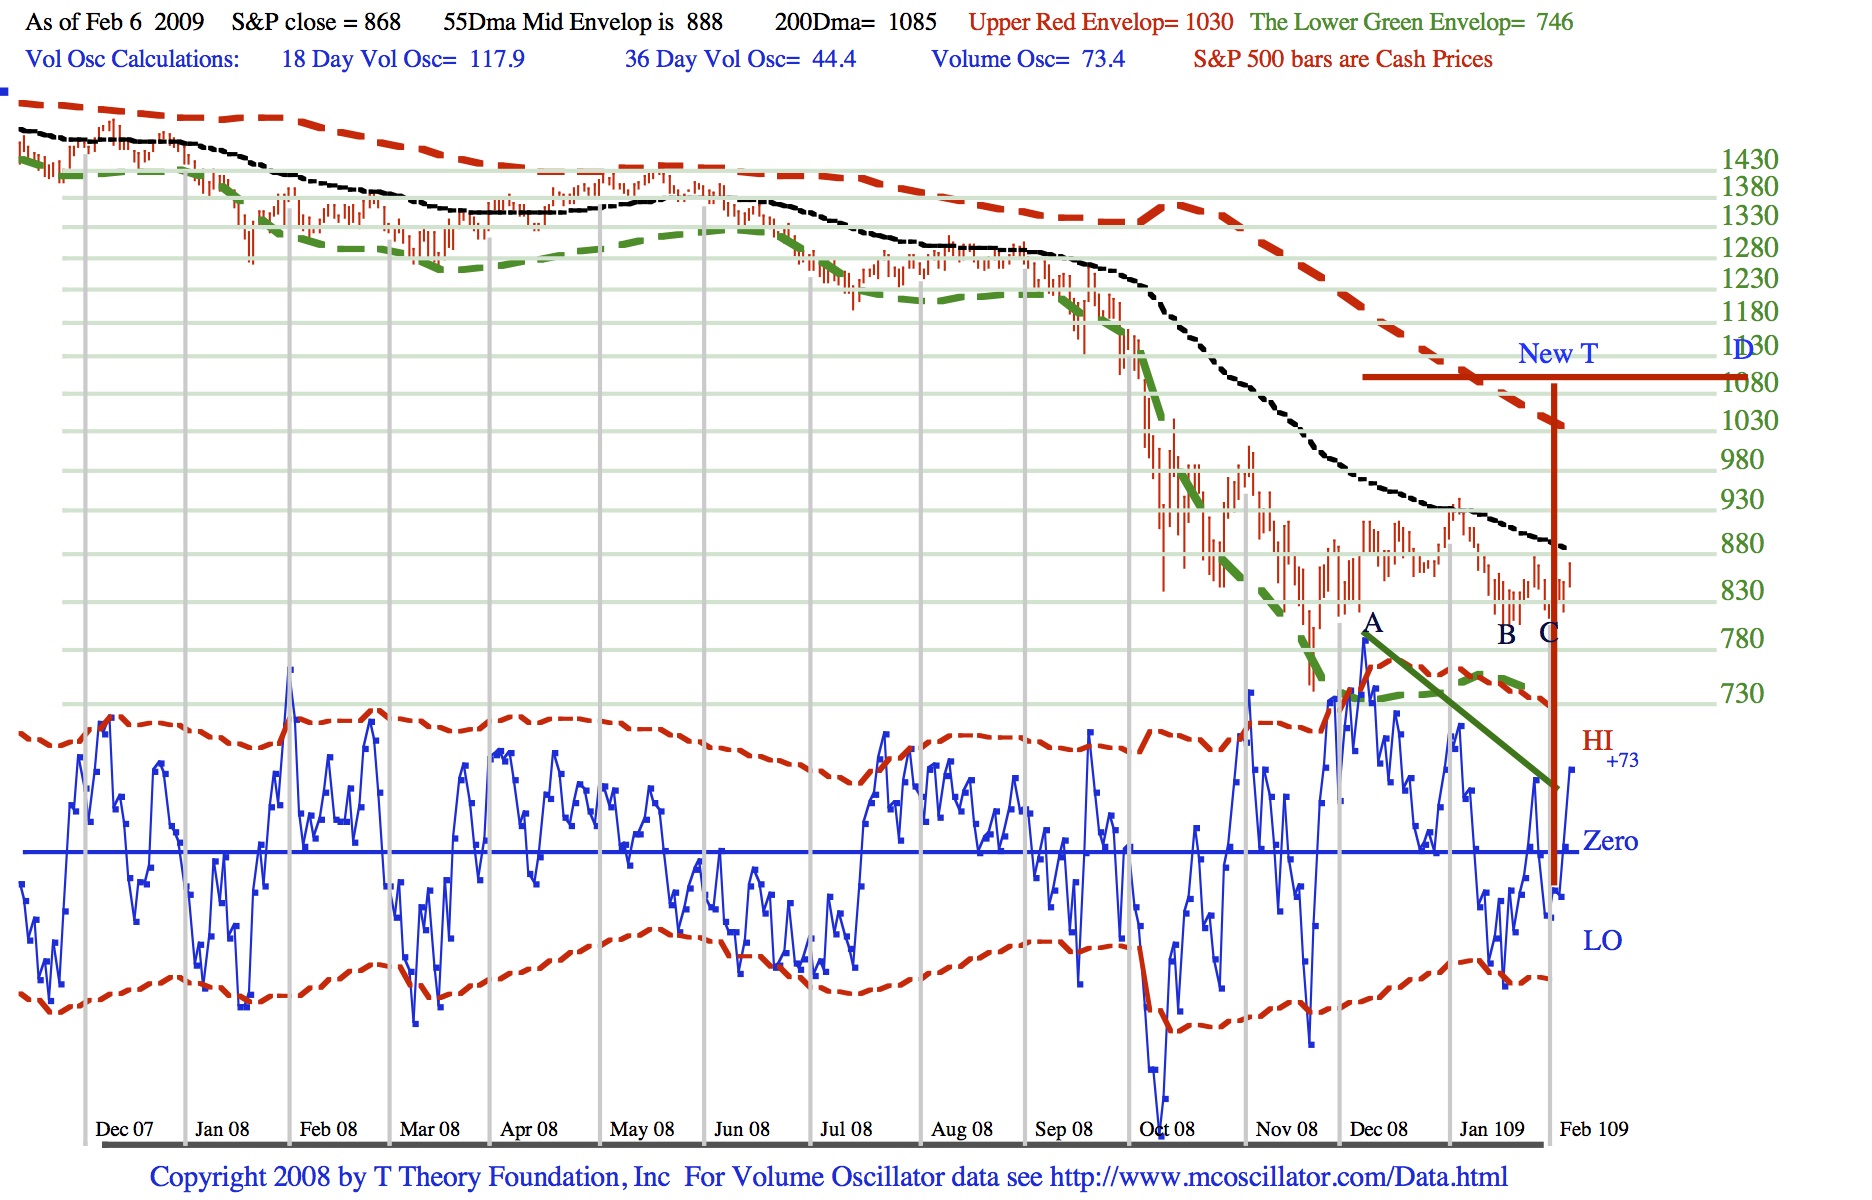
Special Update for Noon Friday Feb 6
Today’s strength is likely to confirm the beginning of a new T and its rally should continue for some some time. Like most bear market rallies it will amount to some % retracement of the recent decline, rather than a new bull market. My regular update will follow on Monday.
Update for Monday February 2 2009
Listen to the topics below by clicking on the Audio links after you have had a chance to review today’s Chart links.

Todays audio discussion: click to hear
****************************************************************************************
All Rights Reserved By The T Theory® Foundation ©
Order the T Theory® Encyclopedia
For a complete understanding of the T Theory® and how to successfully use Terry’s unique methods, order the Encyclopedia from Paula at the above link. There is additional material in the encyclopedia not covered here. Paula will be more than happy to answer your questions too.
Many thanks to Paula Burke for her permission to re-post Terry’s old T Theory® explanations. The period re-blogged on these pages are some of Terry Laundry’s best work and was published here from public domain.
****************************************************************************************
I claim no credit for the material found under T Theory® on this blog. All of this material is the creation of Terry Laundry and was downloaded from Terry’s free blog site (TypePad). I have created a mirror of Terry’s original material and now there is a second site containing Terry’s T Theory®. One or both of these websites hopefully will survive through time as Terry’s material is too important to be lost to the ravages of time. This site is simply a memorial to his lifetime work.
The page content re-blogged here is exactly as Terry created on his original webpages (saved on my computer with ScrapBook)). Nothing has been left out from the period Dec 2003 to June 2011. From Terry’s site, I made a lot of formatting changes, creating a more easily readable webpage appearance. The PDF chart duplicates of the JPEGs have been omitted for ease and speed of recreating Terry’s pages. References to PDF charts should be ignored (but no chart was left out).
After June 2011, Terry created a paid subscription website. None of that material is found here.
There were many many, many hours spent on this project; downloading Terry’s individual charts & audio files, followed by the uploading of Terry’s charts and audio to my WordPress blog library, after which I had to insert the uploaded material into my new T Theory® webpages (hopefully in the correct places). This was a dull and arduous project and I hope you enjoy it. I don’t believe there remains any more of Terry’s material in free domain, so my T Theory® project is probably finished. If I’ve missed something, you can leave me a comment.
If you find an uploaded reference error (chart or audio in the wrong place), please note the month and year of the webpage, plus the exact name of the referenced error file. Include any other info that will help me locate the problem file and where it occurs on the webpage. Leave a comment for me with the info and I’ll fix it.
Terry’s material is very long and will take many weeks for you to finish. Don’t hurry, it’s not a marathon and you will absorb more if you go through it at a reasonable rate. This is especially true for those who don’t invest in the T Theory® reference encyclopedia. The encyclopedia is a written reference for T Theory® and includes everything of importance for Terry’s T Theory®. Without the reference encyclopedia you must depend on your memory and Terry’s method carries some rules that you could easily violate. The encyclopedia also includes new information never seen on his website.
You are welcome to save any or all of my blog material to your computer. You also have my permission to re-blog my information, but you must (1) credit me and my blog in an obvious manner and (2) don’t change my material.
FYI – I find the best way to save a webpage is using “ScrapBook” (it’s an add-on for the FireFox browser). ScrapBook saves a webpage to your computer EXACTLY as it appears on the day you saved it. You can’t tell the difference between the internet webpage and your ScrapBook saved webpage. The saved pages are not pictures. Instead the pages consist of HTML and page functionality remains identical on your computer. There is also a second method for using ScrapBook, where you can save all of the webpages down to a defined link depth. This optional method means all links will function on your computer to the link depth specified (meaning you can click on links on your saved webpages and tunnel down into pages within pages). Saving the normal way will only save the top webpage but the links that exist could continue to function by taking you to the website on the internet instead of on your computer. But sometimes the linked website doesn’t exist anymore. I’ve had this happen on some very good webpages with unique information (they just disappear into the internet void). That’s a bummer when you lost some really good info and thus rose my need for ScrapBook. You can also filter the pages saved using the optional ScrapBook method, which can exclude all pages not coming directly from the specified website (filtering is recommended using this method otherwise you wind up with a LOT of useless stuff).
.
Explore posts in the same categories: . . . T Theory®
Leave A Reply