August 2009 – T Theory® Update

Special Update Sept 2 2009
Update for Sunday August 30 2009
If the audio server becomes overloaded and rejects your request just come back in an hour or so. Jeffery Young has provided a PDF of his A-D Ts
Drawing and comments ” Take a look at the different T’s I drew (attachment) using different center post dates for the A/D line. Quite a few of them come out but the interesting T is the green one that would mature on Sept 14th which is within a day or two of the maturity of the mystery volume oscillator T. I could be wrong but it is likely more than just coincidence. The Chinese market may also be tracing what might happen here with the recent high (our September high) and the steep drop and then moving to a new high a month or so later (our maturing of the October T). Just some thoughts and possible outcomes. I would not be surprised if the China A/D line had similar T’s since they printed earlier than ours and became leading examples due to the strength of their economy.” Jeffrey Young jeffreyisyoung@yahoo.com
Daily Chart with Ts Download SRT20090818wts

Terry’s Audio Commentary of the T Theory Forecast:
Download TTO20090830commentary
Terry’s Questions and Answers for the week
Comment I am writing you today because I began my own blog, and I use an loose version of your T-theory. I reference you when I use it, but I realized that you may not want someone else posting blogs using your method. I will include some links of how I used them. If you have a problem with this, let me know, and I will remove the posts. Also, for your information, I use Ts when day trading. I create intra-day Ts based on on balance volume. I find they work very well 65-75% of the time. They can range from a few hours to 50 minutes.
Thank you,
George

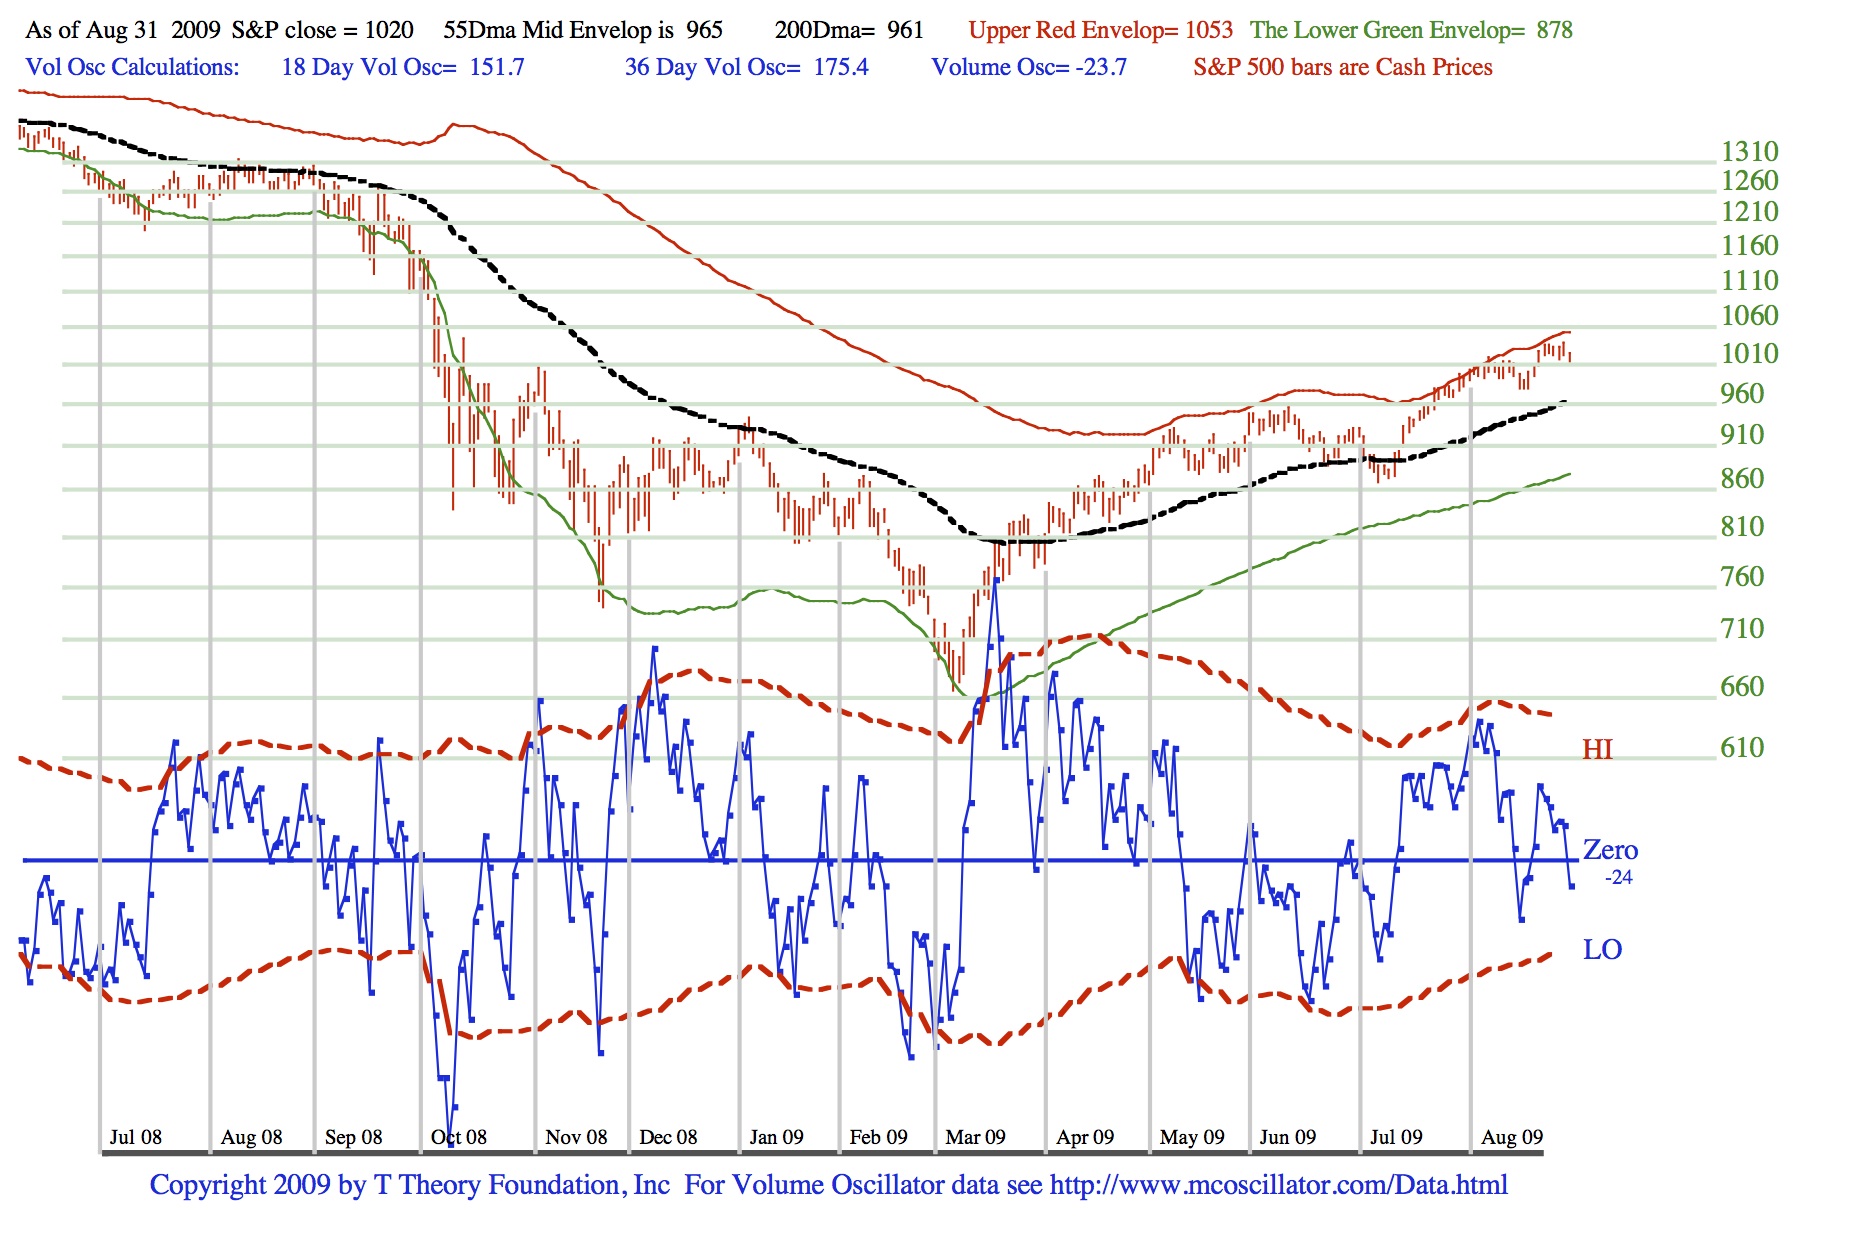
Calculation of the T Theory Daily Volume Oscillator
To calculate the progression of the blue Volume Oscillator as depicted in my daily chart above you need to recalculate the 18 day and 36 day Volume oscillator values that are noted in the chart for each successive day beyond this chart’s history. The formulas used are very simple because they are based on exponential moving averages and use recursive equations that are easy to implement in any spreadsheet software package. Click on the chart PDF image for a view of the daily August 28 2009 volume oscillator indicators at the top of the chart.
I am providing these examples of daily calculations in the daily chart which you can use to check your own calculations or restart the process. I won’t have time to answer specific questions but of course I will make any corrections and listen to suggestions on improvements. If you have an arithmetic problem, it should be easy to find someone that understand the simple math involved. Using a simple spreadsheet is best; it is easy to set up, fast to use, and makes the arithmetic error free.
Super trader Marty Schwartz who used this oscillator for some decades claims that one is better prepared to use the day to day pattern for finding bottoms or tops if you plot the oscillator values by hand on real graph paper. Watching the pattern for tops and bottoms evolve from one day to the next gives one better perspective on how this volume oscillator tends to anticipate changes in price trends. The computer generated chart is helpful, but he claims the day to day plot helps to get the better feel for it’s leading characteristics.
Each day after the market close you will need to obtain the net on balance volume data for the NY Exchange. This can be obtained anywhere but is conveniently available on the web in a market summary section. The data is almost always in a Market Diaries section. See this recommended page
Markets Diary: Closing Snapshot – Markets Data Center – WSJ.com
Be sure you find the number of millions of share traded on the advancing stocks (called the Up volume) and the number of millions of share traded on the Declining stocks ( called the Down Volume) . These numbers will typically run in the range of 300 to 1200. The Up Volume minus the Down Volume = the net volume for the day (in millions of shares) is the only day’s number needed to complete the calculation. The number should be positive on an up day, negative on a down day and tends to vary in the range of plus 900 to minus 900.
But to keep the final number in a better range for plotting by hand on graph paper, I take this raw net volume and divide it by 10. So this Reduced Net Volume Change figure is the value we actually use in the calculation. When charted the volume oscillator generally falls in the 100 plus or minus range which more convenient for plotting.
The Calculation of the next day’s 18 Day Volume Oscillator is simply a modification of the prior day’s value of the 18 Day Volume Oscillator using the new day’s Reduced Net Volume number:
Today’s 18 Day Volume Oscillator = 90% of Yesterdays 18 Day Volume Oscillator +1 times Today’s Reduced Net Volume.
Today’s 36 Day Volume Oscillator = 95% of Yesterday’s 36 Day Volume Oscillator 0.5 times Today’s Reduced Net Volume.
To Illustrate the calculation I will discuss how the next days Volume Oscillator value would be calculated from the August 28 2009 data in the chart.
For August 28 2009 the chart notes the 18 Day VO= 259.8 and the 36 Day VO= 227.9. The blue Volume Oscillator we really want is always equal to 18 Day VO -36 Day VO, that is (259.8-227.9) = +31.8 according to the chart but should be 31.9 according to readings. The discrepancy is just a round off error in the chart’s print process.
Monday August 31 saw the Up Volume was 273 million shares, and the Down Volume was = 1094 million shares; the Net Volume for Monday would be 273-1094= -821 and the Reduced Net Volume therefore would be plus -82 (-82.1 more precisely but not necessary).
The August 31 18 Day Volume Oscillator is always = 90% of Yesterdays 18 Day Volume Oscillator (259.8) +1 time Todays Net Volume (-84).
So = 259.8 times 0.9 (which is 233.8) + (-82) times 1 (which is -82)= 233.8 + -82 which equals 137 for the 18 Day Volume Oscillator
The August 31 Day Volume Oscillator always = 95% of Yesterdays 36 Day Volume Oscillator +0.5 times Todays Net Volume .
So 227.9 times .95 (which is 216.5) + -84 times 0.5 (which is 41) =216.5-41 which equals 175 for the 36 Day Volume Oscillator
So for August 31 this sample calculation, the final Volume Oscillator calculation would be Today’s 18 Day VO – Todays 36 Day VO, that is 137-175= -37 .
For Sept 1 up volume=90 mill Down vol =1533 Net =-1443; Net Reduced=-144
18 day vo=136(151 times 0.9)-144= -8; 36 day vo= 166 (175 times 0.95)-72( -144 times 0.5)=94; VO= -8-94= -102
will continue these daily calcs this week here.
Terry Laundry
Update for Wed Aug 26:
T Theory tutorials are now available at ttheoryfoundation.org or use link here: T Theory Foundation
Hint: Let the audio download progress until it is complete before clicking on the play button. If you don’t and have a slow connection the audio may abort. Some features are not yet implemented however you can email questions/comments on the tutorial subject matter to my Foundation Mailbox. More on Sunday
Update for Sunday August 23 2009 Today’s Topics include; T Theory Tutorial coming this week, a look at the Volume Oscillator S&P chart vs the Advance-Decline Line S&P chart and their relationship, the volume oscillator Mystery T, the need to understand the volume oscillator wave pattern in detail, and my response to most all of the questions received last week. Look over the two daily PDF charts then listen to my long Audio Commentary.
S&PvsVolOsc TDownload SRvoT20090823
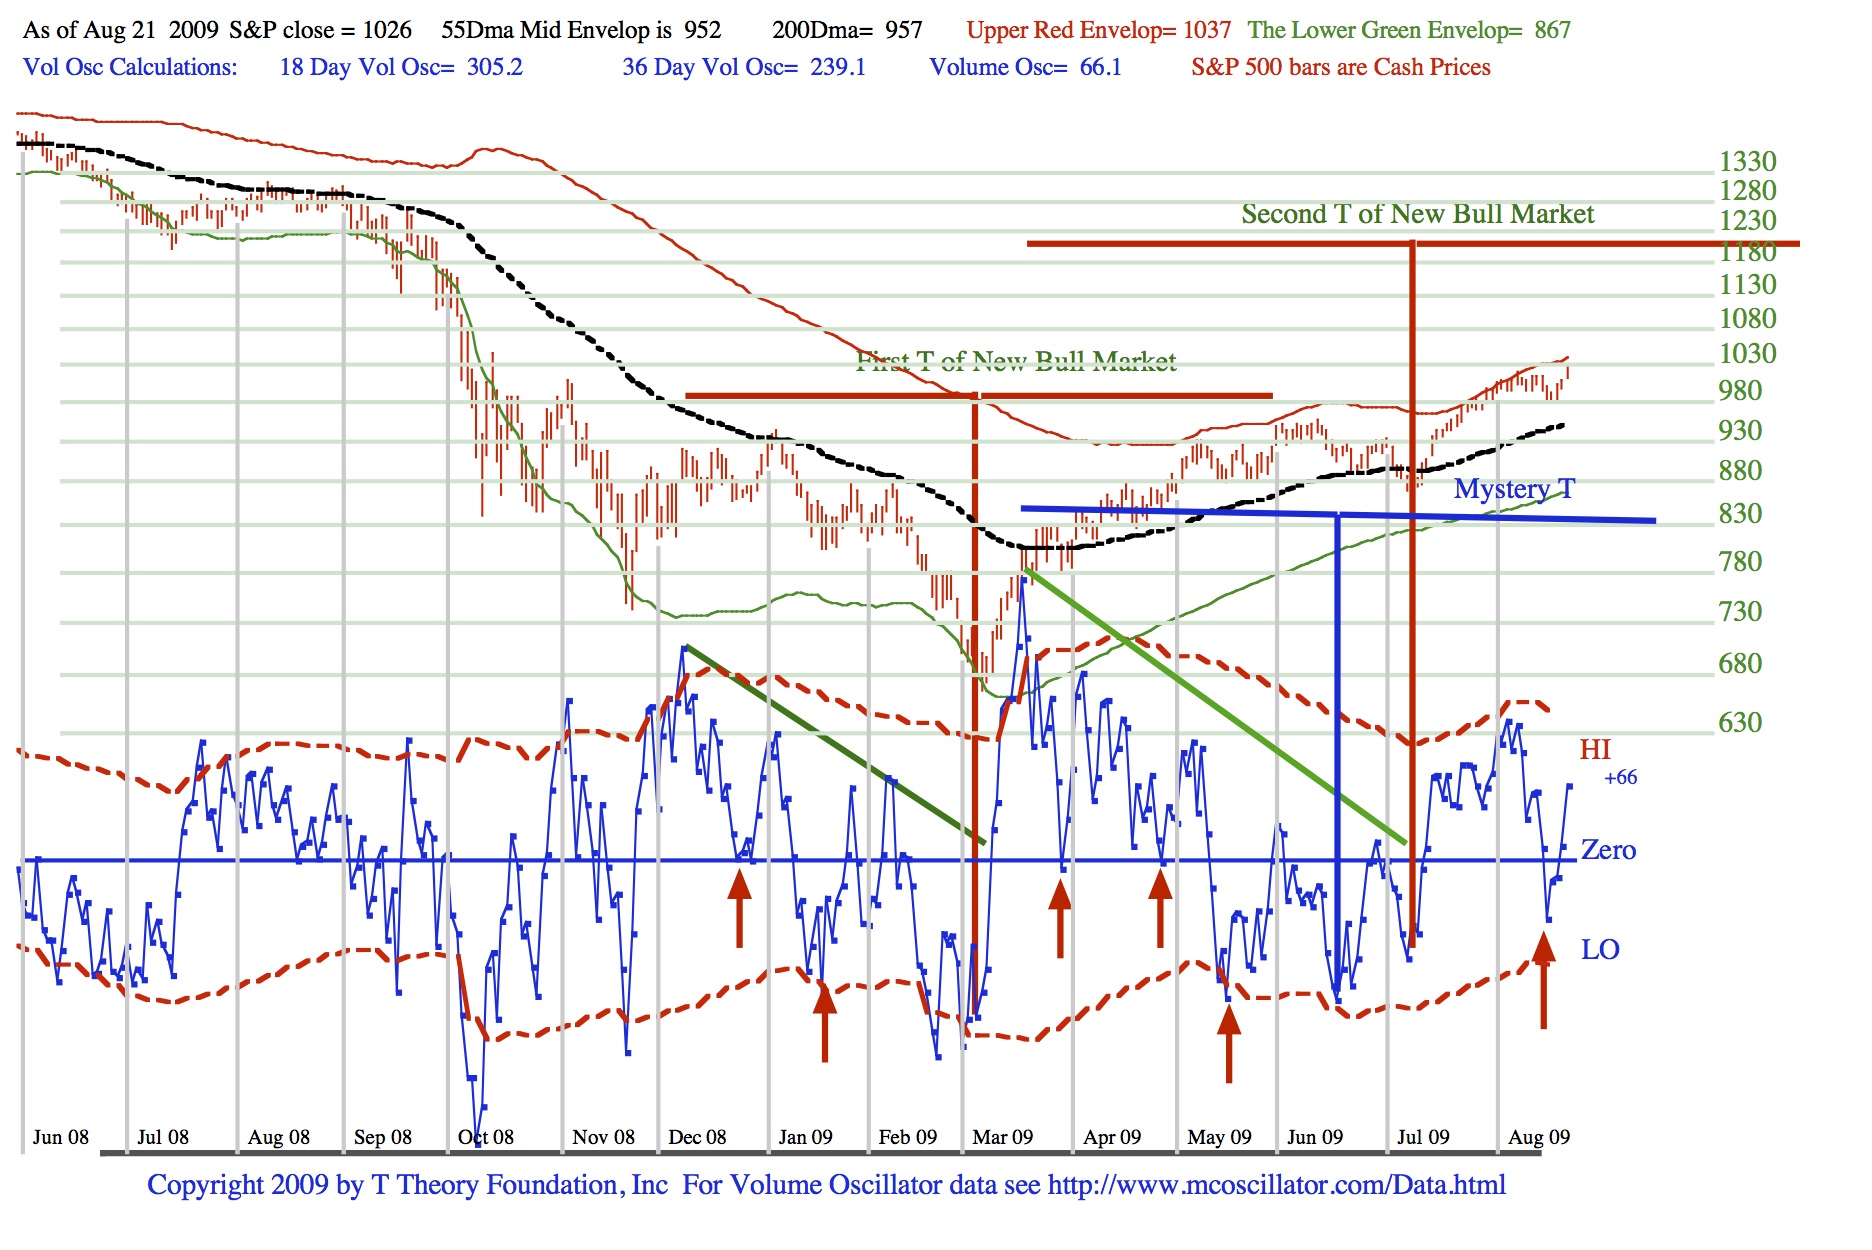
S&PvsA-D line Download SRadT20090821

Audio Commentary Download TTO20090823
Quick update for August 18 2009
The reaction should be finding a bottom here or over the next few days. Watch for turning pattern in the oscillator or the market. Market should see new highs by early Sept.
Update for Sunday August 16 2009
Today’s Topics include; Questions and my Answers (Q&A) to; what happens after Oct, where do I learn about T Theory, Greg asks “Marty:day trader or T Theory”, what about rally last week, where to get data for volume oscillator, what about Gold, why is Oct peak is in seasonally weak period, Ji comments by Marty in Stock Wizards, etc.
Today’s Chart Download SRT20090814

Audio Correction; it was Greg not Jeff who asked about day trading vs T Theory
For Stock Wizards article go to:
Market Wizards: Interviews with Top … – Google Books
Markets Diary: Closing Snapshot – Markets Data Center – WSJ.com
About Oscillator calculation from Rick ( It was 12180/1000= 12.1 error is due to data differences-Terry)
| McClellan Volume Oscillator |
NYSE10%5%McCMcC VOLUV-DV FORUV-DV FORUV-DVTRENDTRENDUV-DVSUMMATIONOSC UNCH’DOSC TO 0(x 1000)UV-DVUV-DVOSCINDEXTOMORROWTOMORROW
| 948490 | 309845 | 203881 | 105964 | 1085132 | 415809 | -1703474 |
| 420739 | 320935 | 214724 | 106211 | 1191343 | 427145 | -1697068 |
| 807538 | 369595 | 244365 | 125230 | 1316573 | 494825 | -2009781 |
| -17631 | 330872 | 231265 | 99607 | 1416181 | 430480 | -1561670 |
| 867914 | 384576 | 263097 | 121479 | 1537660 | 506056 | -1923528 |
| 19721 | 348091 | 250928 | 97162 | 1634822 | 445253 | -1497996 |
| -738718 | 239410 | 201446 | 37964 | 1672786 | 277374 | -481904 |
| 730227 | 288492 | 227885 | 60607 | 1733393 | 349098 | -863033 |
| 381409 | 297783 | 235561 | 62222 | 1795615 | 360006 | -884436 |
| -640835 | 203922 | 191742 | 12180 | 1807795 | 216102 | -27500 |
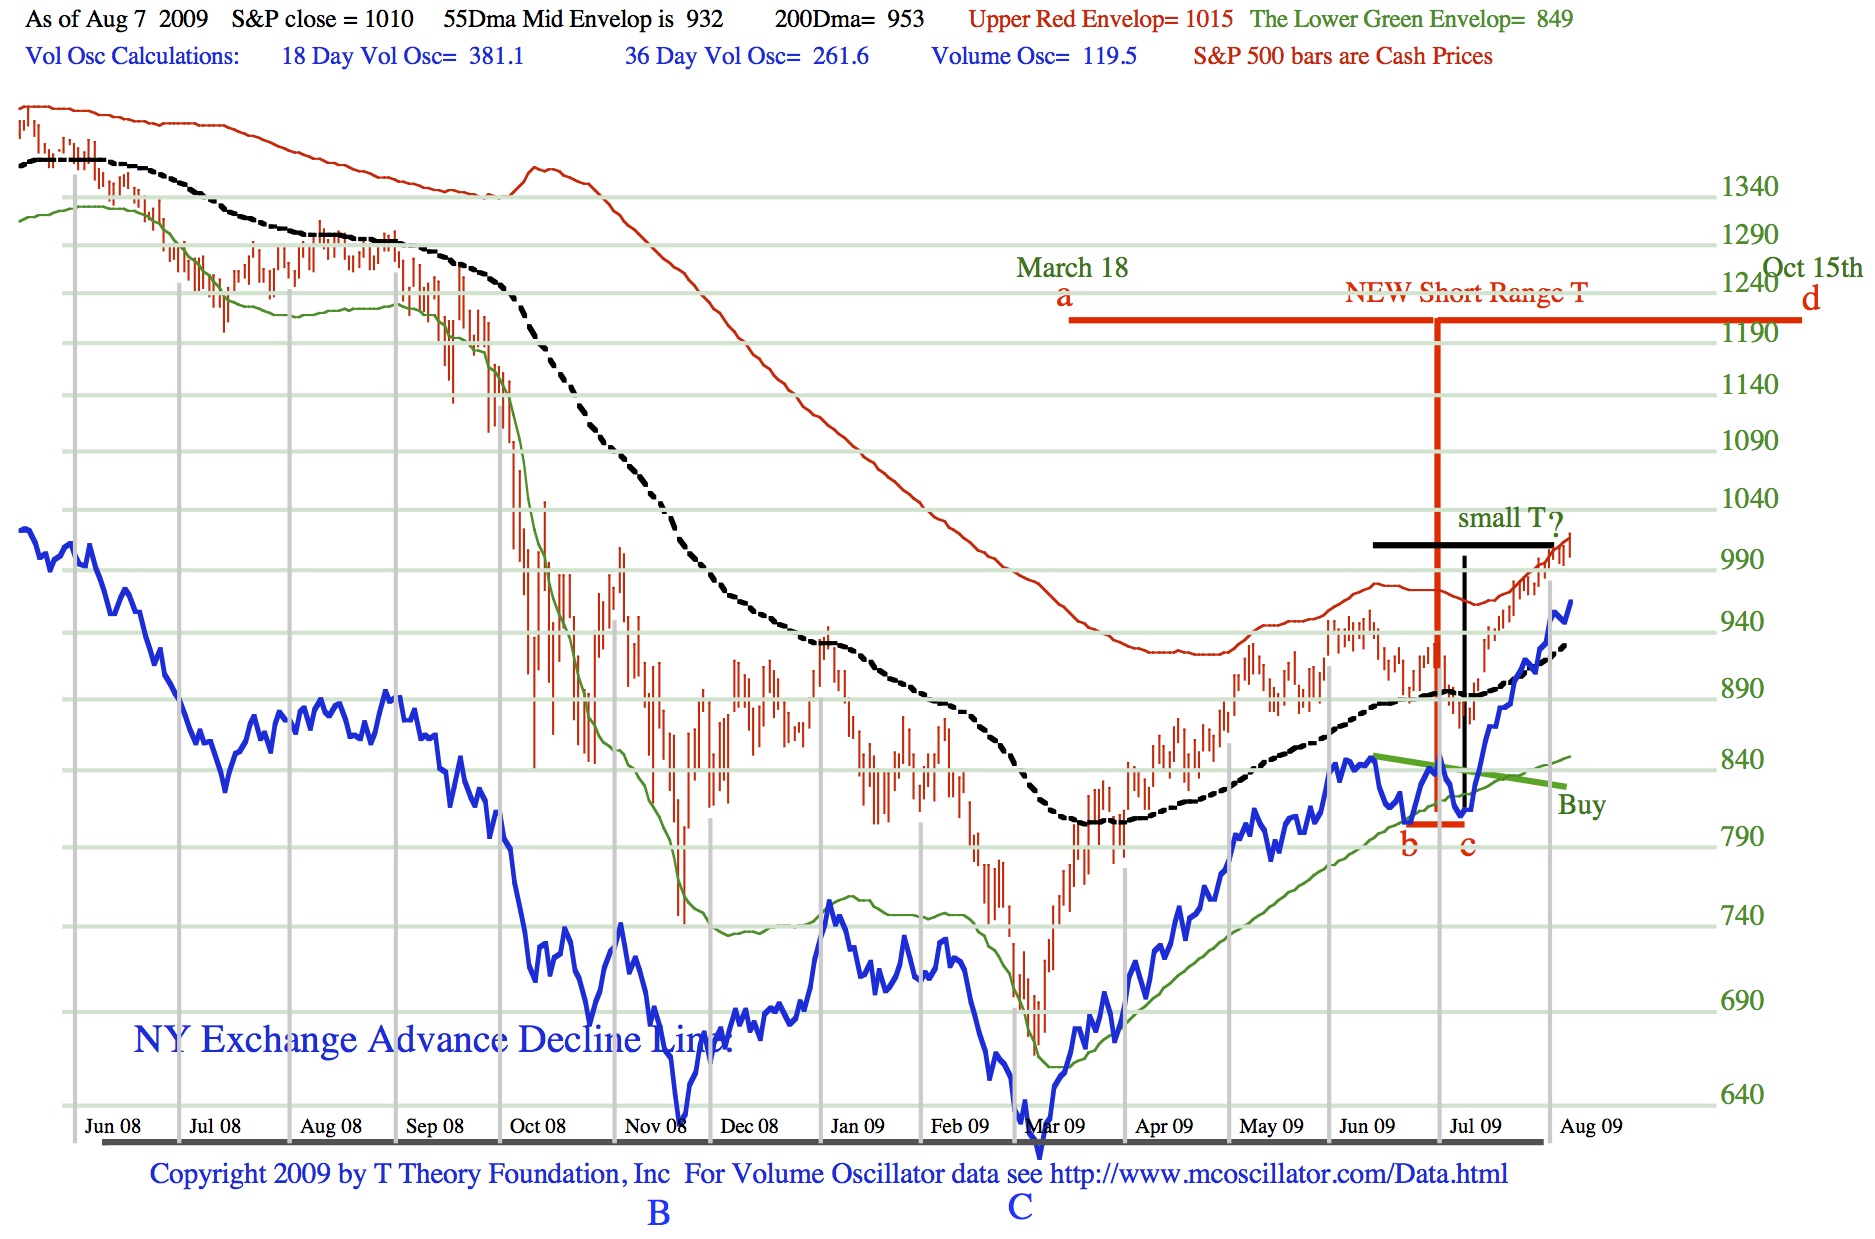
Update for Sunday August 9 2009
Today’s Topics include; The very short term way of looking at T Theory as per the comments above;
First we will look at the Short Term picture using the A-D Line then I will comment on the small T, etc.
Daily A-D Chart Download SRTad20090807
Audio Commentary Download TTO20090809a
Then we will take the same history in terms of the volume oscillator and look at it from Marty’s very short term trading perspective, maybe 7 days or so.
Daily Vol Chart Download SRTvo20090807

Daily Audio Vol Chart Commentary Download TTO20090809b
Finally I will answer the question of when a top to the China market might occur and why my volume oscillator numbers don’t quite match those of McClellan site noted at the bottom of these charts.
Q and A has been re-recorded due to a mic problem.
Audio Q and A Download TTO20090809c
Send any new questions or comments to terry.laundry@comcast.net
Update for Sunday August 2 2009
Today’s Topics include;

AudioCommentary ASIC Report Download TTO20090802b
****************************************************************************************
All Rights Reserved By The T Theory® Foundation ©
Order the T Theory® Encyclopedia
For a complete understanding of the T Theory® and how to successfully use Terry’s unique methods, order the Encyclopedia from Paula at the above link. There is additional material in the encyclopedia not covered here. Paula will be more than happy to answer your questions too.
Many thanks to Paula Burke for her permission to re-post Terry’s old T Theory® explanations. The period re-blogged on these pages are some of Terry Laundry’s best work and was published here from public domain.
****************************************************************************************
I claim no credit for the material found under T Theory® on this blog. All of this material is the creation of Terry Laundry and was downloaded from Terry’s free blog site (TypePad). I have created a mirror of Terry’s original material and now there is a second site containing Terry’s T Theory®. One or both of these websites hopefully will survive through time as Terry’s material is too important to be lost to the ravages of time. This site is simply a memorial to his lifetime work.
The page content re-blogged here is exactly as Terry created on his original webpages (saved on my computer with ScrapBook)). Nothing has been left out from the period Dec 2003 to June 2011. From Terry’s site, I made a lot of formatting changes, creating a more easily readable webpage appearance. The PDF chart duplicates of the JPEGs have been omitted for ease and speed of recreating Terry’s pages. References to PDF charts should be ignored (but no chart was left out).
After June 2011, Terry created a paid subscription website. None of that material is found here.
There were many many, many hours spent on this project; downloading Terry’s individual charts & audio files, followed by the uploading of Terry’s charts and audio to my WordPress blog library, after which I had to insert the uploaded material into my new T Theory® webpages (hopefully in the correct places). This was a dull and arduous project and I hope you enjoy it. I don’t believe there remains any more of Terry’s material in free domain, so my T Theory® project is probably finished. If I’ve missed something, you can leave me a comment.
If you find an uploaded reference error (chart or audio in the wrong place), please note the month and year of the webpage, plus the exact name of the referenced error file. Include any other info that will help me locate the problem file and where it occurs on the webpage. Leave a comment for me with the info and I’ll fix it.
Terry’s material is very long and will take many weeks for you to finish. Don’t hurry, it’s not a marathon and you will absorb more if you go through it at a reasonable rate. This is especially true for those who don’t invest in the T Theory® reference encyclopedia. The encyclopedia is a written reference for T Theory® and includes everything of importance for Terry’s T Theory®. Without the reference encyclopedia you must depend on your memory and Terry’s method carries some rules that you could easily violate. The encyclopedia also includes new information never seen on his website.
You are welcome to save any or all of my blog material to your computer. You also have my permission to re-blog my information, but you must (1) credit me and my blog in an obvious manner and (2) don’t change my material.
FYI – I find the best way to save a webpage is using “ScrapBook” (it’s an add-on for the FireFox browser). ScrapBook saves a webpage to your computer EXACTLY as it appears on the day you saved it. You can’t tell the difference between the internet webpage and your ScrapBook saved webpage. The saved pages are not pictures. Instead the pages consist of HTML and page functionality remains identical on your computer. There is also a second method for using ScrapBook, where you can save all of the webpages down to a defined link depth. This optional method means all links will function on your computer to the link depth specified (meaning you can click on links on your saved webpages and tunnel down into pages within pages). Saving the normal way will only save the top webpage but the links that exist could continue to function by taking you to the website on the internet instead of on your computer. But sometimes the linked website doesn’t exist anymore. I’ve had this happen on some very good webpages with unique information (they just disappear into the internet void). That’s a bummer when you lost some really good info and thus rose my need for ScrapBook. You can also filter the pages saved using the optional ScrapBook method, which can exclude all pages not coming directly from the specified website (filtering is recommended using this method otherwise you wind up with a LOT of useless stuff).
.
Explore posts in the same categories: . . . T Theory®
Leave A Reply