August 2007 – T Theory® Update

During August I will post updates of the daily Short Range T (SRT) chart on Mondays in order to keep up with the market volatility.
August 27 2007 SRT and Envelope Update–
As per last weeks observation the S&P has rallied above the 200 Day MA to the normal upside resistance at the 55 day MA. Current values are given in the updated Short Term Chart which can be downloaded below. The current 55 DAY MA has come down to 1481 vs Friday’s closing value of 1479. Normally the 55 Day MA provides upside resistance as it did in the recent past so some sort of correction or hesitation from here would be expected.
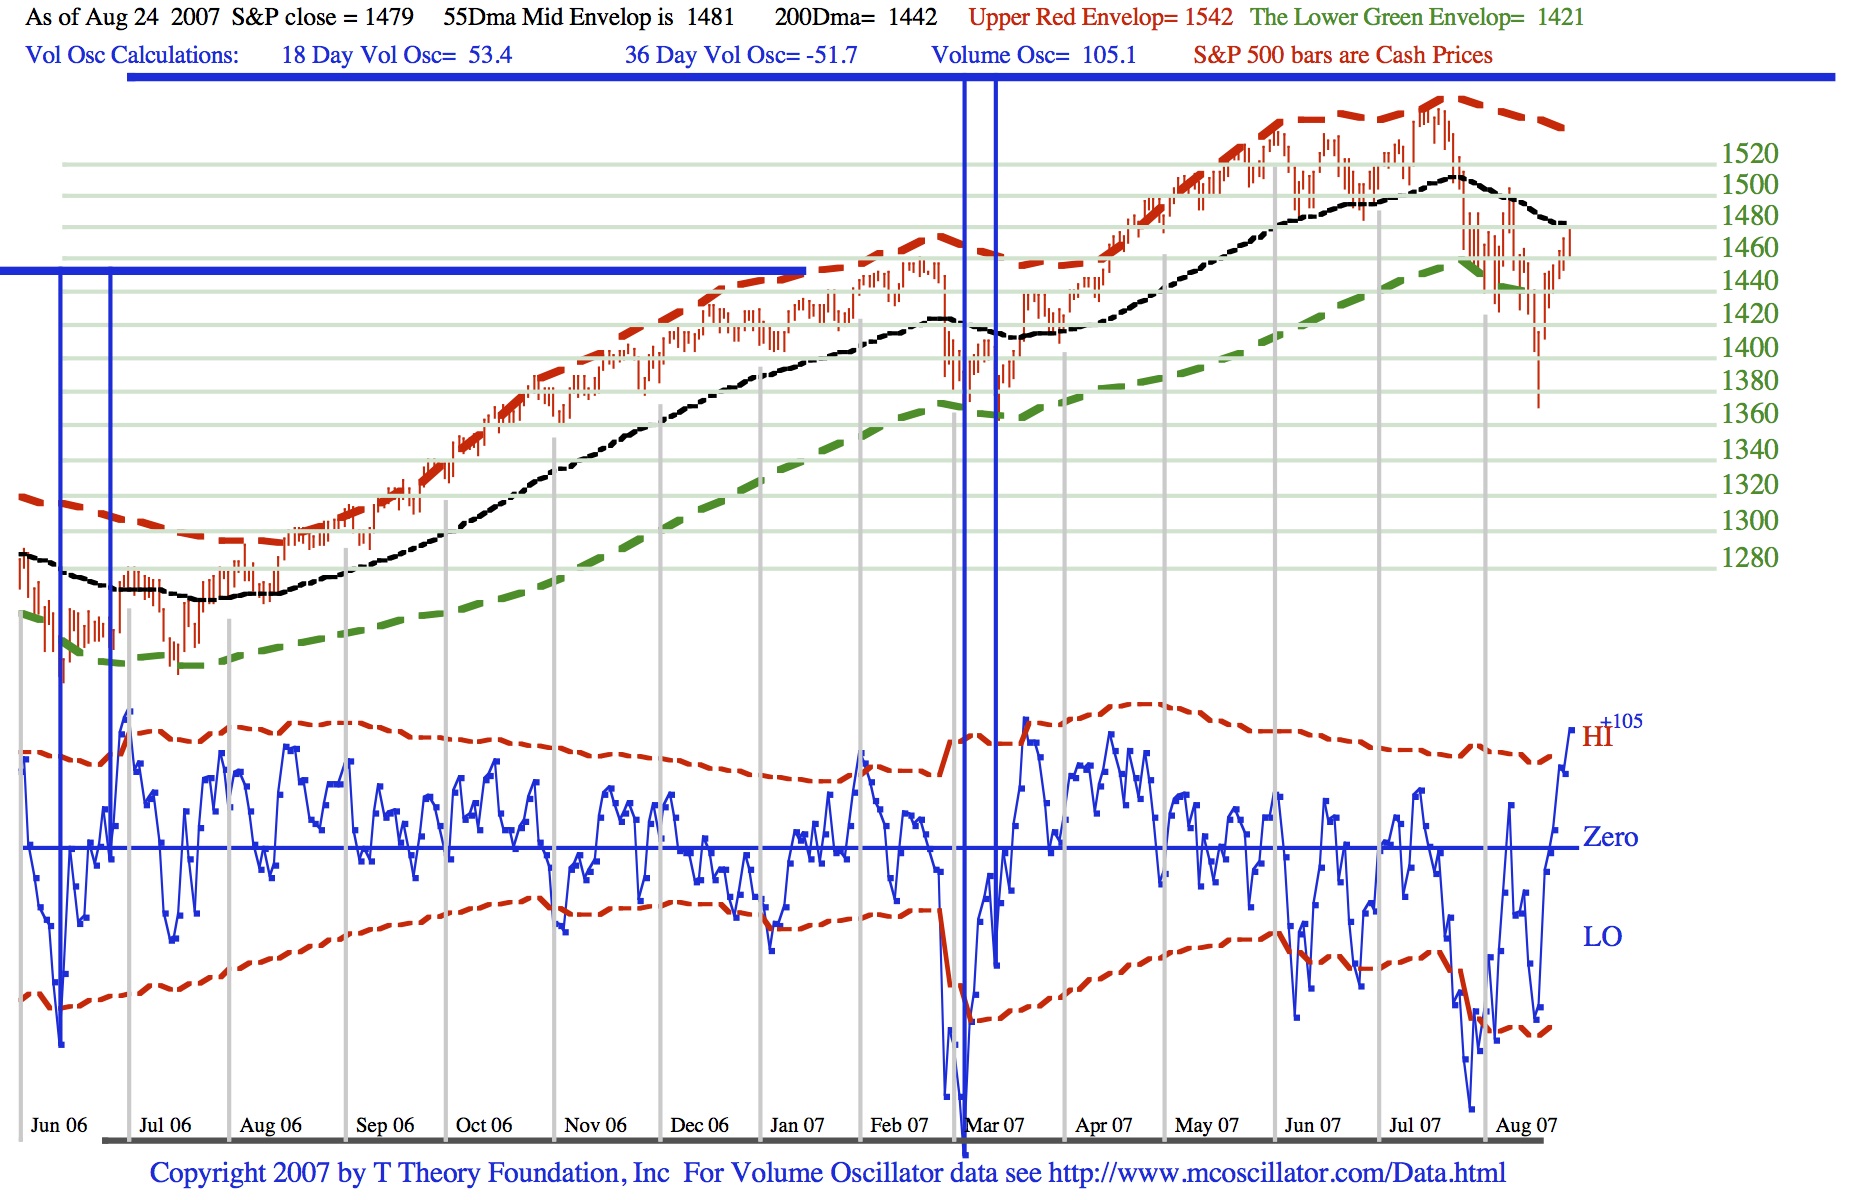
But generally the outlook for the current Short Range T is improving relative to its projected right end date of November. It is unusual to see a bullish type of T make a full correction of its initial advance, but by holding at its prior center post low, the T still can finish out its normal requirement that the S&P reach an higher high come late Fall.
There are only two key requirements that need to be full filled for this bullish scenario to stay on track. First, any near term correction caused by resistance at the 55 Day MA must hold above the 200 Day MA. Second, once the S&P breaks above the 55 Day MA, no correction should bring it below the 55 Day back center line in the chart.
The August 20 2007 SRT and Envelope Update
During last week the S&P broken down in a way that is not consistent with a typical bull market correction as suggested by the 10 year history posted on August 6th. The major observation that needs to be made on the current rebound is whether the 200 day MA, the red line in that chart, will act as upside resistance and by year end be in a down trend. It would then be suggesting a long term bear market beginning from a double top in the S&P 500 relative to the key 2000 peak. Specifically 1553 for 2000 vs 1556 for 2007.
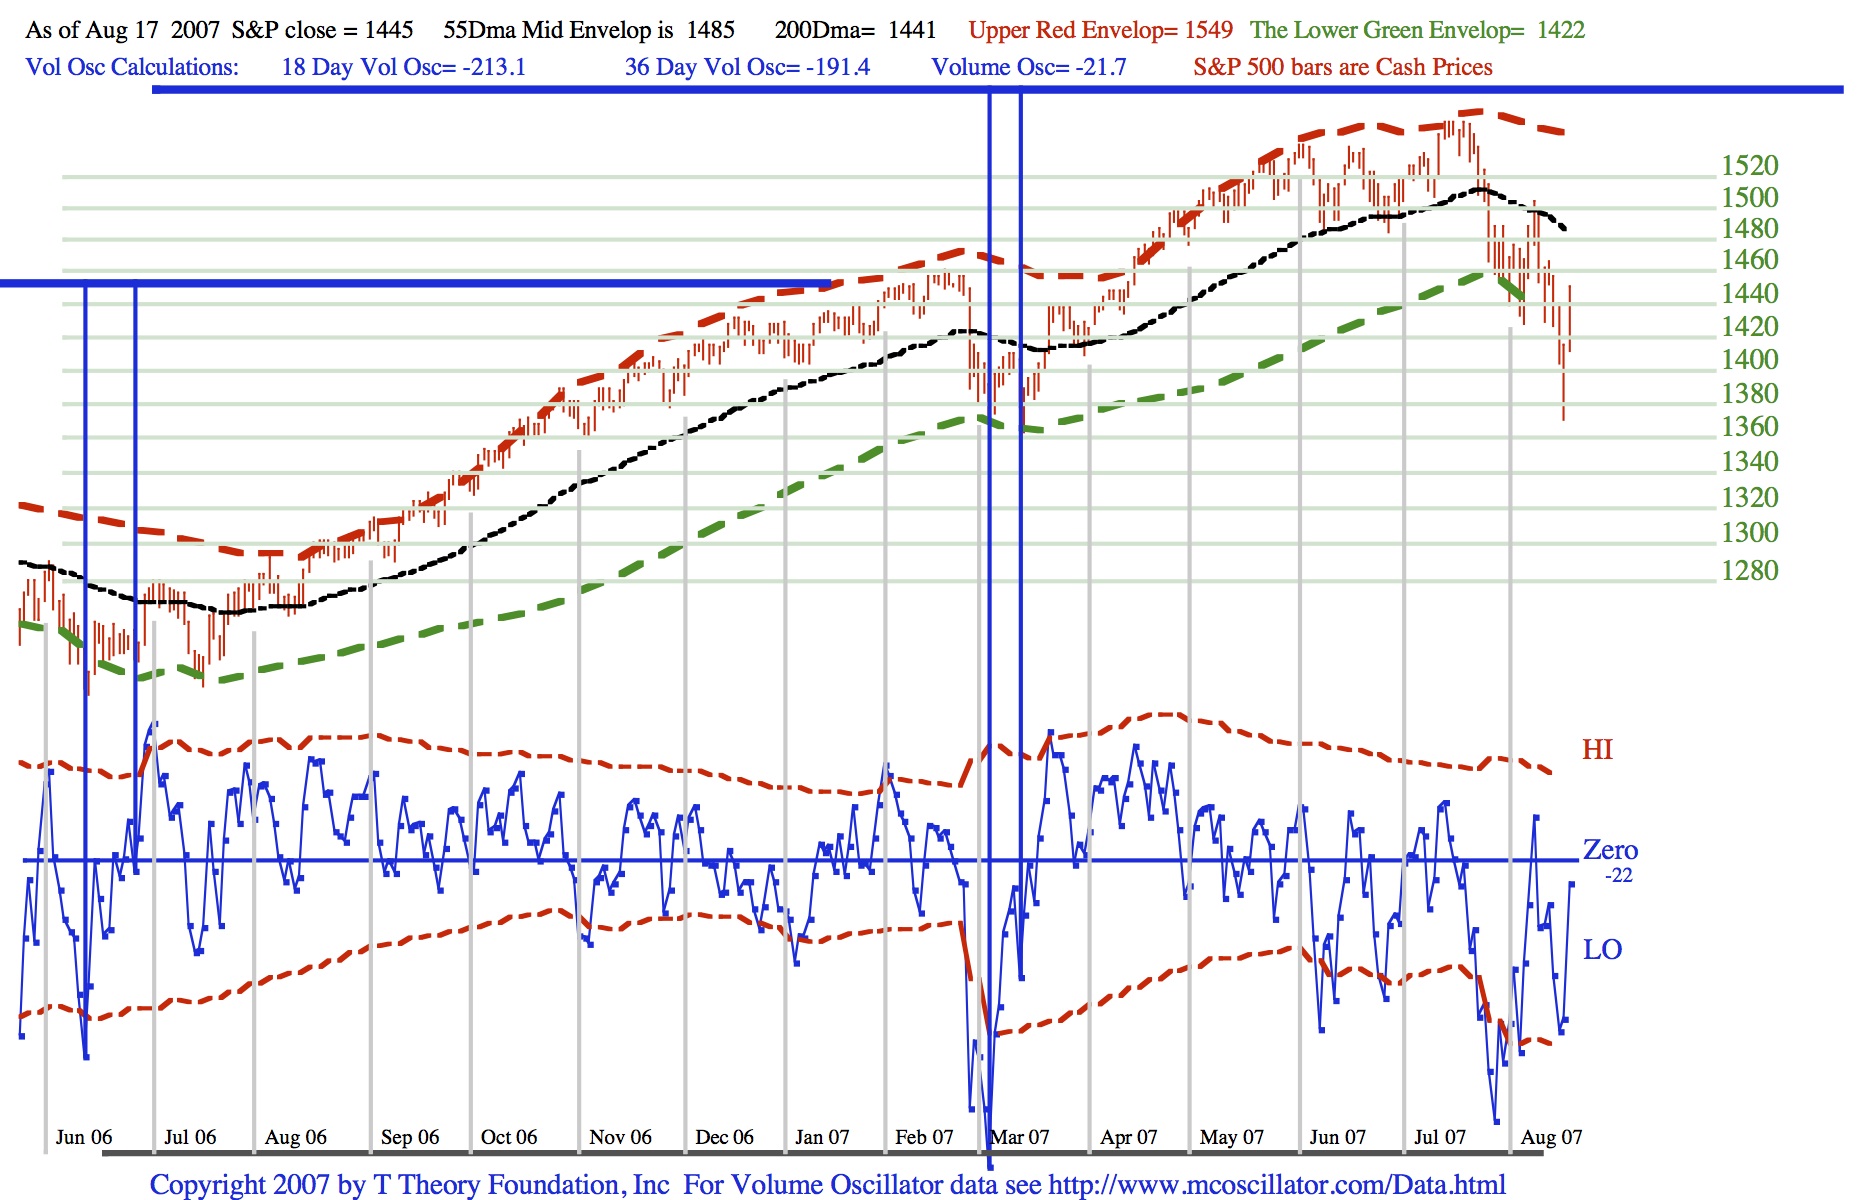
On a shorter term basis in the daily chart above, the normal expectation is for a rebound higher than the 200 Day MA (1441) to the 55 day MA (1485) on Friday. The critical issue to be settled relative soon is where the bull market remains intact for now. The best outcome would be if the S&P can get above the 200 day MA and stay above it thereby returning the trend to at least a trading range as per 2000. The worst outcome is that either the S&P can not reach the 55 day MA and turns down, or it just reaches the 55 Day MA and then turns down much as it did about 8 days ago.The issue could be decided this week.
The August 13 2007 SRT and Envelope Update:
Over the last week we have seen exceptionally and confusing volatility based largely on the mortgage securities problem, but the wild swings did honor the two key envelope levels at the 55 day MA for a top after the early rally last week and the 200 day MA of the S&P for the correction low into last Friday, where we now stand.
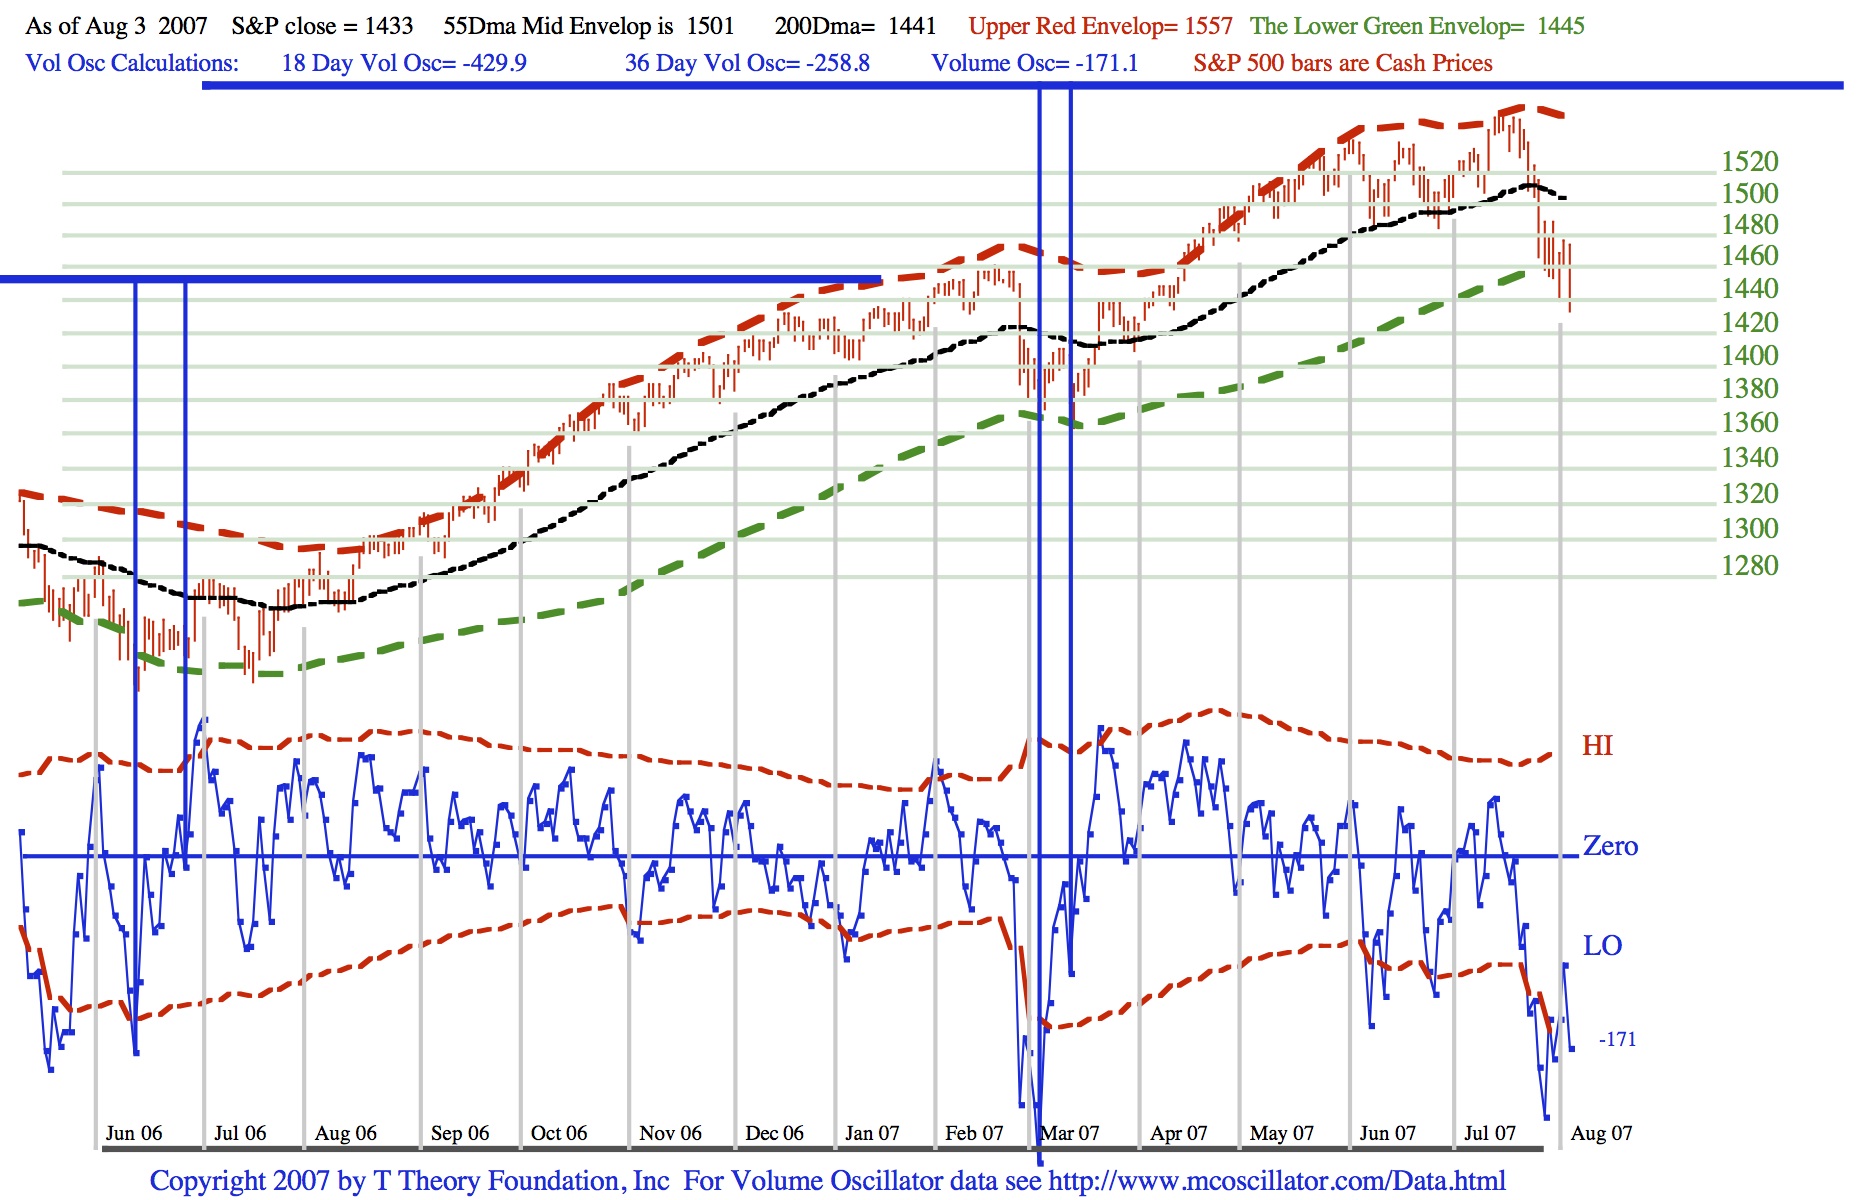
Before moving on I want to say that the ability of the three channel bounds that are shown in the daily PDF chart below, which you can download, can be thought of as the three basic “quantum states” for the equity market’s S&P 500. That is the market can be assumed to be very volatile but only within the a natural tendency to produce turning points at one of the three levels shown in the chart by the red, green, and black levels. These only need to be updated weekly because they are slow moving and actually not exact. The additional 200 day MA is also key to the very long term 10 year picture which I posted last week and you can refer to this as part of the T Theory forecast for this update.
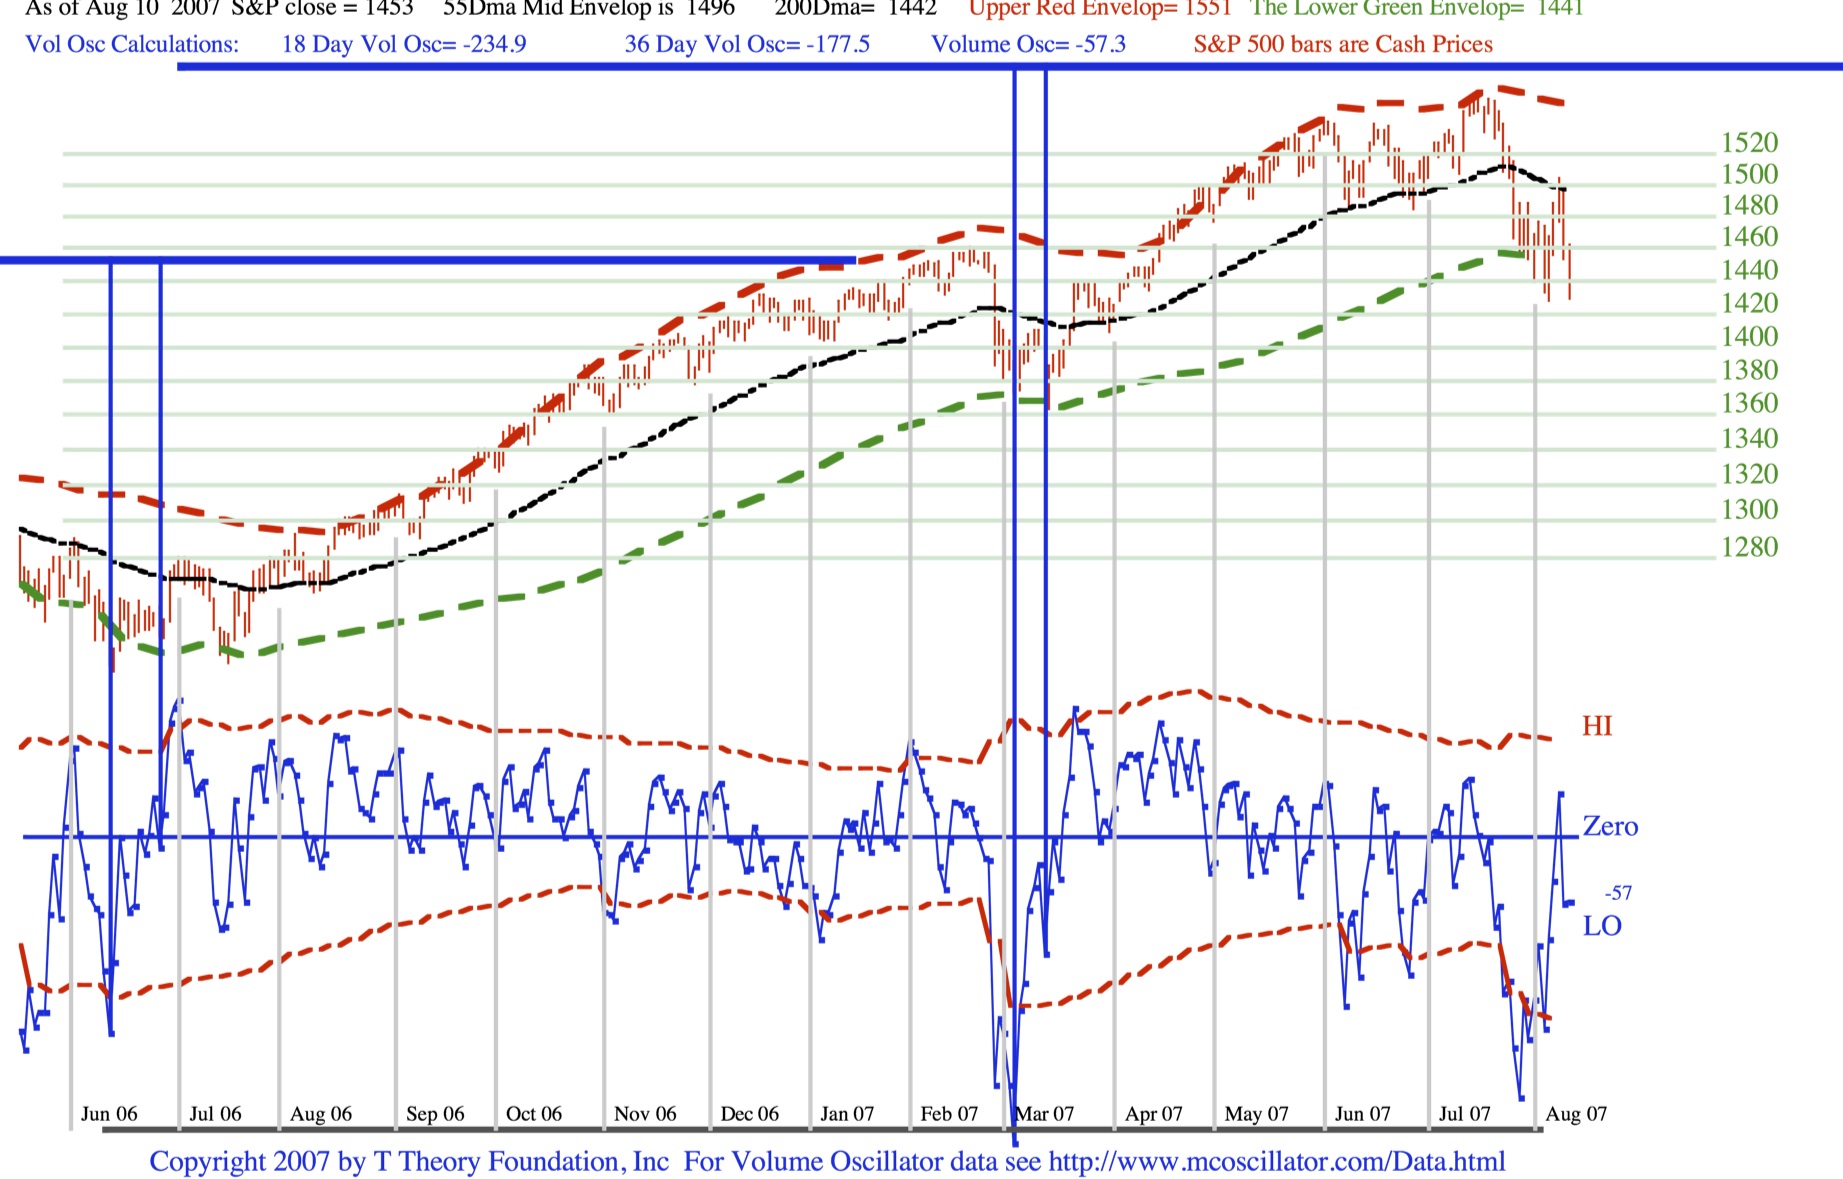
To illustrate, when the market fell sharply on August 3 and landed on the 200 day MA one would have expected a bounce up to the 55 day MA which in last weeks daily chart was around the S&P 1501 level. On Wednesday the S&P reached this level and closed up looking positive. But the next morning, reports of further mortgage securities problems put the market down from the start and eventually into a climatic Dow 380 point decline.
Once returning to the 200 day MA and stabilizing after a small penetration on last Friday we find ourselves again saying if the basing at the 200 Day MA holds further corrections, then the market will eventually try for the 55 day MA once again. If you look at the ten year chart, say during the year 2000, then you can see once the 40 week MA acts as persistent support to successive selling waves, then eventually the S&P is driven back up to its old highs.
August 6 Update:
I have provided a 10 year history of the S&P 500 on a weekly basis with its 40 week MA as a timing tool and a few notes in the chart that I will elaborate on during the month. Download the longer term PDF file below for this import bottom criteria.
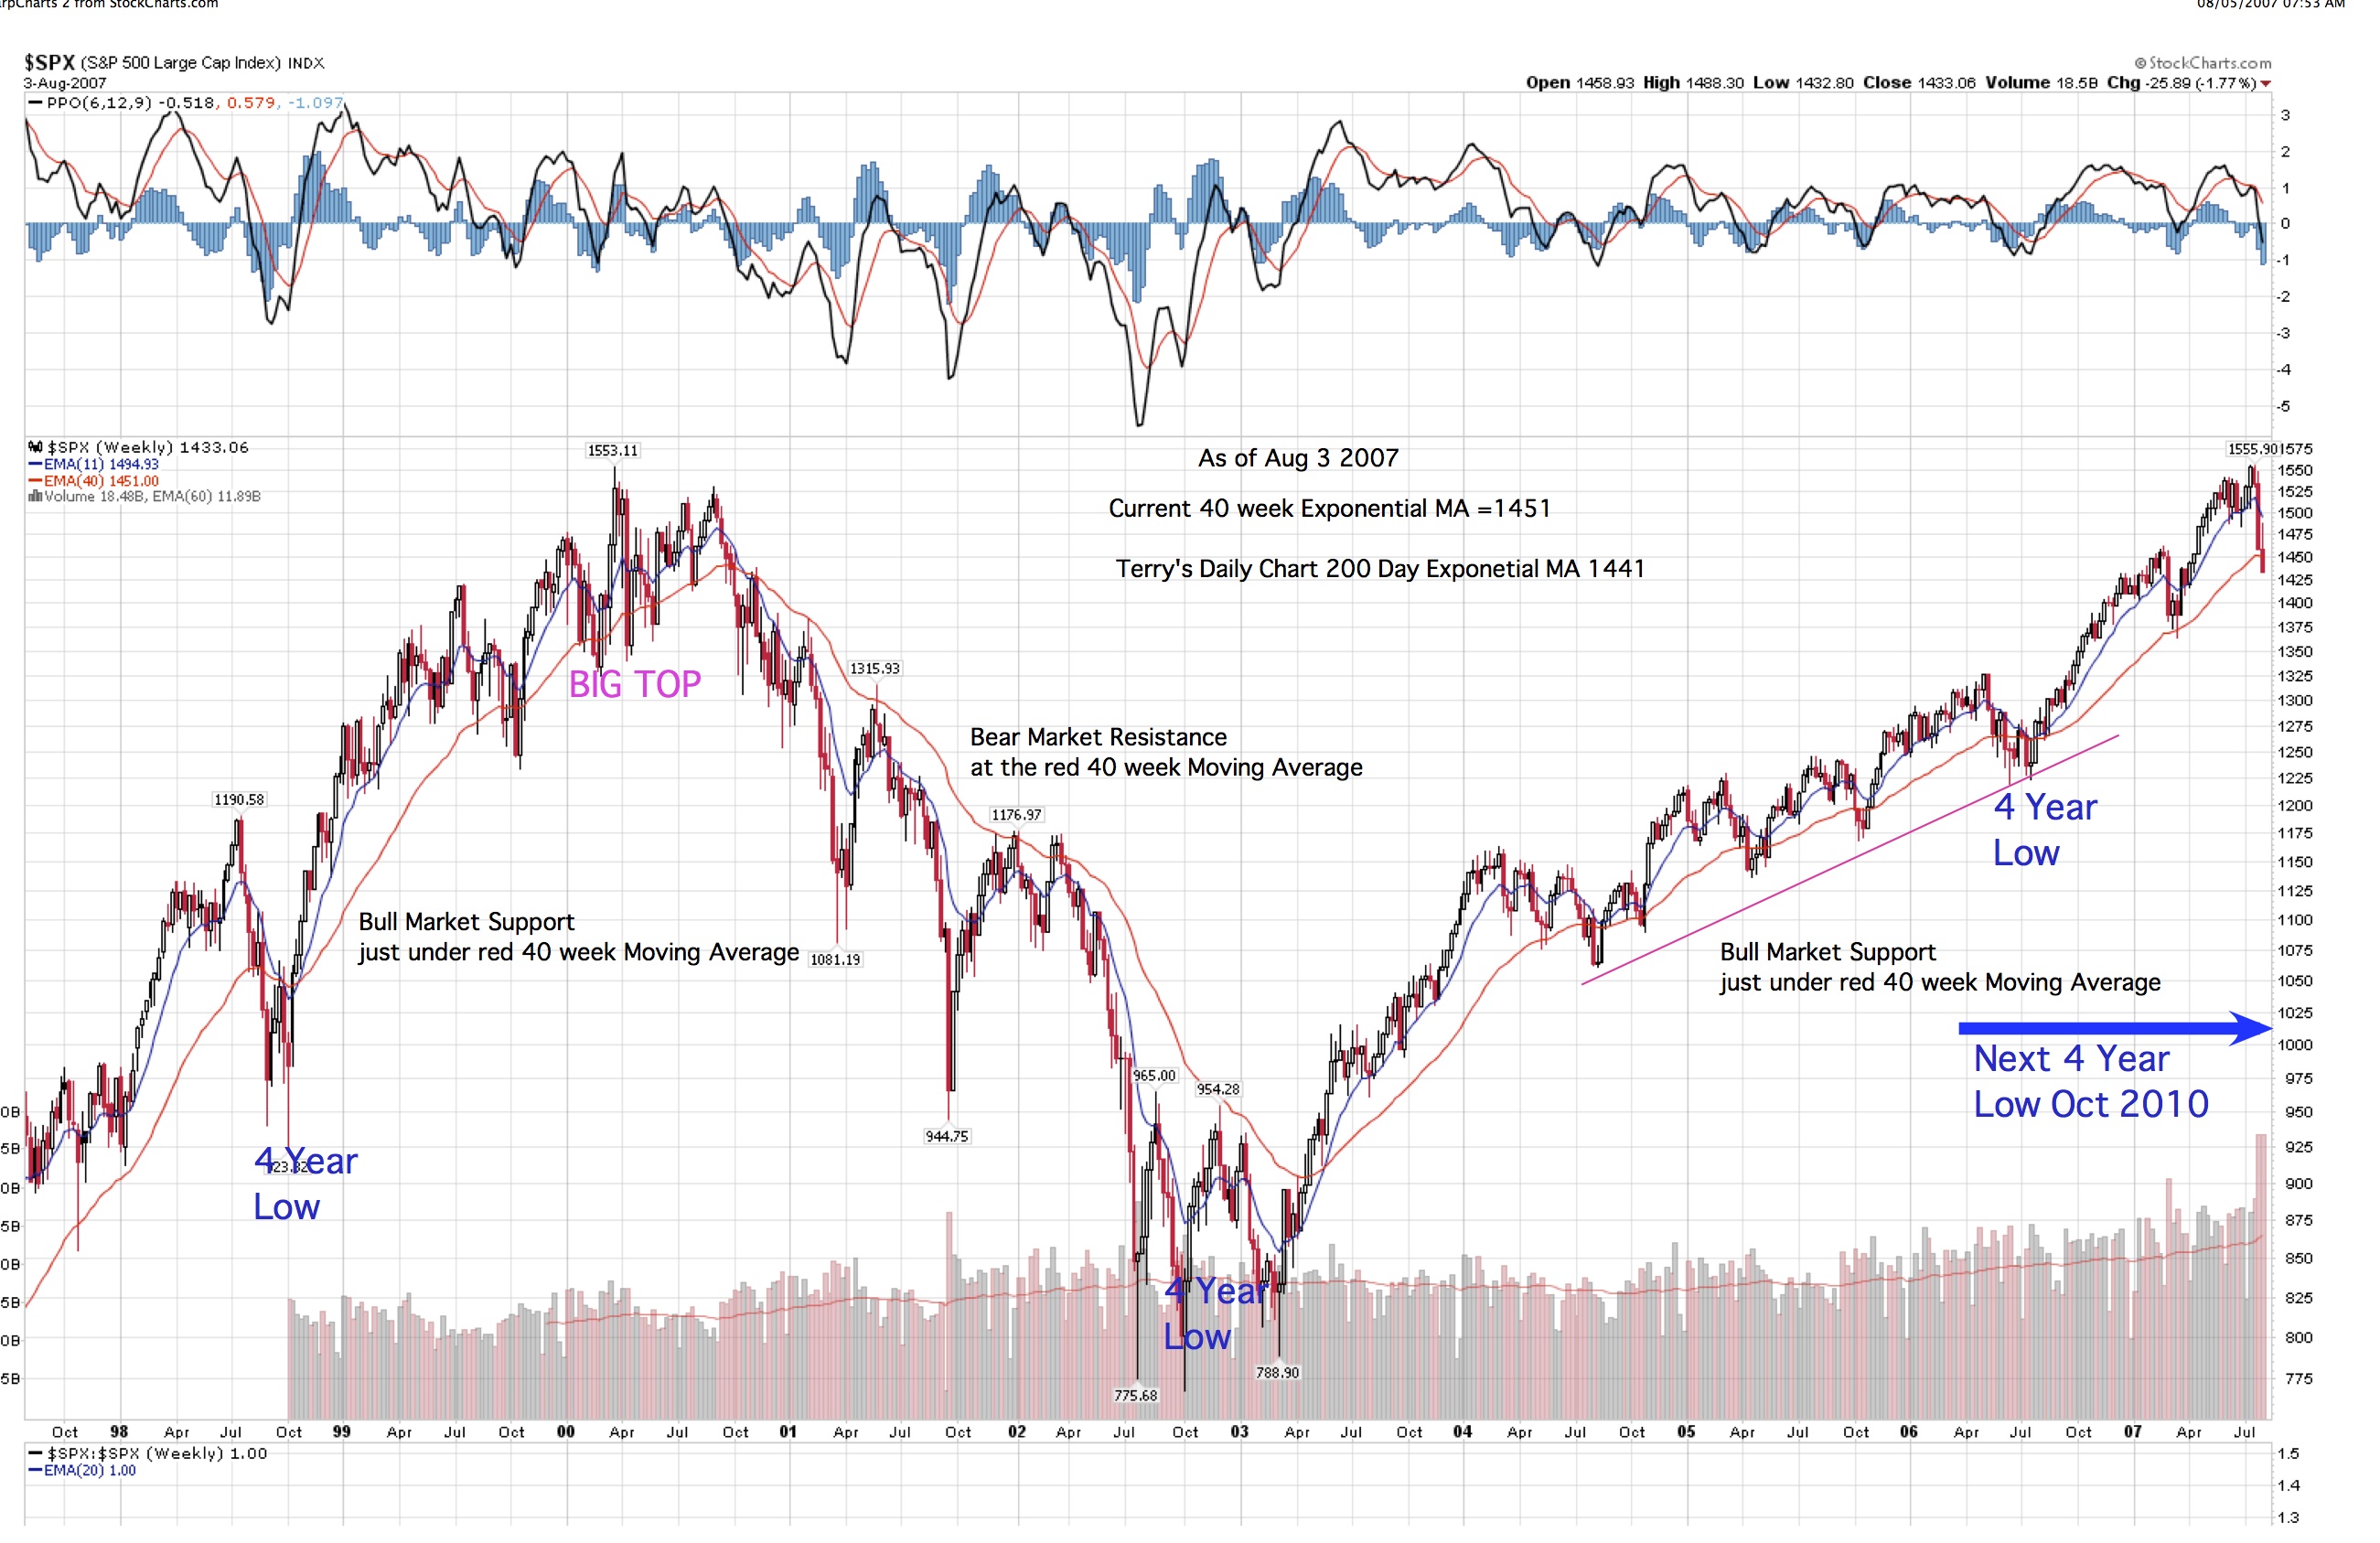
The main point is that when the trend is rising, all important low points along the up trend, develop when the S&P drops just a bit below the 40 Week MA shown here as the thin red line. The only serious exception are the well known periodic 4 Year Cycle lows I have noted and aren’t presently significant to our time period. The point is that the S&P on Friday closed just below the 40 week MA (1451) so a bottom is expected over the next few days.
Also note in the middle of the chart that I have calculated from my daily data with an exponential moving average of 200 days. This should be equivalent to 40 Weeks since 40 times 5 = 200 market days. However my data sees the 200 day MA 10 points lower at 1441. I like my numbers for reference but prefer the 10 year chart for perspective and lessons on how to find lows, etc.
The next file is my basic daily SRT and envelop chart. Note the 200 day is provided each week and is the important reference we need to watch. Buy points or bottoms are confirmed by a rising bottoms volume oscillator pattern at the 200 Day MA.
We seem to be in good shape here so I would look for a bounce up to the 55 day MA mid channel line then perhaps a retest of the 200 day MA to expand the strength of the eventual correction low.
Terry Laundry
****************************************************************************************
All Rights Reserved By The T Theory® Foundation ©
Order the T Theory® Encyclopedia
For a complete understanding of the T Theory® and how to successfully use Terry’s unique methods, order the Encyclopedia from Paula at the above link. There is additional material in the encyclopedia not covered here. Paula will be more than happy to answer your questions too.
Many thanks to Paula Burke for her permission to re-post Terry’s old T Theory® explanations. The period re-blogged on these pages are some of Terry Laundry’s best work and was published here from public domain.
****************************************************************************************
I claim no credit for the material found under T Theory® on this blog. All of this material is the creation of Terry Laundry and was downloaded from Terry’s free blog site (TypePad). I have created a mirror of Terry’s original material and now there is a second site containing Terry’s T Theory®. One or both of these websites hopefully will survive through time as Terry’s material is too important to be lost to the ravages of time. This site is simply a memorial to his lifetime work.
The page content re-blogged here is exactly as Terry created on his original webpages (saved on my computer with ScrapBook)). Nothing has been left out from the period Dec 2003 to June 2011. From Terry’s site, I made a lot of formatting changes, creating a more easily readable webpage appearance. The PDF chart duplicates of the JPEGs have been omitted for ease and speed of recreating Terry’s pages. References to PDF charts should be ignored (but no chart was left out).
After June 2011, Terry created a paid subscription website. None of that material is found here.
There were many many, many hours spent on this project; downloading Terry’s individual charts & audio files, followed by the uploading of Terry’s charts and audio to my WordPress blog library, after which I had to insert the uploaded material into my new T Theory® webpages (hopefully in the correct places). This was a dull and arduous project and I hope you enjoy it. I don’t believe there remains any more of Terry’s material in free domain, so my T Theory® project is probably finished. If I’ve missed something, you can leave me a comment.
If you find an uploaded reference error (chart or audio in the wrong place), please note the month and year of the webpage, plus the exact name of the referenced error file. Include any other info that will help me locate the problem file and where it occurs on the webpage. Leave a comment for me with the info and I’ll fix it.
Terry’s material is very long and will take many weeks for you to finish. Don’t hurry, it’s not a marathon and you will absorb more if you go through it at a reasonable rate. This is especially true for those who don’t invest in the T Theory® reference encyclopedia. The encyclopedia is a written reference for T Theory® and includes everything of importance for Terry’s T Theory®. Without the reference encyclopedia you must depend on your memory and Terry’s method carries some rules that you could easily violate. The encyclopedia also includes new information never seen on his website.
You are welcome to save any or all of my blog material to your computer. You also have my permission to re-blog my information, but you must (1) credit me and my blog in an obvious manner and (2) don’t change my material.
FYI – I find the best way to save a webpage is using “ScrapBook” (it’s an add-on for the FireFox browser). ScrapBook saves a webpage to your computer EXACTLY as it appears on the day you saved it. You can’t tell the difference between the internet webpage and your ScrapBook saved webpage. The saved pages are not pictures. Instead the pages consist of HTML and page functionality remains identical on your computer. There is also a second method for using ScrapBook, where you can save all of the webpages down to a defined link depth. This optional method means all links will function on your computer to the link depth specified (meaning you can click on links on your saved webpages and tunnel down into pages within pages). Saving the normal way will only save the top webpage but the links that exist could continue to function by taking you to the website on the internet instead of on your computer. But sometimes the linked website doesn’t exist anymore. I’ve had this happen on some very good webpages with unique information (they just disappear into the internet void). That’s a bummer when you lost some really good info and thus rose my need for ScrapBook. You can also filter the pages saved using the optional ScrapBook method, which can exclude all pages not coming directly from the specified website (filtering is recommended using this method otherwise you wind up with a LOT of useless stuff).
.
Explore posts in the same categories: . . . T Theory®
Leave A Reply